Agenda
Multivariate Analysis
MANOVA
(Discriminant analysis)
Survival analysis
Power analysis
Missing data
Feedback of self-assessment 1
3.
Multivariate Analysis
• Simultaneouslyanalyze multiple measurements
on individuals or objects under investigation.
• An extension of univariate analysis
• MANOVA
• Uniquely designed to deal with multivariate issues
• Factor analysis
4.
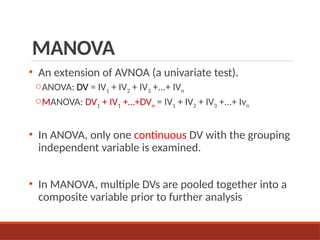
MANOVA
• An extensionof AVNOA (a univariate test).
oANOVA: DV = IV1 + IV2 + IV3 +...+ IVn
oMANOVA: DV1 + IV1 +…+DVn = IV1 + IV2 + IV3 +...+ Ivn
• In ANOVA, only one continuous DV with the grouping
independent variable is examined.
• In MANOVA, multiple DVs are pooled together into a
composite variable prior to further analysis
5.
MANOVA
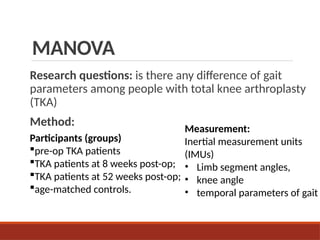
Research questions: isthere any difference of gait
parameters among people with total knee arthroplasty
(TKA)
Method:
Measurement:
Inertial measurement units
(IMUs)
• Limb segment angles,
• knee angle
• temporal parameters of gait
Participants (groups)
pre-op TKA patients
TKA patients at 8 weeks post-op;
TKA patients at 52 weeks post-op;
age-matched controls.
6.
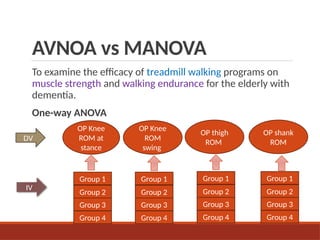
AVNOA vs MANOVA
Toexamine the efficacy of treadmill walking programs on
muscle strength and walking endurance for the elderly with
dementia.
One-way ANOVA
Group 1
Group 2
Group 3
Group 4
OP Knee
ROM at
stance
Group 1
Group 2
Group 3
Group 4
OP Knee
ROM
swing
Group 1
Group 2
Group 3
Group 4
OP thigh
ROM
Group 1
Group 2
Group 3
Group 4
OP shank
ROM
DV
IV
7.
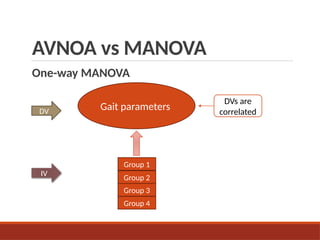
AVNOA vs MANOVA
One-wayMANOVA
DVs are
correlated
Gait parameters
Group 1
Group 2
Group 3
Group 4
DV
IV
8.
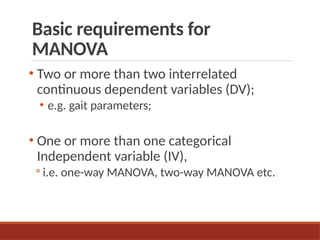
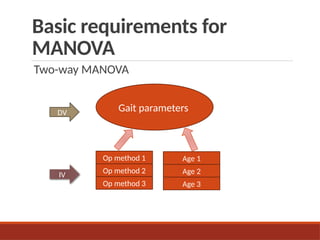
Basic requirements for
MANOVA
•Two or more than two interrelated
continuous dependent variables (DV);
• e.g. gait parameters;
• One or more than one categorical
Independent variable (IV),
◦ i.e. one-way MANOVA, two-way MANOVA etc.
When should weuse
MANOVA?
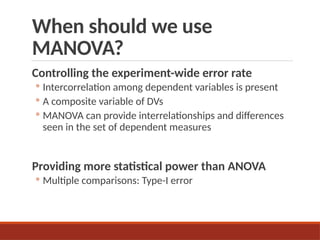
Controlling the experiment-wide error rate
◦ Intercorrelation among dependent variables is present
◦ A composite variable of DVs
◦ MANOVA can provide interrelationships and differences
seen in the set of dependent measures
Providing more statistical power than ANOVA
◦ Multiple comparisons: Type-I error
11.
When should weuse
MANOVA?
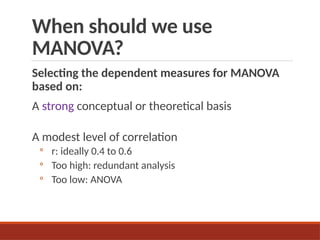
Selecting the dependent measures for MANOVA
based on:
A strong conceptual or theoretical basis
A modest level of correlation
◦ r: ideally 0.4 to 0.6
◦ Too high: redundant analysis
◦ Too low: ANOVA
12.
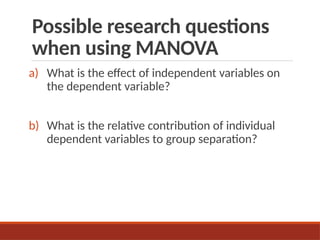
Possible research questions
whenusing MANOVA
a) What is the effect of independent variables on
the dependent variable?
b) What is the relative contribution of individual
dependent variables to group separation?
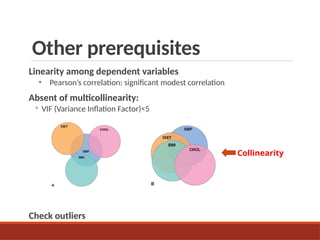
Assumptions of MANOVA
1)Assumption of independence
◦ All participants are randomly sampled
◦ The score on a variable for any one participant is
independent from the scores of this variable for
all other participants.
15.
Assumptions of MANOVA
2)Multivariate normality:
◦ For dependent variables
◦ Multivariate normal distribution: joint effect of two DVs is normally
distributed
◦ May not be evaluated directly
Can check normality for each DV in each group separately
◦ Violation—variables transformation
16.
Assumptions of MANOVA
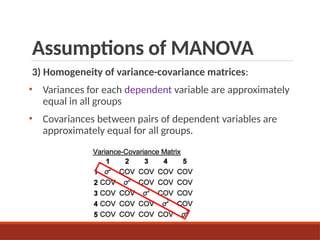
3)Homogeneity of variance-covariance matrices:
• Variances for each dependent variable are approximately
equal in all groups
• Covariances between pairs of dependent variables are
approximately equal for all groups.
17.
Assumptions of MANOVA
3)Homogeneity of variance-covariance matrices:
◦ Box’s M test can be used to test this assumption.
◦ Box’s M test Ho is accepted (p>0.05)
◦ assumption is fulfilled
◦ Box’s M test is sensitive to sample size
◦ Larger sample size, easier to get Box’s M test rejected.
◦ Set P<0.01 rather than 0.05
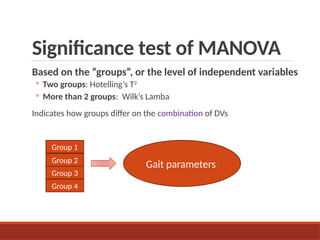
Significance test ofMANOVA
Based on the “groups”, or the level of independent variables
◦ Two groups: Hotelling’s T2
◦ More than 2 groups: Wilk’s Lamba
Indicates how groups differ on the combination of DVs
Gait parameters
Group 1
Group 2
Group 3
Group 4
20.
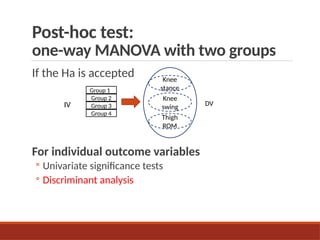
Post-hoc test:
one-way MANOVAwith two groups
If the Ha is accepted
For individual outcome variables
◦ Univariate significance tests
◦ Discriminant analysis
Group 1
Group 2
IV DV
Knee
stance
Knee
swing
Thigh
ROM
Group 3
Group 4
21.
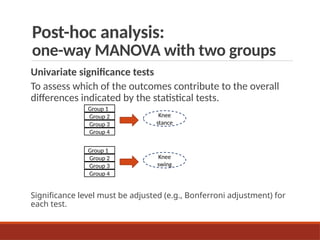
Post-hoc analysis:
one-way MANOVAwith two groups
Univariate significance tests
To assess which of the outcomes contribute to the overall
differences indicated by the statistical tests.
Significance level must be adjusted (e.g., Bonferroni adjustment) for
each test.
Knee
stance
Group 1
Group 2
Group 3
Group 4
Knee
swing
Group 1
Group 2
Group 3
Group 4
22.
Post-hoc analysis:
one-way MANOVAwith two groups
“Discriminant analysis is often used as a post-hoc
procedure for a MANOVA, preferable to multiple
ANOVAs because it maintains the integrity of the
multivariate research question.”
Portney (2020)
23.
Post-hoc analysis:
one-way MANOVAwith two groups
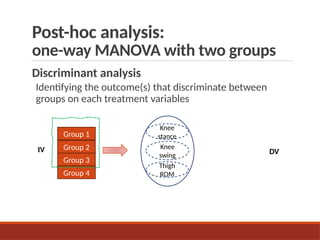
Discriminant analysis
Identifying the outcome(s) that discriminate between
groups on each treatment variables
IV DV
Group 1
Group 2
Group 3
Group 4
Knee
stance
Knee
swing
Thigh
ROM
24.
Post-hoc analysis:
one-way MANOVAwith two groups
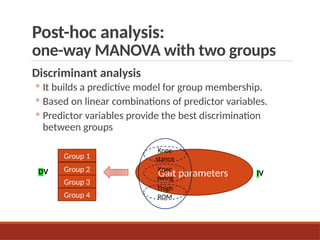
Discriminant analysis
◦ It builds a predictive model for group membership.
◦ Based on linear combinations of predictor variables.
◦ Predictor variables provide the best discrimination
between groups
DV IV
Gait parameters
Group 1
Group 2
Group 3
Group 4
Knee
stance
Knee
swing
Thigh
ROM
25.
Discriminant analysis
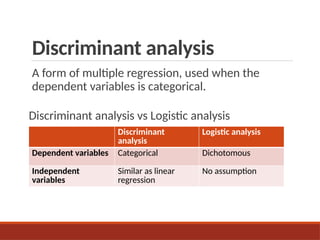
A formof multiple regression, used when the
dependent variables is categorical.
Discriminant analysis vs Logistic analysis
Discriminant
analysis
Logistic analysis
Dependent variables Categorical Dichotomous
Independent
variables
Similar as linear
regression
No assumption
26.
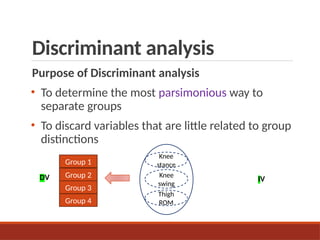
Discriminant analysis
Purpose ofDiscriminant analysis
• To determine the most parsimonious way to
separate groups
• To discard variables that are little related to group
distinctions
DV IV
Group 1
Group 2
Group 3
Group 4
Knee
stance
Knee
swing
Thigh
ROM
27.
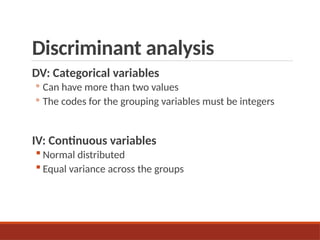
Discriminant analysis
DV: Categoricalvariables
◦ Can have more than two values
◦ The codes for the grouping variables must be integers
IV: Continuous variables
Normal distributed
Equal variance across the groups
28.
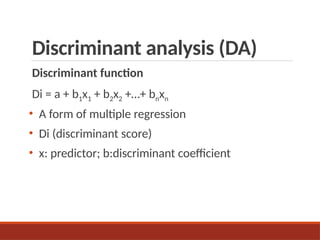
Discriminant analysis (DA)
Discriminantfunction
Di = a + b1x1 + b2x2 +…+ bnxn
• A form of multiple regression
• Di (discriminant score)
• x: predictor; b:discriminant coefficient
29.
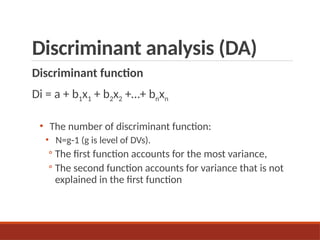
Discriminant analysis (DA)
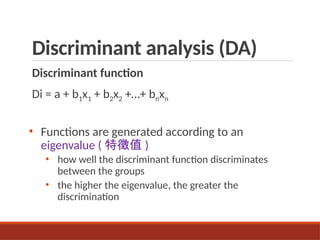
Discriminantfunction
Di = a + b1x1 + b2x2 +…+ bnxn
• The number of discriminant function:
• N=g-1 (g is level of DVs).
◦ The first function accounts for the most variance,
◦ The second function accounts for variance that is not
explained in the first function
30.
Discriminant analysis (DA)
Discriminantfunction
Di = a + b1x1 + b2x2 +…+ bnxn
• Functions are generated according to an
eigenvalue ( 特徵值 )
• how well the discriminant function discriminates
between the groups
• the higher the eigenvalue, the greater the
discrimination
31.
Discriminant analysis (DA)
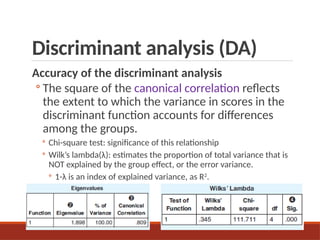
Accuracyof the discriminant analysis
◦ The square of the canonical correlation reflects
the extent to which the variance in scores in the
discriminant function accounts for differences
among the groups.
◦ Chi-square test: significance of this relationship
◦ Wilk’s lambda(λ): estimates the proportion of total variance that is
NOT explained by the group effect, or the error variance.
◦ 1-λ is an index of explained variance, as R2
.
32.
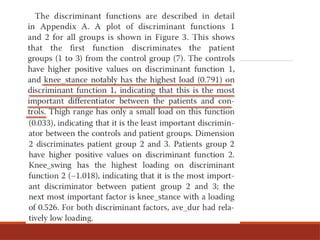
Discriminant analysis (DA)
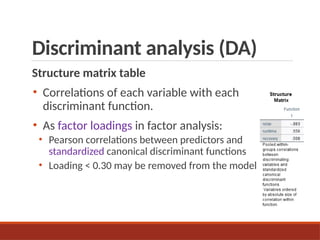
Structurematrix table
• Correlations of each variable with each
discriminant function.
• As factor loadings in factor analysis:
• Pearson correlations between predictors and
standardized canonical discriminant functions
• Loading < 0.30 may be removed from the model.
33.
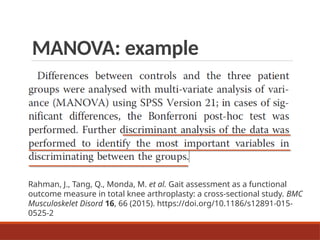
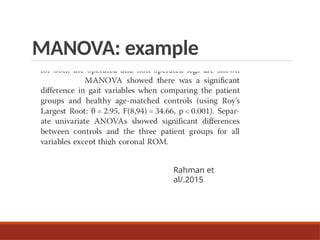
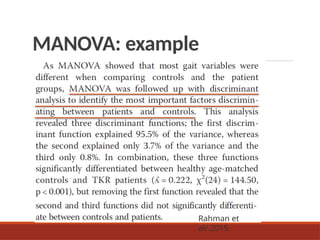
MANOVA: example
Rahman, J.,Tang, Q., Monda, M. et al. Gait assessment as a functional
outcome measure in total knee arthroplasty: a cross-sectional study. BMC
Musculoskelet Disord 16, 66 (2015). https://doi.org/10.1186/s12891-015-
0525-2
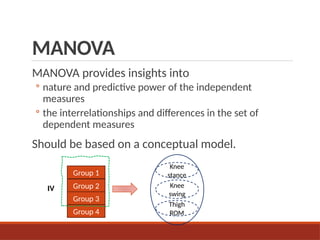
MANOVA
MANOVA provides insightsinto
◦ nature and predictive power of the independent
measures
◦ the interrelationships and differences in the set of
dependent measures
Should be based on a conceptual model.
IV
Group 1
Group 2
Group 3
Group 4
Knee
stance
Knee
swing
Thigh
ROM
40.
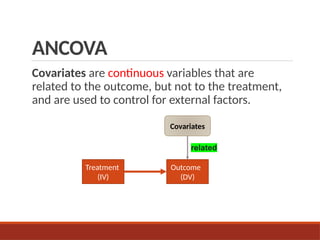
ANCOVA
Covariates are continuousvariables that are
related to the outcome, but not to the treatment,
and are used to control for external factors.
Treatment
(IV)
Outcome
(DV)
Covariates
related
41.
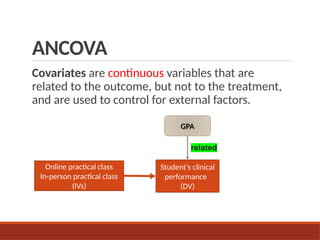
ANCOVA
Covariates are continuousvariables that are
related to the outcome, but not to the treatment,
and are used to control for external factors.
Online practical class
In-person practical class
(IVs)
Student’s clinical
performance
(DV)
GPA
related
42.
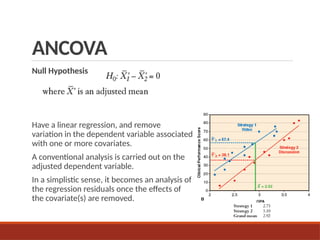
ANCOVA
Null Hypothesis
Have alinear regression, and remove
variation in the dependent variable associated
with one or more covariates.
A conventional analysis is carried out on the
adjusted dependent variable.
In a simplistic sense, it becomes an analysis of
the regression residuals once the effects of
the covariate(s) are removed.
43.
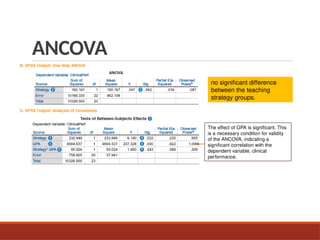
ANCOVA
no significant difference
betweenthe teaching
strategy groups.
The effect of GPA is significant. This
is a necessary condition for validity
of the ANCOVA, indicating a
significant correlation with the
dependent variable, clinical
performance.
44.
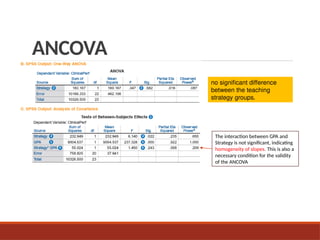
ANCOVA
no significant difference
betweenthe teaching
strategy groups.
The interaction between GPA and
Strategy is not significant, indicating
homogeneity of slopes. This is also a
necessary condition for the validity
of the ANCOVA
45.
ANCOVA
Assumptions for CovarianceAnalysis
1 The covariates must have some relationship
(correlation) with the dependent measures.
2 The covariates must have a homogeneity of
regression effect.
46.
Reference
Hair, J. F.(2009). Multivariate data analysis.
Portney LG, Watkins MP. Foundations of Clinical
Research. Applications to Practice. 3rd ed. Upper
Saddle Rive, NJ: Prentice Hall Health, 2009.
Portney LG, Foundations of Clinical Research.
Applications to Practice. 4th. FA Davis, 2020.
Warne, R. T. (2014). A primer on multivariate analysis of
variance (MANOVA) for behavioral scientists. Practical
Assessment, Research & Evaluation, 19.