Downloaded 17 times
![Inves%ga%on
of
near-‐surface
hydrogen
• Mo%vated
by
the
possible
driving
mechanism
for
the
mild
baking
effect
–
Vac-‐H
complexes
dissocia%on
occuring
around
100-‐120C
• Leading
to
the
elimina%on
of
the
HFQS
by
– LaJce
defect
density
reduc%on
in
the
near-‐
surface
layer?
[A
Romanenko
and
H
Padamsee
2010
Supercond.
Sci.
Technol.
23
045008]
– Or
hydrogen
concentra%on
decrease?
-‐
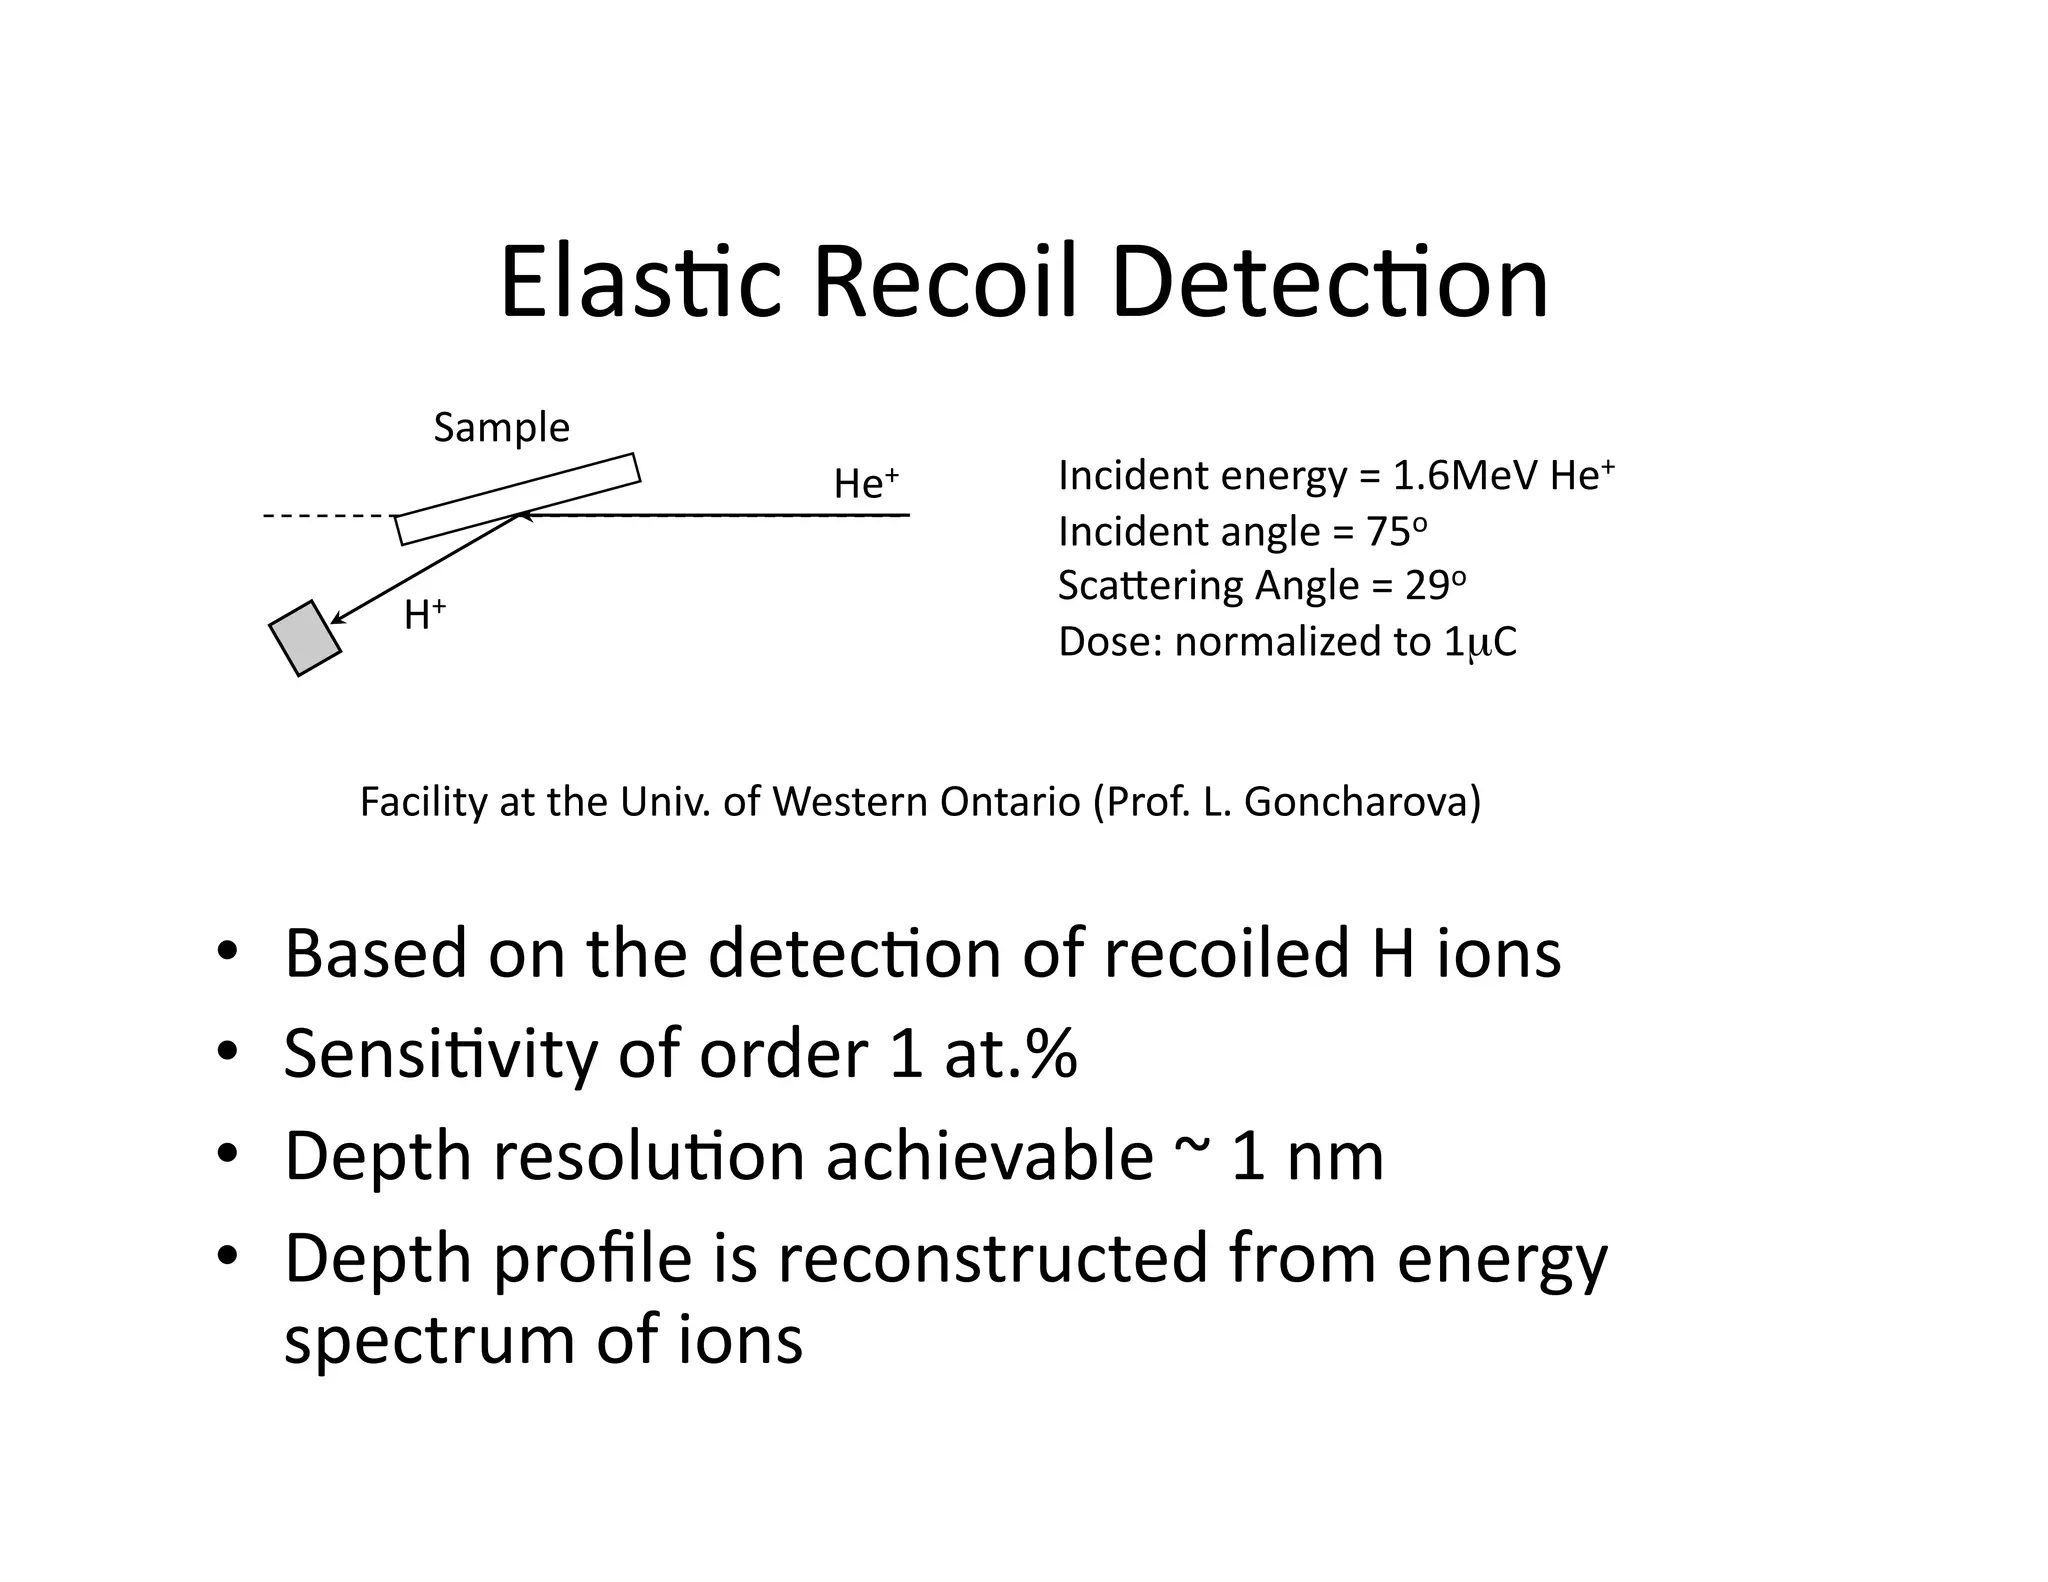
inves%gated
by
Elas%c
Recoil
Detec%on
(ERD)](https://image.slidesharecdn.com/erdromanenkotf2010-101005090658-phpapp01/75/Romanenko-Elastic-Recoil-Detection-and-Positron-Annihilation-Studies-of-the-Mild-Baking-Effect-9-2048.jpg)
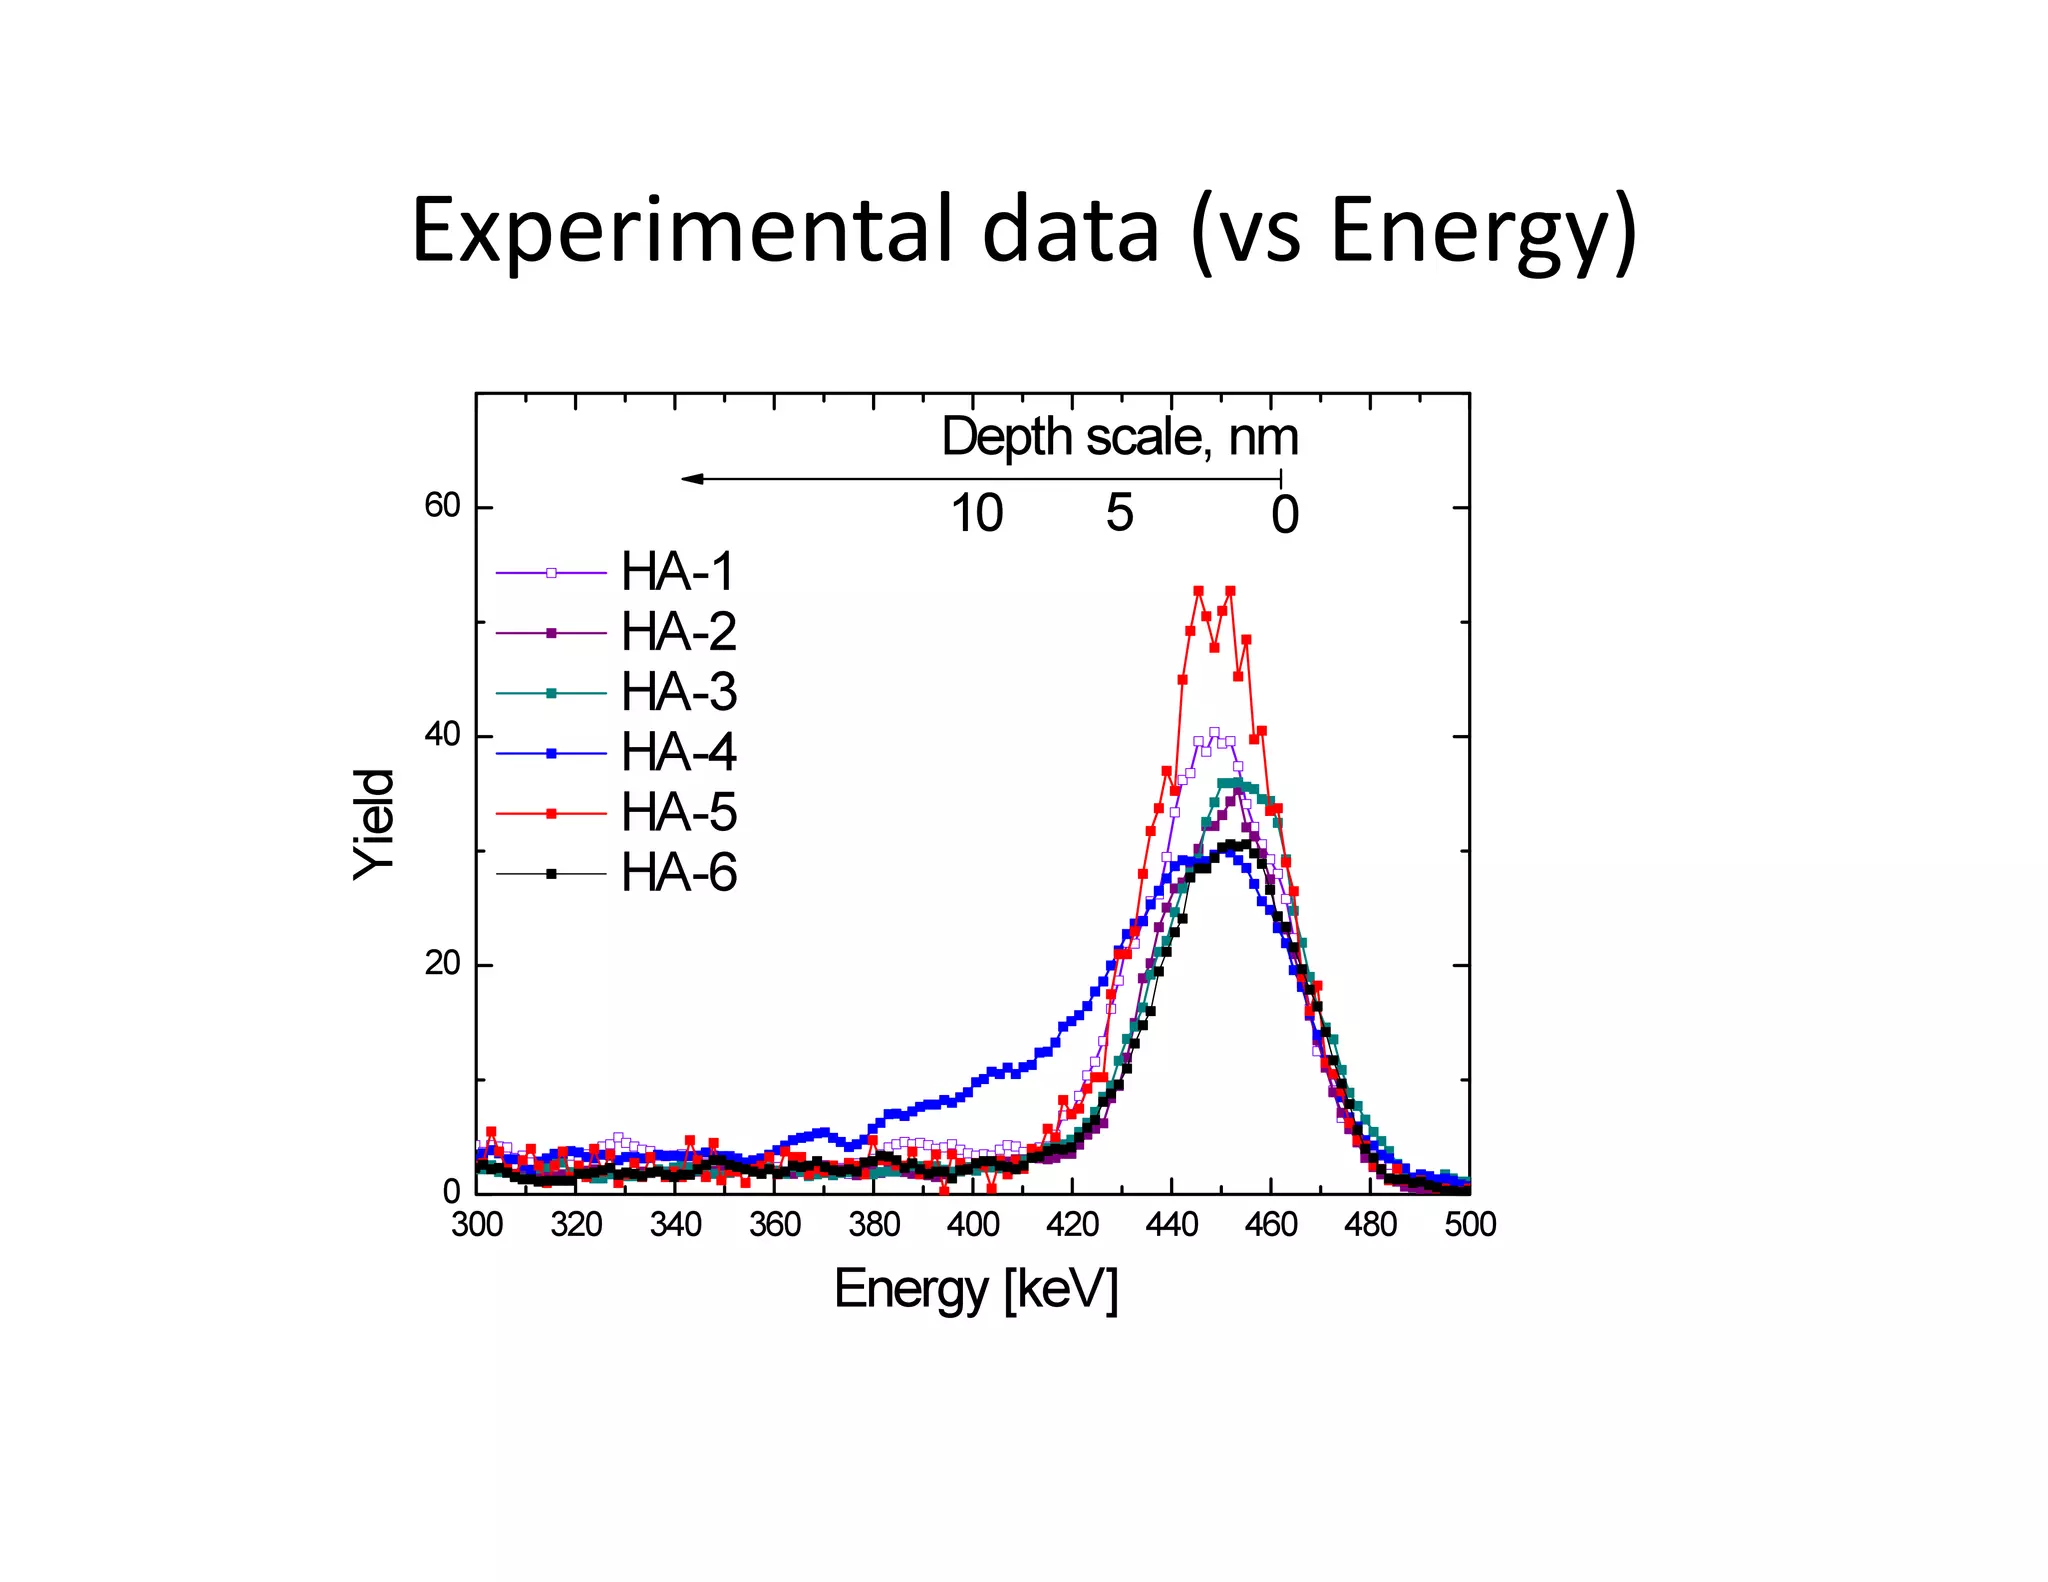
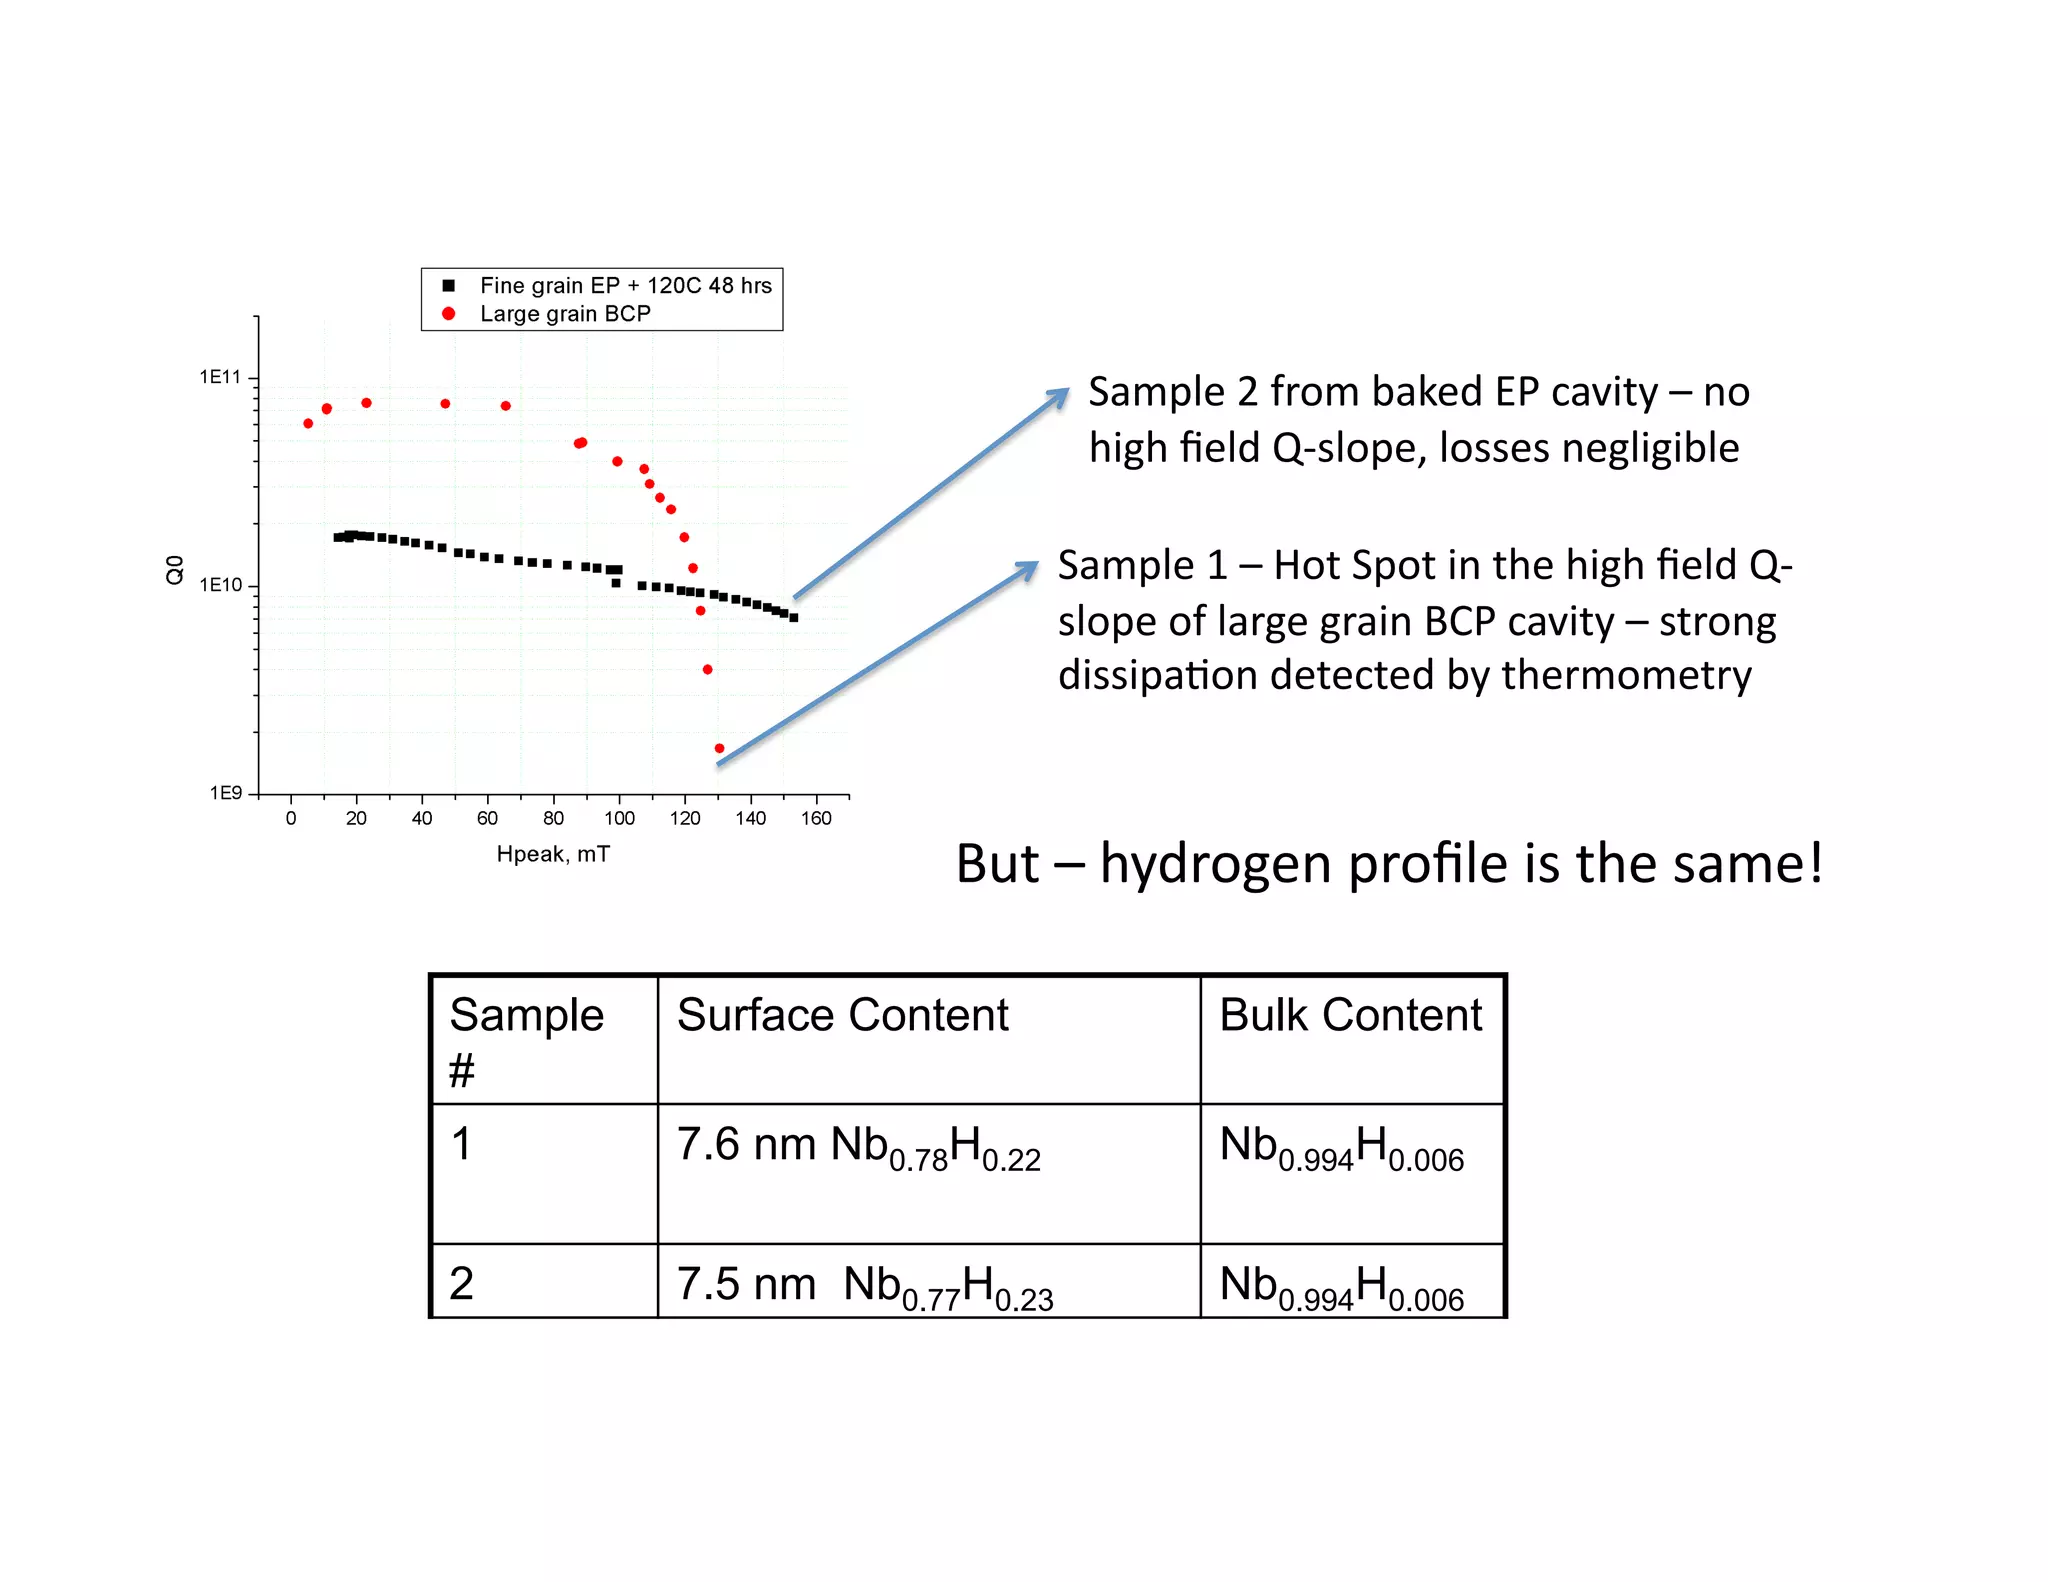

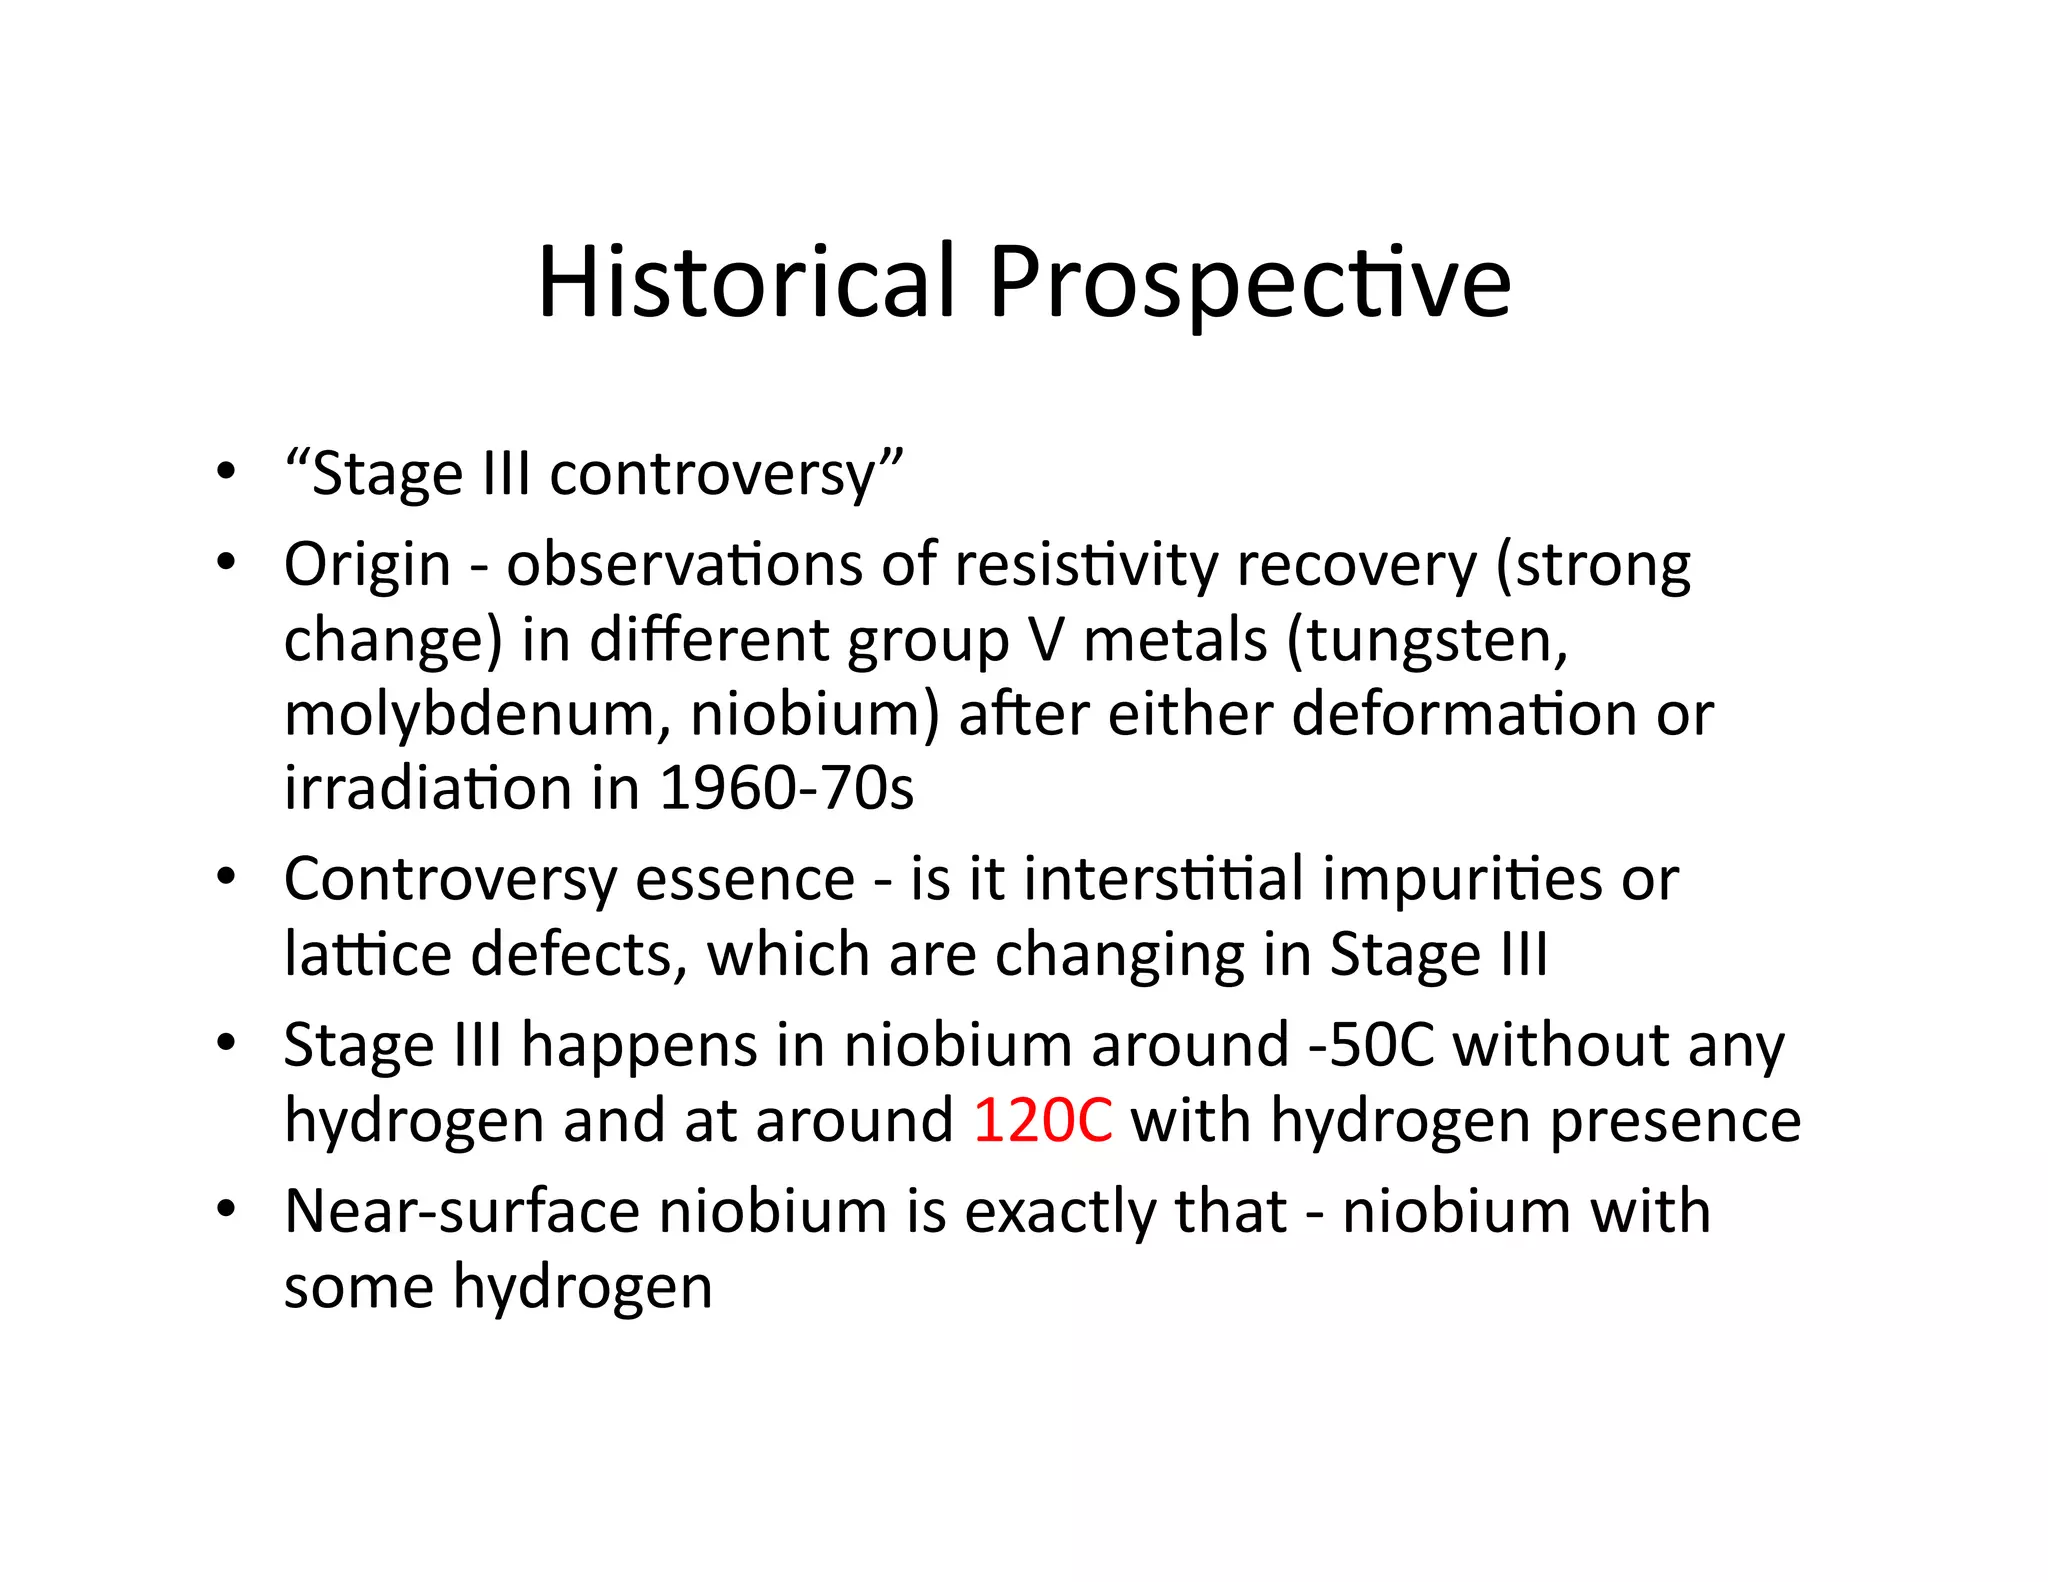
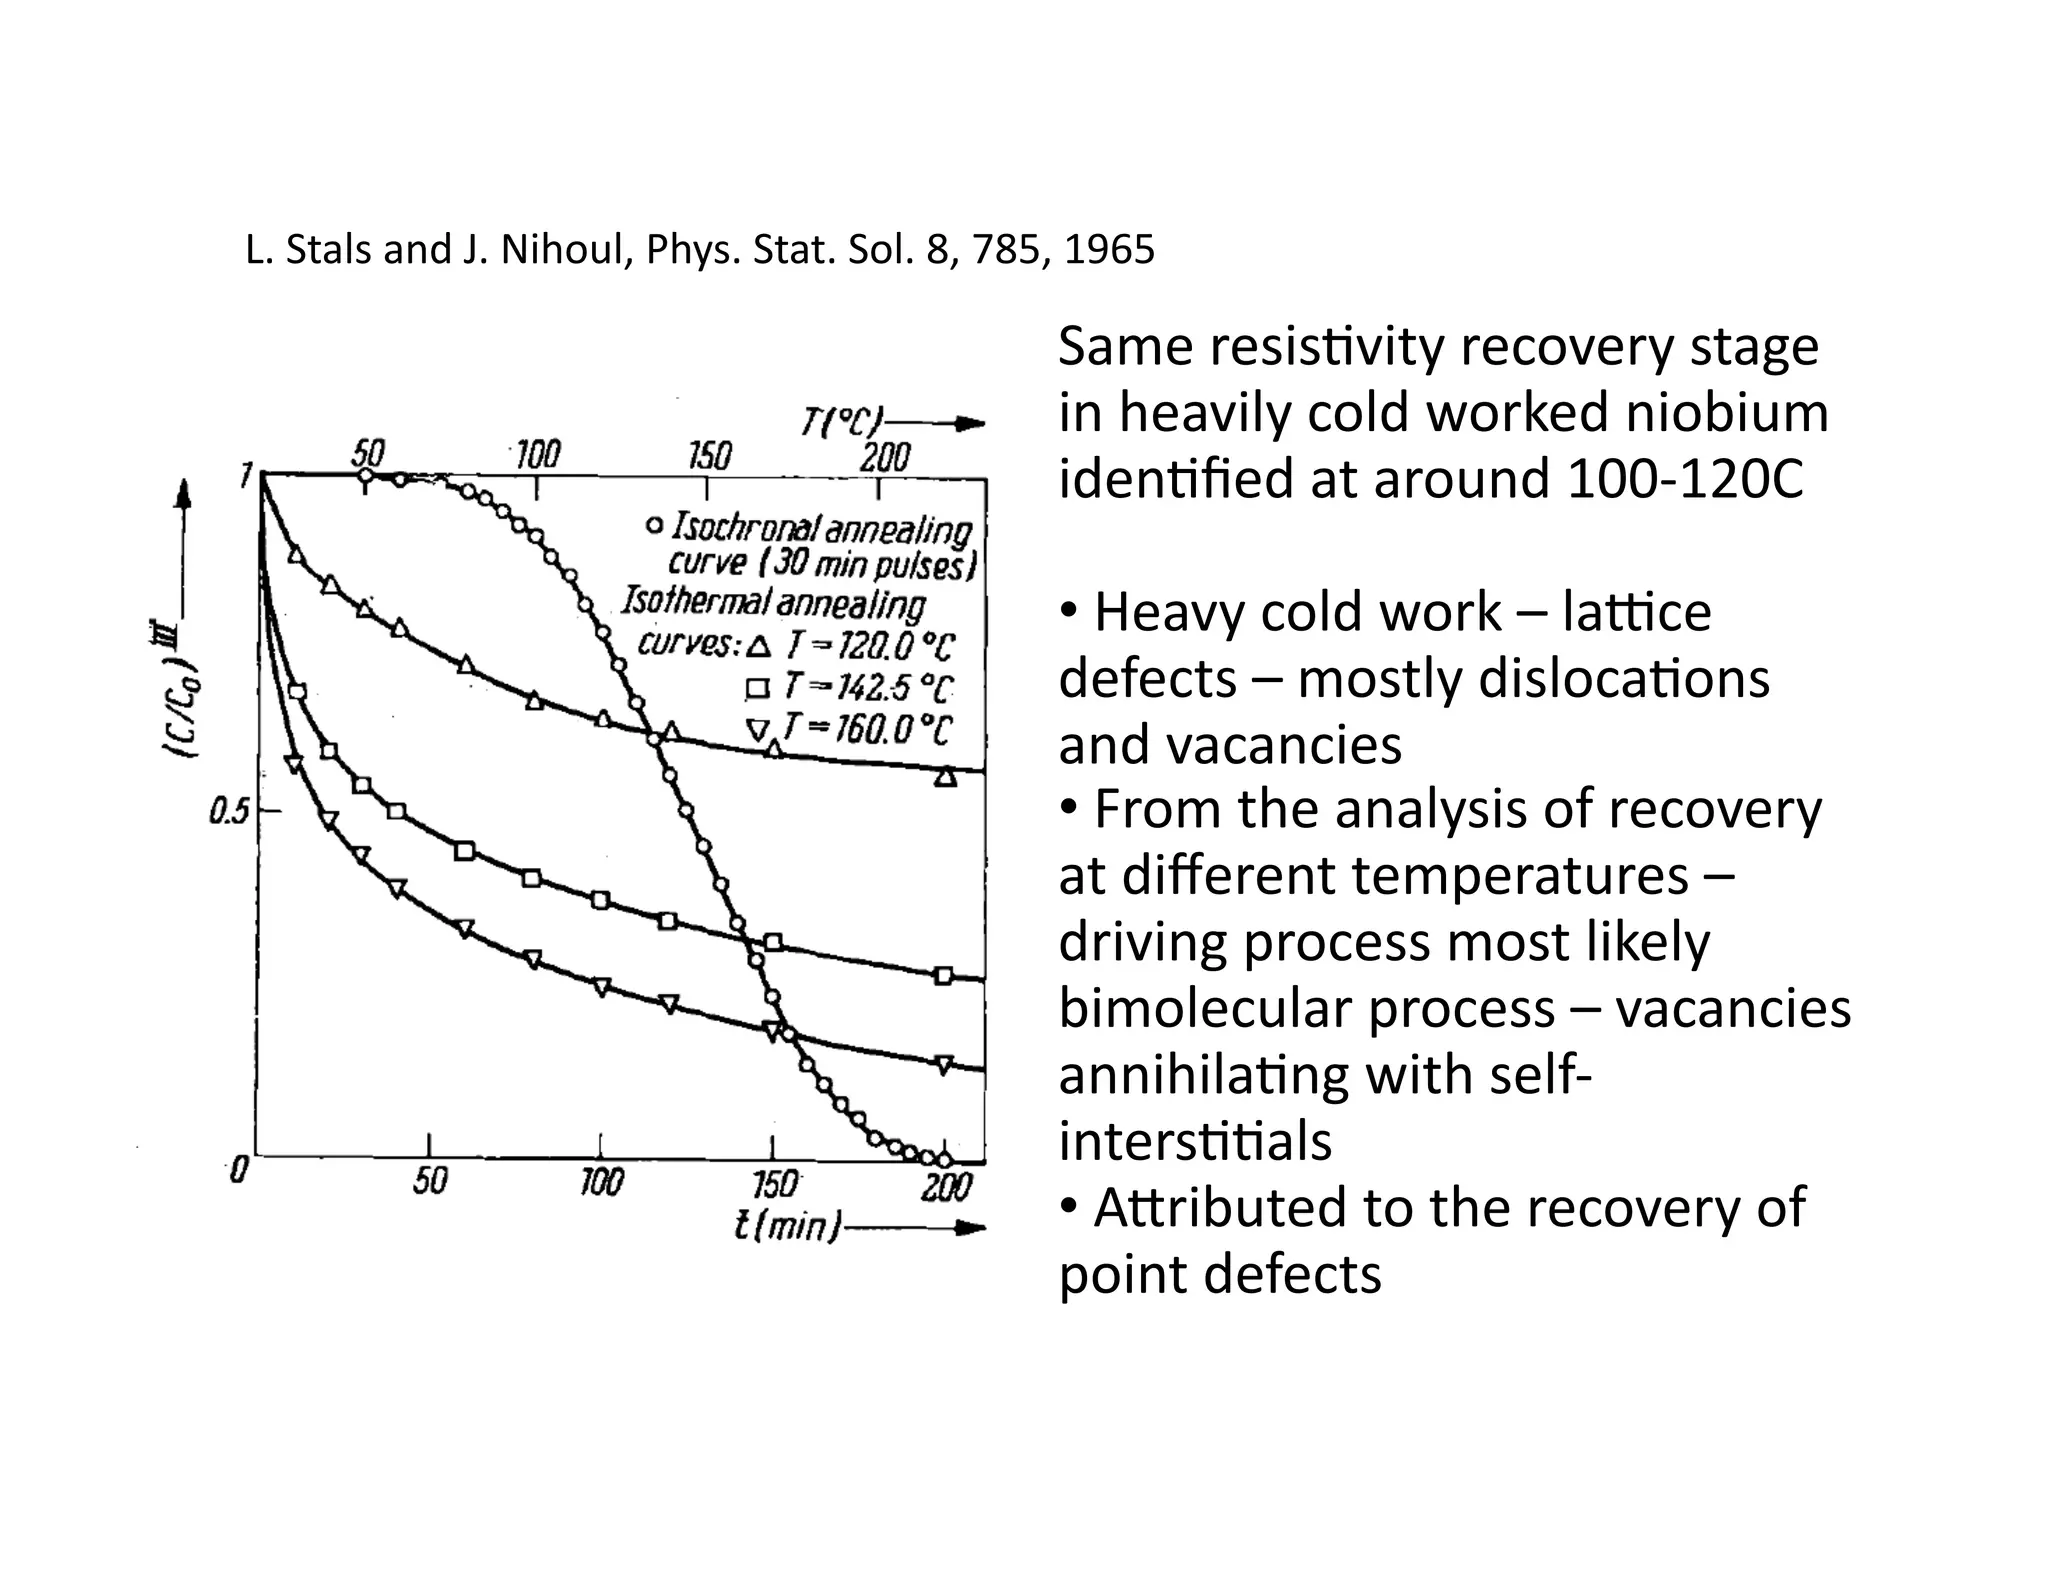
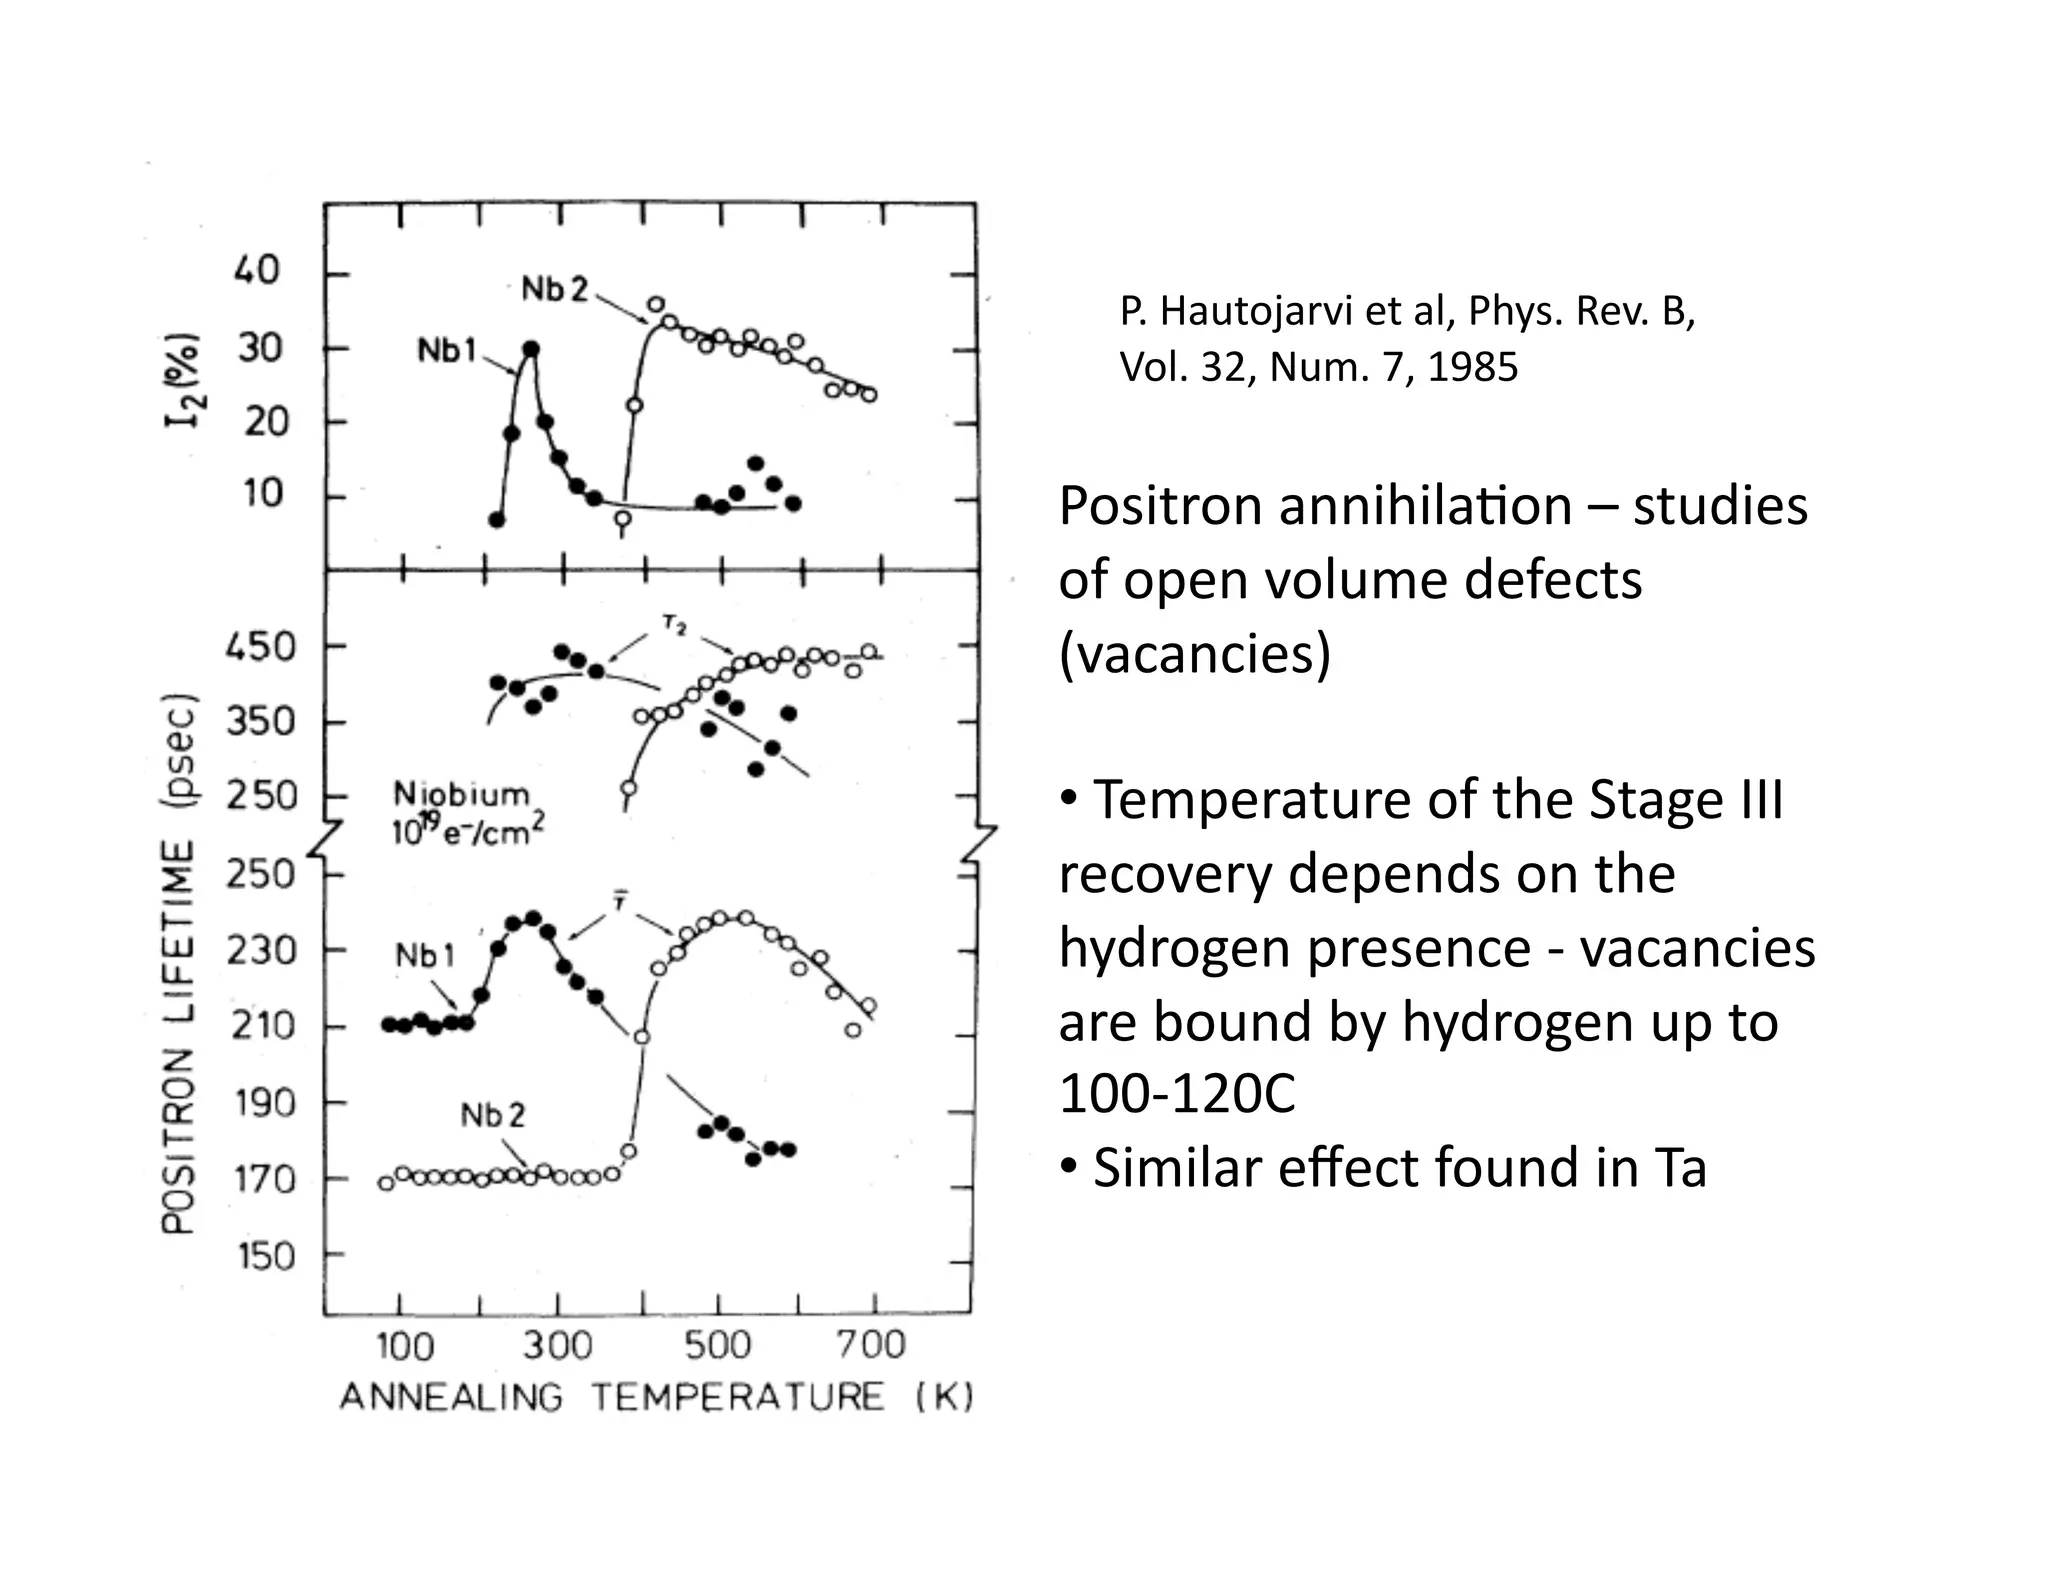
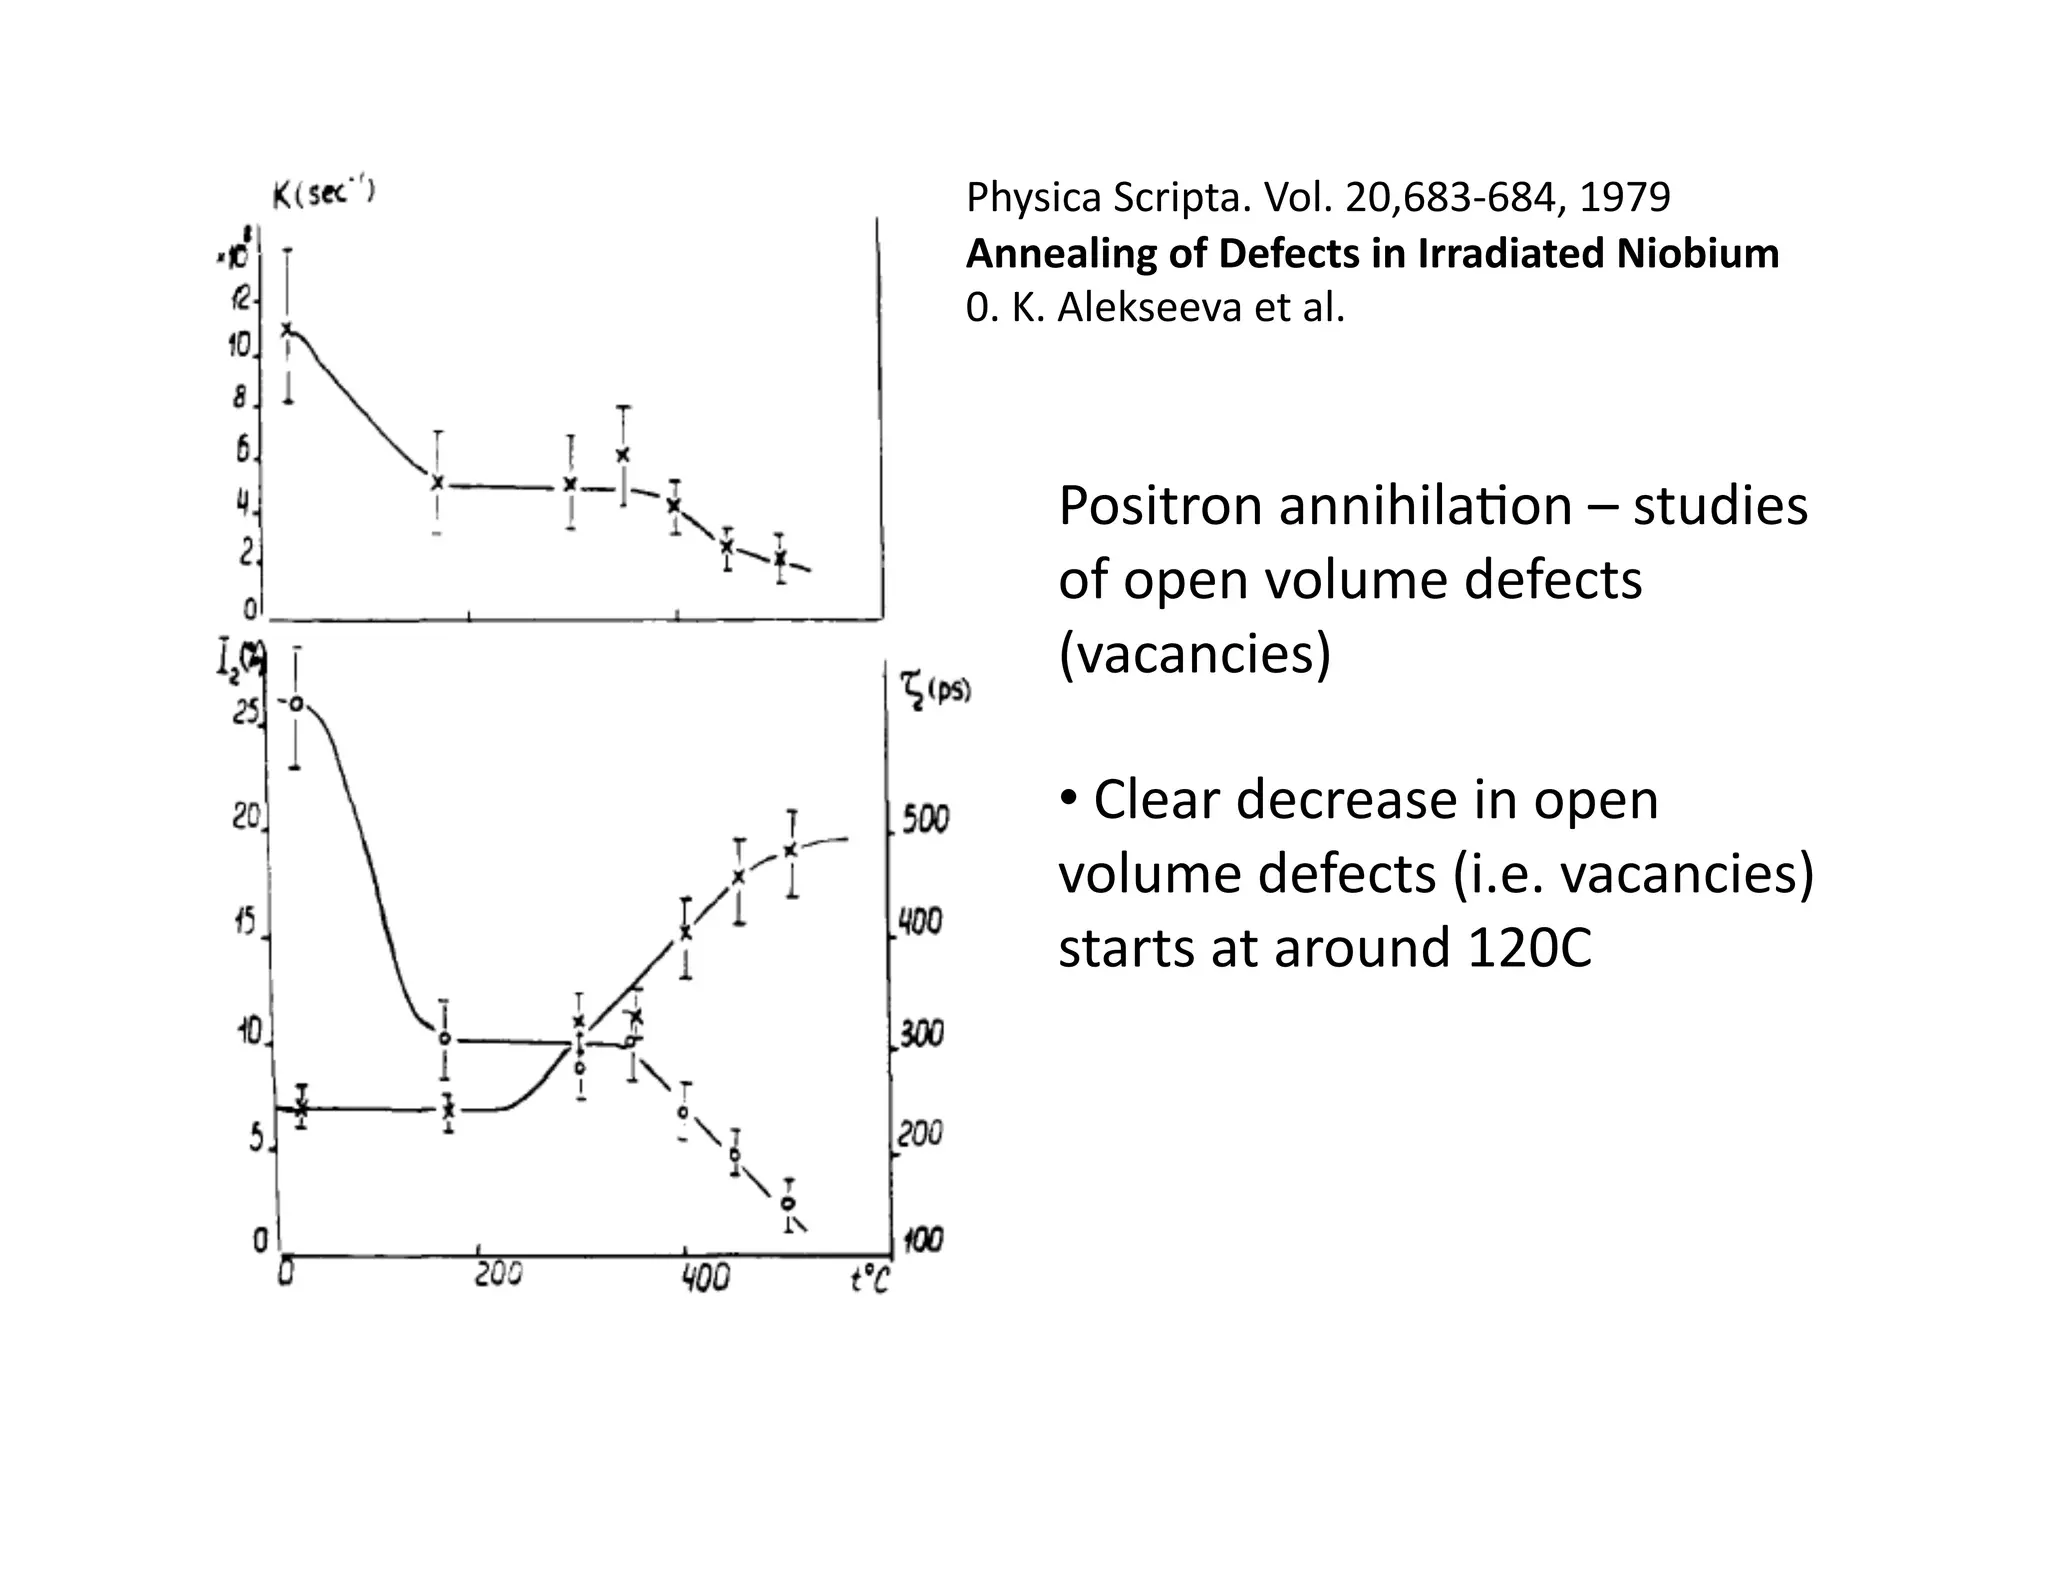
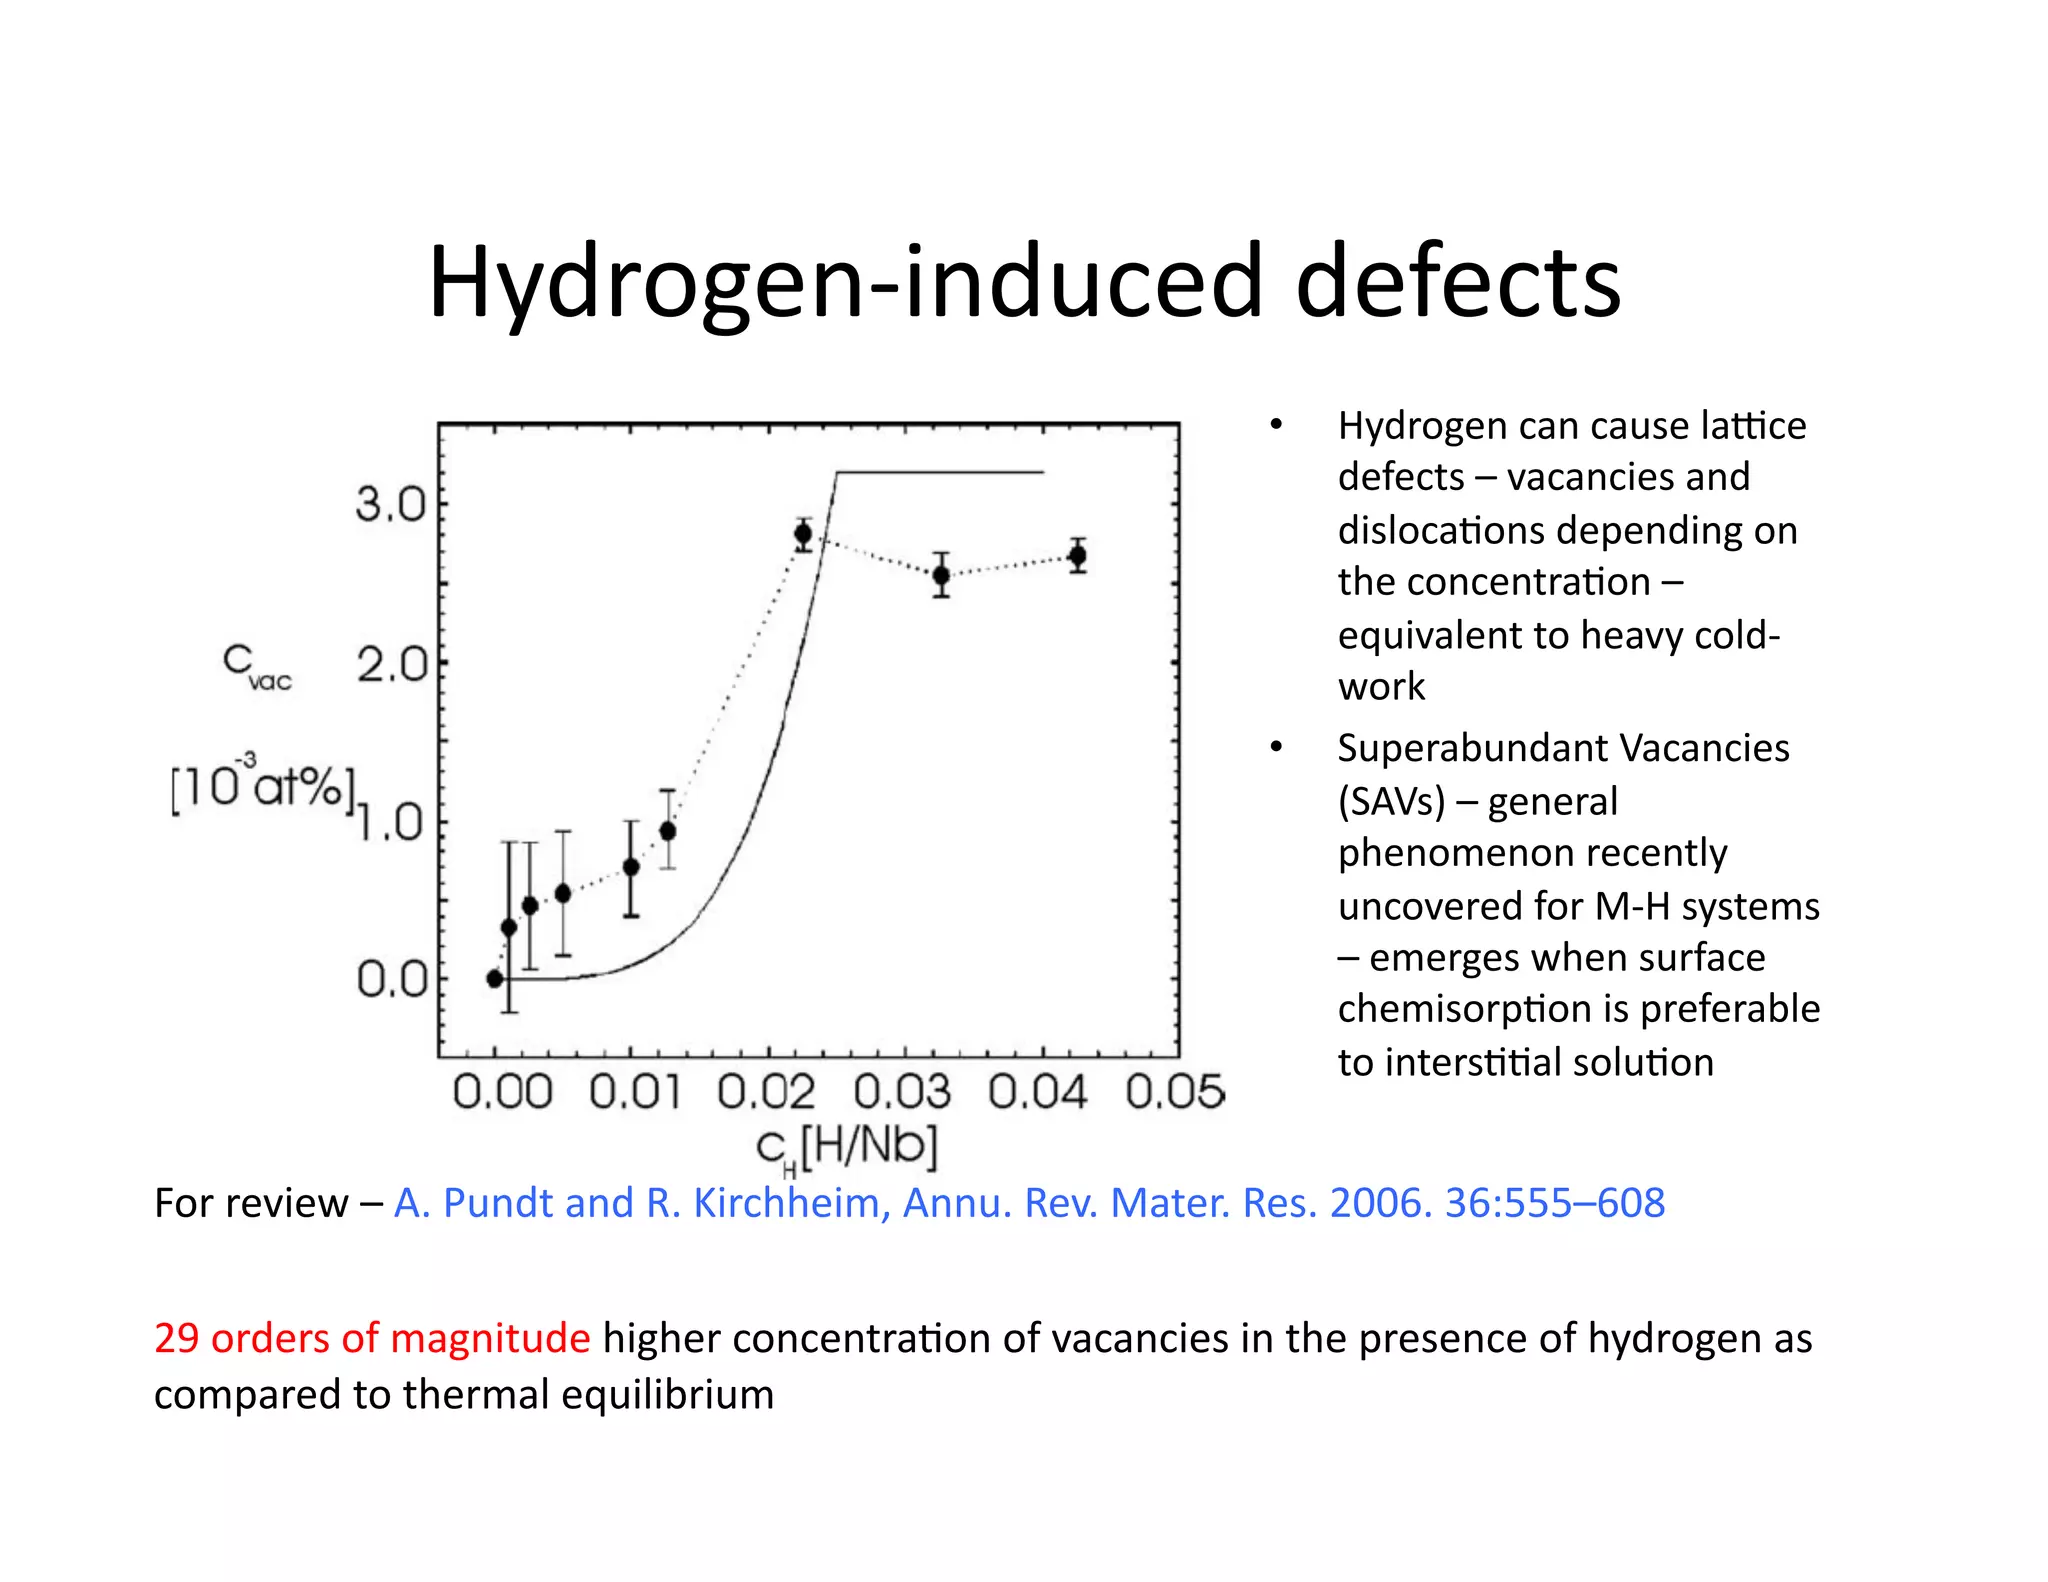
This document discusses the historical context of the "Stage III" phenomenon observed in metals like niobium and molybdenum, where resistivity suddenly decreases upon heating around 100-120°C. Previous studies using techniques like positron annihilation and elastic recoil detection showed this is due to the recovery of lattice defects like vacancies. More recent work suggests the presence of hydrogen plays a key role by binding to vacancies up to 100-120°C, above which the vacancies dissociate from hydrogen. The document then describes an elastic recoil detection study of the near-surface hydrogen concentration in niobium samples subjected to different baking treatments.


![Coded Agents – with UiPath SDK + LangGraph [Virtual Hands-on Workshop]](https://cdn.slidesharecdn.com/ss_thumbnails/codedagentsdeck-251215155422-5497c599-thumbnail.jpg?width=640&height=640&fit=bounds)


