Download to read offline
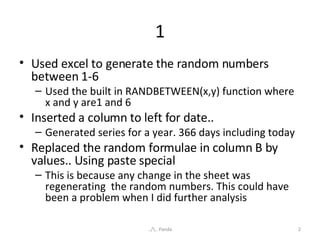
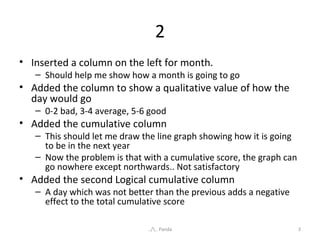
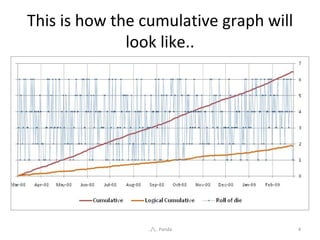
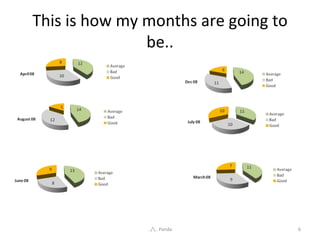
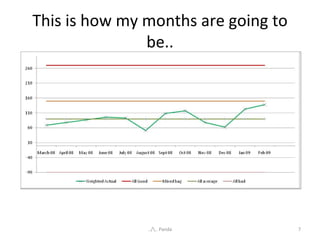

The document discusses an experiment using Excel to predict one's future based on randomly generated numbers from a dice roll simulation. It describes creating various columns to track daily outcomes, cumulative scores, and monthly trends through pivot tables and pie charts for visual representation. The author reflects on the limitations of predicting life outcomes using randomness, emphasizing the complexity of achieving meaningful predictions.