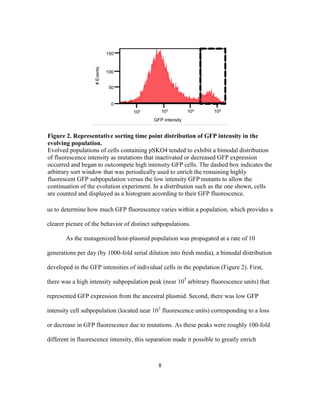
SlideShare a Scribd company logo
1 of 39
Download to read offline
Copyright
by
Álvaro Eugenio Rodríguez Mendoza
May 2014
The Thesis Committee for Álvaro Eugenio Rodríguez Mendoza
Certifies that this is the approved version of the following thesis:
Identifying mutations that enhance the evolutionary stability of
fluorescent protein expression from a plasmid in Escherichia coli
APPROVED BY
SUPERVISING COMMITTEE:
Jeffrey E. Barrick
Rasika Harshey
Supervisor:
Identifying mutations that enhance the evolutionary stability of
fluorescent protein expression from a plasmid in Escherichia coli
by
Álvaro Eugenio Rodríguez Mendoza, B.S.
Thesis
Presented to the Faculty of the Graduate School of
The University of Texas at Austin
in Partial Fulfillment
of the Requirements
for the Degree of
Master of Arts
The University of Texas at Austin
May 2014
Dedication
This thesis is dedicated to my family: My mom Isabel Mendoza and dad Álvaro
Rodríguez Brizuela, and both of my sisters, Margarita and Paola. Each has supported me
during times of happiness and times of hardship. Also special thanks to both my niece
Sofia and my nephew Emil for all their happiness that always makes me smile. Thanks
also to Micaela the cat, my pet companion. Finally thank you to all of you who were part
of my Texas A&M scientific family and who are part of my recently adopted family
scientific family at UT Austin.
v
Acknowledgements
I would like to thank my advisor Prof. Jeffrey E. Barrick and Dr. Daniel
Deatherage for their support and guidance throughout this scientific endeavor. I thank
the rest of the Barrick Lab for their support. Finally, I want to express my gratitude to
Prof. Rasika Harshey for her guidance during my career as a graduate student. This work
was supported by the U.S. National Institutes of Health (R00-GM087550), Barrick lab
startup funds from The University of Texas at Austin, and the Mexican Consejo Nacional
de Ciencia y Tecnología (CONACYT).
vi
Abstract
Identifying mutations that enhance the evolutionary stability of
fluorescent protein expression from a plasmid in Escherichia coli
Alvaro Eugenio Rodriguez Mendoza, M.A.
The University of Texas at Austin, 2014
Supervisor: Jeffrey E. Barrick
Synthetic biologists and metabolic engineers seek to design and create organisms
with novel functions. A major difficulty with many designed genetic devices is that they
lack evolutionary robustness. In this study, our aim was to identify mutations that could
enhance the evolutionary stability of green fluorescent protein (GFP) expression from a
plasmid in Escherichia coli. To achieve this goal, we created a mutagenized strain
library and performed an evolution experiment. To enrich potential mutants with
improved GFP stability, we periodically sorted for cells that remained highly fluorescent
as this population was propagated for several hundred generations and less-robust strains
accumulated inactivating mutations. Further testing of clones isolated from the final
evolved population showed that GFP expression was more stable in these strains and
suggested mutations in the chromosome were responsible. Re-sequencing the genomes of
four of these strains found that, among other genetic differences from the ancestor, all
had a mutation in either PolA or PolB. These two types of DNA polymerase mutations
may enhance GFP stability by causing a lower point mutation rate in the E. coli host.
vii
Table of Contents
List of Tables ...................................................................................................... viii
List of Figures....................................................................................................... ix
INTRODUCTION 1
RESULTS AND DISCUSSION 6
Selection for more evolutionarily stable GFP expression ..................................6
Determining if evolutionary stability has increased in evolved GFP+
cells....10
Isolation of genetic factors that contribute to the GFP stability increase ......13
Mutations present in evolved strains with greater GFP stability....................15
CONCLUSIONS 17
MATERIALS AND METHODS 21
Bacterial strains and plasmids............................................................................21
Generation of a UV mutagenized population....................................................21
Generating GFP decay curves ............................................................................23
Retransformation of evolved plasmids and strains...........................................24
Evolved clone genome sequencing and analysis................................................24
REFERENCES 27
viii
List of Tables
Table 1. Mutations identified by whole-genome sequencing
of four evolved strains..............................................................................15
Table 2. E. coli strains and plasmids used in this study.........................................26
ix
List of Figures
Figure 1. Plasmid used in this study that encodes a simple genetic circuit .............7
Figure 2. Representative sorting time point distribution of GFP intensity in the
evolving population.................................................................................8
Figure 3. Evolution experiment timeline .................................................................9
Figure 4. Flow cytometer measurements used to define GFP+
/GFP–
subpopulations
.................................................................................................................11
Figure 5. Flow cytometer GFP+
decay measurements...........................................12
Figure 6. Isolating the effects of evolved hosts versus evolved plasmids on stability
.................................................................................................................14
1
INTRODUCTION
Synthetic biology and metabolic engineering share the objective of designing and
manufacturing novel organisms. They also use a common set of genetic tools and share
aspects of their design processes. For example, it is common in both fields to use libraries
of standardized genetic parts, including promoters, ribosome binding sites, protein-coding
sequences, and transcriptional terminators. Another shared element of these two fields is
that a plasmid is often used to engineer a host organism, such as Escherichia coli, to
produce heterologous proteins that will give it novel capabilities. However, these fields
differ somewhat in their objectives. Synthetic biology has historically focused more on
designing and engineering genetic circuits to control cellular behaviors, while metabolic
engineering has concentrated on extending and optimizing complex metabolic pathways
to manufacture bioproducts (Endy, 2005; Stephanopoulos, 2012).
One example of the innovative outcomes that can be produced by these genetic
engineering fields is the creation of synthetic oscillatory networks, such as those formed
by taking a set of three repressor genes and arranging their respective promoters into a
negative feedback cycle (Elowitz and Leibler, 2000). A second example is described in a
study in which genes from three different organisms (E. coli, Staphylococcus aureus, and
Artemisia annua) were redesigned or refactored to construct a new metabolic pathway in
E. coli that is capable of producing an antimalarial drug precursor (Tsuruta et al., 2009).
2
A final example is a piece of work in which a gene network was engineered so that E.
coli could sense a low oxygen environment indicative of cancerous tissue and then
respond by invading and destroying nearby cells (Anderson et al., 2006).
In the examples of engineered genetic circuits or metabolic pathways above, a
plasmid or a combination of plasmids encoding foreign proteins were used. Such
heterologous biological constructs can be genetically unstable. The presence of a plasmid
typically incurs an energetic cost on a host cell known as a metabolic load. This burden
arises because the transformed plasmid will take away resources essential for cellular
replication (ATP, amino acids, ribosomes, etc.) and divert them towards maintaining the
plasmid DNA and producing its encoded proteins (Glick, 1995). Increased plasmid size,
higher plasmid copy number, and greater expression of plasmid-encoded proteins have
been shown to increase metabolic load (Birnbaum and Bailey, 1991; Friehs, 2004; Seo
and Bailey, 1985).
In evolutionary terms, the metabolic load imposed by a plasmid reduces the
growth rate of the host and therefore decreases its biological fitness. This fitness cost
generally means cells in a population that lose a plasmid, or that sustain mutations in a
plasmid which disrupt the costly expression of foreign proteins, are favored. In this way,
a majority of biological engineering efforts may be subjected to undesirable evolution
that reduces how long a desired cellular behavior is maintained after successive
3
generations of cellular replication. Many examples of plasmid/host systems having poor
evolutionary reliability have been reported (Hughes et al., 2012; Renda et al., 2014; Sabe
et al., 1984).
Researchers have developed various strategies for improving the evolutionary
lifespans of plasmid-encoded genes. These solutions include encoding a foreign protein
on the plasmid that provides the host with a novel alternative pathway to obtain energy
(Flores et al., 2004) or encoding a gene on the plasmid that complements a deletion of the
same essential gene from the host chromosome (e.g., infA which encodes translation
initiation factor 1) (Hägg et al., 2004). Yet, these methods only partially bypass the
problem of plasmid stability. Like the much more commonly used strategy of encoding
an antibiotic resistance gene on a plasmid to select for its maintenance, they primarily
address the segregational stability of the plasmid. That is, cells that do not inherit a
plasmid with a functional copy of these genes, whether due to mutations or random
partitioning of plasmid copies between daughter cells, are nonviable or less fit.
However, these solutions do not address the metabolic burden of producing other
foreign proteins whose functions are not linked to plasmid survival, so a plasmid may
also still have poor sequence stability over evolutionary time. That is, sequences
encoding costly but unselected functions on the plasmid can sustain inactivating
mutations that favor the replication of their hosts relative to those carrying the unmutated
4
plasmid. These disruptive mutations in plasmids can readily occur through several
mechanisms in bacteria like E. coli (e.g., point mutations or transposon insertions) and
rapidly become present in all copies of a plasmid in a descendant cell due to assortative
segregation (Bower and Prather, 2009). For our purposes, we will focus only on a
plasmid’s sequence stability when talking about evolutionary plasmid stability.
Recently, Sleight et al. performed a comprehensive study of the evolutionary
dynamics of plasmid stability for several engineered genetic circuits (Sleight et al., 2010).
Their study, aimed to systematically test a set of basic design principles for increasing the
sequence stability of engineered plasmids (e.g., avoid high copy plasmids and high
expression promoters, or use inducible promoters). Sleight measured the loss in function
over evolutionary time of several simple genetic circuits that were constructed from a set
of standardized genetic parts with specific biological functions (known as Biobricks). The
Biobrick registry notation for genetic parts is used throughout this text (e.g., R0010 is the
notation for a specific lac promoter sequence) (Endy, 2005).
Sleight et al. studied two initial circuits, T9002 and I7101, and versions of these
circuits with their sequences rationally altered to improve stability (Sleight et al., 2010).
When a significant decay in green fluorescent protein (GFP) signal (the output of a
functioning circuit) was observed in a cell population after propagation by serial transfer
for several days, plasmids and their genetic circuits were sequenced to find out what
5
mutations had occurred. After redesigning the sequences of these circuits to eliminate
certain mutational hotspots, Sleight et al. were able to improve their evolutionary half-
lives (time until population fluorescence decayed to one-half its initial value) by more
than two-fold. Interestingly, for one optimized construct they did not find any mutations
in their plasmid-encoded circuit after fluorescence output decayed, indicating that
chromosomal mutations might have caused the loss of GFP expression in this case.
In this study, our aim was to find variants of E. coli with mutations that improved
the evolutionary reliability of a GFP genetic circuit encoded on a plasmid. We started
with a UV-mutagenized host-plasmid library created from the most stable redesigned
circuit from the Sleight et al. study. This population was propagated for several hundred
generations of re-growth by serial transfer with periodic cell sorting for the subpopulation
of cells that maintained GFP expression in order to enrich for variants that potentially had
increased evolutionary stability. We found that isolates from the final evolved population
did exhibit improved stability of GFP expression compared to the ancestral host-plasmid
pair. We tested the effects of evolved plasmids and hosts separately on this improved
phenotype and found that mutations in the host chromosomes were involved in all cases.
Finally, we sequenced the genomes of a subset of the evolved E. coli and found genetic
changes that suggest they are antimutators with globally reduced rates of point mutations.
6
RESULTS AND DISCUSSION
Selection for more evolutionarily stable GFP expression
In a previous study, Sleight et al. redesigned the sequence of the I7101 genetic
circuit, which simply encodes GFP under control of an IPTG inducible promoter, for
greater evolutionary stability (Sleight et al., 2010). We began our study with their most
robust genetic circuit design (Figure 1). It consists of the promoter (R0010) driving
expression of GFP (E0240) followed by two transcriptional terminators (B0010 and
B0012). Our sample of their plasmid containing this genetic circuit in a pSB1A2
backbone was designated pSKO4. We transformed this construct into E. coli K12
BW25113 cells to create strain SKO16 to begin our study.
In order to test if plasmid or chromosomal mutations could increase the
evolutionary stability of this system, we performed a genetic selection for a decreased
rate of loss of GFP fluorescence. We started by UV mutagenizing the SKO16 strain. If it
was possible for a mutation to make the system more stable, we reasoned that this strain
library might contain mutant E. coli or mutant plasmids that had greater sequence
stability and would therefore be able to maintain a high GFP intensity in the face of
inactivating mutations over more generations of laboratory propagation. To isolate these
mutants, we needed to preferentially sort and enrich cells that remained highly
fluorescent from those that accumulated mutations that inactivated GFP expression.
One main difference between our study and earlier studies of the evolutionary
stability of plasmids is our use of fluorescent-activated cell sorting (FACS) and flow
7
cytometer instruments to understand evolutionary robustness (see further details in the
Methods section). In the Sleight et al. study a fluorometer was used to measure
evolutionary half-lives as the time elapsed at which half of the mean "bulk" fluorescence
signal was lost from a whole population of cells. In our case we opted to use a flow
cytometer or cell sorter, which records the distribution of fluorescence values for each
cell in a population and can allow us to isolate a specific subpopulation of cells on the
basis of their fluorescence properties. This measurement and sorting method also enabled
Figure 1. Plasmid used in this study that encodes a simple genetic circuit
The redesigned I7101 genetic circuit is shown with its constituent parts labeled. They
include an IPTG-inducible lac promoter (blue), a GFP coding sequence (green), and two
distinct termination sites (red). BioBrick accession numbers for the Registry of Standard
Biological Parts are given for each piece of the genetic circuit (e.g., R0010). The circuit
was cloned into the BioBrick pSB1A2 plasmid backbone, which contains a pBR322 origin
of replication (orange) and an ampicillin resistance marker gene (purple).
8
us to determine how much GFP fluorescence varies within a population, which provides a
clearer picture of the behavior of distinct subpopulations.
As the mutagenized host-plasmid population was propagated at a rate of 10
generations per day (by 1000-fold serial dilution into fresh media), a bimodal distribution
developed in the GFP intensities of individual cells in the population (Figure 2). First,
there was a high intensity subpopulation peak (near 105
arbitrary fluorescence units) that
represented GFP expression from the ancestral plasmid. Second, there was low GFP
intensity cell subpopulation (located near 103
fluorescence units) corresponding to a loss
or decrease in GFP fluorescence due to mutations. As these peaks were roughly 100-fold
different in fluorescence intensity, this separation made it possible to greatly enrich
Figure 2. Representative sorting time point distribution of GFP intensity in the
evolving population.
Evolved populations of cells containing pSKO4 tended to exhibit a bimodal distribution
of fluorescence intensity as mutations that inactivated or decreased GFP expression
occurred and began to outcompete high intensity GFP cells. The dashed box indicates the
arbitrary sort window that was periodically used to enrich the remaining highly
fluorescent GFP subpopulation versus the low intensity GFP mutants to allow the
continuation of the evolution experiment. In a distribution such as the one shown, cells
are counted and displayed as a histogram according to their GFP fluorescence.
9
individuals that remained highly GFP flourescent by sorting for cells with fluorescence
above a cutoff value (Figure 2).
This bimodal separation between the low GFP intensity cell subpopulation and
high GFP intensity subpopulation allowed us to periodically perform cell sorting steps to
prevent the loss of the high GFP intensity subpopulation as we propagated our SKO16
mutant strain library for 365 generations of regrowth (Figure 3). We sorted the population
whenever the abundance of the strongly intensity GFP cell subpopulation fell to less than
15% of the total population. When this happened, ~1.25x10⁵
GFP+
cells were sorted and
transferred to allow for the propagation to continue. As explained above, the high
intensity GFP cells and the low GFP intensity cells have 2-log separation, so we expected
a clean sort, but we always observed only a partial enrichment of the highly fluorescent
Figure 3. Evolution experiment timeline
Blue arrows indicate the sorting time points throughout the experiment. At every sorting
time point, only 15% or less of the population remained in the high GFP intensity range.
So, ~1.25×10⁵
high intensity GFP cells were sorted to enrich this subpopulation, which
possibly included variants with mutations that led to greater evolutionary stability of the
genetic circuit. The last sorts are further apart than the initial sorts (indicated by dashed
lines), indicating that it took fluorescence longer to decay later in the experiment, as would
be expected if robust variants were being enriched in the population. The last three arrows
represent a final set of sorting steps used to enrich the remaining high intensity GFP cells
as much as possible in the population before clones were isolated for further analysis.
10
GFP subpopulation. It is possible that this occurred due to the instrument failing to detect
some combinations of low intensity GFP cells and high intensity GFP cells as separate
events. In any case, as long as a significant number of high GFP intensity cells were
maintained after the decay in fluorescence that inevitably occurred after evolution, we did
not expect it to affect the outcome of this experiment.
As stated above, due to the proportion of high-GFP-intensity cells in the evolving
population decaying over time, we had to maintain and enrich this subpopulation by cell
sorting. One important observation seen throughout the evolution experiment was that
after the first few cell sorting events, the rate of decay of the high intensity GFP cells
decreased (Figure 3). This result suggested that the remaining high intensity GFP cells
exhibited more evolutionarily reliable expression of GFP, possibly due to the selection of
genetic variants with mutations either on the plasmid or the chromosome.
Determining if evolutionary stability has increased in evolved GFP+
cells
We wanted to determine the validity of the perceived increase in the evolutionary
stability of the GFP genetic circuit in the final high GFP intensity cell subpopulation. We
started by isolating six random clones from the SKO16 (initial non-UV mutagenized
ancestor) population and six strongly fluorescent clones from final mixed population
sample saved at the end of the evolution experiment (SKO117). We measured the decay
of GFP fluorescence for each of these six strains for 150 generations under the same
conditions as the evolution experiment. To comprehend this set of measurements, we
defined two ranges of fluorescence intensity values, a GFP+
range and a GFP−
range, on
11
the basis of examining all samples (Figure 4). In this manner, we could then distinguish
when a subpopulation of cells maintained at least some GFP fluorescence and when the
GFP fluorescence was sufficiently inactivated that there was no appreciable fluorescence.
This set of measurements is shown in Figure 5. First, we find that significant
variation between the samples of ancestral SKO16 clones exists during the initial
generations but that the decay of GFP+
cells occurs rapidly in all cases. By 70 generations
only a single clone has 20% GFP+
descendants (Figure 5A). In contrast, all but one of the
evolved SKO117 clones maintained a percentage of GFP+
cells above the 40% level past
100 generations. For this set, we excluded clone AER 10 as its initial fluorescence started
GFP intensity
#Events
GFP+GFP−
B#Events
GFP+GFP−
A
GFP intensity
Figure 4. Flow cytometer measurements used to define GFP+
/GFP–
subpopulations
For the follow-up evolution experiments, we defined global fluorescence intensity
windows to classify cells as GFP–
or GFP+
. The threshold values were determined after
examining all re-evolved populations and finding that GFP–
cells always eventually arose
in the lower window. In some cases we observed subpopulations with intermediate
fluorescence values arise, apparently due to mutations that reduced GFP expression. These
cells were classified as GFP+
by this scheme. Data is shown for two samples from the
follow-up evolution experiments: (A) An initial population before evolution that mostly
falls in the GFP+
category. (B) A population that has become largely GFP–
after evolution.
In both cases, the x-axis is labeled using a compressed log-scale between the GFP intensity
values of 10−4
and 104
. The y-axis shows the cell count or number of events.
12
at a low level, indicating that it was not a candidate for a more evolutionarily robust
mutant and therefore not interesting for further study (Figure 5B).
Figure 5. Flow cytometer GFP+
decay measurements
(A) Measurements for six SKO16 non-UV mutagenized clones. Here a fast decay of the
GFP+
cells occurs. In most replicates, only 20% of the population remains GFP+
after 70
generations. (B) Measurements obtained for the six SKO117 evolved clones. Here a
slower decay of the GFP+
cells per generation occurs, as many cells remain GFP+
past 130
generations, excluding the AER 10 clone that has a low initial GFP intensity.
13
Isolation of genetic factors that contribute to the GFP stability increase
To further test our initial hypothesis, we proceeded to examine what roles the
plasmid and the chromosome had in extending the evolutionary robustness of GFP+
cell
fluorescence in the SKO117 evolved clones. We tested this distinction by isolating each
component in the E. coli expression system (E. coli K-12 BW25113 and pSKO4
plasmid). As explained in more detail in the Methods section, we cured each E. coli strain
of its evolved plasmid and re-transformed it with the ancestral plasmid, and we also
transformed the plasmid isolated from each evolved strain into the ancestral E. coli strain.
Our results suggest that evolved E. coli with mutations in their chromosomes are
able to reproduce the stability phenotype with ancestral plasmids in most cases (Figure
6). Three clear examples of this behavior are seen in Figure 6B, 6C, and 6E. We could
not cure one of the evolved clones of its plasmid (Figure 6A). In this case, we depended
only on the data obtained from the evolved plasmid construct to draw a conclusion.
Based on the behavior of this combination, it is likely that the evolved chromosome also
increases stability here. Finally, in Figure 6D the GFP decay behavior displayed by both
the isolated evolved host and the isolated evolved plasmid strain resembles an
intermediate phenotype between the ancestral strain and the evolved clone (Figure 5B).
This result could indicate a case where both plasmid and chromosome carry mutations
that improve GFP stability. It is even possible that the evolved plasmid and chromosome
are required together for maximal robustness because their mutations interact. We opted
to exclude this potentially more complicated case from further experiments.
14
Figure 6. Isolating the effects of evolved hosts versus evolved plasmids on stability
In these cases, we separately compared the effects of evolved plasmids or evolved host
chromosomes on GFP decay. (A) AER7 evolved host/plasmid. Due to problems
constructing the “isolated evolved chromosome”, only the measurements for the “isolated
evolved plasmid” strain (AER20) were obtained. Here the AER20 strain decays in a
manner similar to that of an SKO16 ancestral clone (Fig. 5A). (B) AER8 evolved
host/plasmid. We observed differences in the behavior of the evolved strain transformed
with the ancestral plasmid (AER15) and the ancestral strain transformed with the cognate
evolved pAER8 plasmid (AER21). This difference in the measured decay shows that the
mutation conferring improved stability appears to reside on the E. coli chromosome and not
the plasmid (compare to the decay curve for evolved host with evolved plasmid in Fig. 5B).
(C) AER9 evolved host/plasmid. AER16 “isolated chromosome strain” also appeared to
have a chromosomal mutation causing the increased evolutionary stability of GFP
expression. (D) AER11 evolved host/plasmid. This result is inconclusive as both evolved
plasmid (AER24) and evolved chromosome (AER18) display an intermediate phenotype
between the GFP decay of the ancestor (SKO16) and the evolved population (SKO117). (E)
AER12 evolved host/plasmid. This set behaves in a way comparable to the AER16 and
AER19 strains “isolated evolved chromosome” strains, which also leads us to conclude that
mutations in the chromosome resulted in the gain in GFP evolutionary stability.
15
Mutations present in evolved strains with greater GFP stability
On the basis of our stability measurements, we selected four evolved clones for
whole-genome re-sequencing (AER 7, AER 8, AER9, and AER12). The purpose of
obtaining the sequencing data was to compare the differences at the chromosomal level in
comparison to the SKO16 ancestor and that of the SKO117 evolved clones. By further
comparing mutations in different mutagenized and evolved strains, we hoped to identify
mutations that could play a role in their increased evolutionary robustness. By using the
breseq pipeline to analyze our sequencing data, we were able to characterize the
mutations present in the SKO117 evolved clones. We identified thirteen distinct
Table 1. Mutations identified by whole-genome sequencing of four evolved strains
Thirteen mutations identified by analyzing Illumina genome re-sequencing data for four
clonal samples isolated from the SKO117 evolved population with the breseq
computational pipeline (Barrick et al., 2009). On the basis of the genetic differences
identified, we determined that clones AER7, AER8, and AER9 likely belong to a single
subpopulation that was derived from the same mutagenized ancestor cell and that AER12
belongs to a distinct subpopulation derived from a different mutagenized ancestor.
16
mutations across the four selected evolved strains (Table 1). Interestingly, we could
separate the analyzed clones AER7, AER8, and AER9 as originating from one
subpopulation and AER12 as originating from a second subpopulation, each with its own
set of many shared mutations that likely arose due to the UV mutagenesis step.
17
CONCLUSIONS
Now that a set of candidate mutations able to increase the evolutionary reliability
of GFP expression from a plasmid is available, further testing is required to determine the
specific mutations that are responsible. We propose three experiments that would help in
characterizing our evolved strains in future work. First, we could test relevant mutants
from the Keio collection of single-gene knockouts (Baba et al., 2006). This experiment
would allow us to determine whether a loss-of-function mutation in a gene is responsible
for the gain in evolutionary robustness. Alternatively, we could use the ASKA plasmid
library to explore if a gain-of-function mutation – functionally equivalent to gene
overexpression – has occurred and contributes to this phenotype (Kitagawa et al., 2005).
Second, to further understand the observed results, we could engineer the specific point
mutations we observed in each gene of interest individually into the ancestral E. coli
genome, then compare the maintenance of GFP expression in these "reconstructed"
strains to the ancestor. Third, we could characterize the mutations present in evolved or
reconstructed strains by performing a competition assays to determine how they affect the
fitness cost of plasmid maintenance (i.e., the metabolic load) (De Gelder et al., 2007).
We expected GFP expression from our synthetic plasmid to be disrupted by new
spontaneous mutations that occurred during growth of the bacterial cultures. Therefore,
we examined the scientific literature related to the genes hit by mutations in the re-
sequenced chromosomes (Table 1) to see whether any had previously been shown to
reduce E. coli mutation rates. Examples of known ways to genetically engineer reduced
18
mutation rates in E. coli include strains in which all insertion sequence (IS) elements
have been removed (Pósfai et al., 2006). These mobile elements can insert into plasmids
and can cause disruptions/deletions (e.g., IS1 elements present in several E. coli strains)
(Prather et al., 2006). Another example of engineering a lower mutation rate is deleting
specific genes that allow for recombination in an E. coli strain, such as recA, to reduce
recombination between homologous sequences present in a plasmid (Phue et al., 2008).
Another important mechanism that has been described for reducing mutation rates
in E. coli is the use of certain DNA polymerase variants. Reducing the rate of DNA
replication seems to be correlated with enhanced fidelity in these "antimutator" mutants
(Kingsbury and Helinski, 1970). The molecular mechanism of this antimutator effect may
be increased proofreading efficiency or improved selectivity in nucleotide incorporation.
A compilation of DNA polymerases with known antimutator variants exists in the
literature (Herr et al., 2011). One of our candidate mutations is in E. coli PolA (PolI), one
of the polymerases in this compendium with known antimutator variants.
PolA is an essential bacterial polymerase with both a 5′ to 3′ exonuclease activity
and 3′ to 5′ proofreading activity. Its main role is removing the RNA primers used in
lagging strand synthesis and filling in the resulting gaps during chromosomal replication
(Fukushima et al., 2007). Although the mutation found in our evolved strain does not
exactly match any of the known antimutator variants of PolA, it does occur in the finger
domain specifically in a region where most antimutator variants have mutations.
Therefore, we propose that our PolA mutation also has an antimutator effect.
19
More specifically, we predict that the H734Y amino acid substitution causes a
conformational change in the finger domain of PolI from examining its structural context
using PyMol (v.1.3) and a crystal structure of Taq Polymerase (3KTQ) domain (DeLano,
2002; Li et al., 1998). This finger domain has a dual role in PolI, controlling nucleotide
selectivity and modulating the difference in extension rate between mispaired and
properly paired primer termini. Thus, altering the efficiency of one of these functions
could create a PolI variant that had higher DNA replication fidelity. This change would
be expected to reduce the overall point mutation rate in these cells, which would make
mutations in a plasmid accumulate more slowly. Thus, this PolA mutation offers a
possible explanation of how the evolutionary stability of GFP expression from the
plasmid improved in the AER7 isolate from the final evolved population.
In the second sequenced subpopulation, two PolB (PolII) mutations were found.
In E. coli, PolB is regulated by the SOS response, specifically by the LexA repressor, and
it is therefore mainly expressed under stress conditions (Iwasaki et al., 1990). PolB is
important for repairing certain types of DNA damage, as it is capable of bypassing any
replication barriers related to this damage. However, PolB lacks proofreading activity.
Thus, it is error-prone and has been implicated in stress-induced mutagenesis (Napolitano
et al., 2000; Wagner et al., 2002).
Deletion of PolB and two other error-prone polymerases from the E. coli
chromosome has been shown to improve the evolutionary stability of a genetic circuit in
an engineered E. coli host (Csörgo et al., 2012). This improvement apparently occurs
20
because error-prone polymerases are active to some extent even under normal growth
conditions and cause some spontaneous mutations. Therefore, we suggest that the loss-of-
function (nonsense) mutation we identified in PolB in evolved clones AER7, AER8, and
AER9 functionally knocks out its activity and also – like the PolA mutation – reduces the
overall point mutation rate in these E. coli hosts.
In summary, we identified chromosomal mutations in the evolved clones that
were present in the SKO117 final evolved mixed population. Out of this set, we identified
mutations of interest for future study in two DNA polymerases (PolA and PolB). It is
likely that each polymerase mutation reduces the rate of mutations in the host cell
"chassis" to improve the evolutionary stability of GFP expression from a plasmid. The
PolA mutation, present in one subpopulation, may cause a conformational change in a
replicative polymerase that increases its fidelity. The PolB mutation seems to knock out
an error-prone repair polymerase that appears to elevate the mutation rate under normal
growth conditions. Future work is needed to confirm that these mutations are responsible
for the increased evolutionary robustness in our evolved strains. It will also be interesting
to see if E. coli hosts for synthetic biology with even lower mutation rates can be created
by combining these mutations in a single strain or by repeating our selection for
improved evolutionary stability on strains that already have these mutations.
21
MATERIALS AND METHODS
Bacterial strains and plasmids
We transformed the progenitor strain of the Keio collection, Escherichia coli K-
12 BW25113 (Baba et al., 2006), with the plasmid pSKO4 to create SKO16, the starting
strain for our study. The high copy number pSKO4 plasmid (pBR322 origin) encodes an
ampicillin resistance marker gene and contains a GFPmut3 reporter under control of an
inducible Lac promoter (Cormack et al., 1996; Sleight et al., 2010). This plasmid was
obtained from the Sauro Lab (University of Washington). For a comprehensive list of all
strains and plasmids used in this study see Table 2.
We used electrocompetent cells and electroporation for all transformations.
Throughout, LB liquid media and LB agar were supplemented with carbenicillin (CRB),
if required, to a final concentration of 100 mg/µl. When required, IPTG was also added to
a final concentration of 1 mM when supplementing LB liquid media and 10 µl of 100
mM IPTG was spread on top of LB agar plates.
Generation of a UV mutagenized population
Strain SKO16, was revived from a freezer stock in LB + CRB at 37°C. After
overnight growth, 1 ml of culture was pelleted by centrifugation at 3,000 RCF for 5 min.
The supernatant was discarded and the pellet was resuspended in 1 ml of sterile saline
solution (145 mM NaCl). Six or more droplets of 120 μl of the suspension were
transferred to the surface of an empty plastic petri dish. Two different petri dishes were
exposed to 27,000 μJ/cm2 (mutagenized) or 0 μJ/cm2 (control) doses of irradiation in a
22
UV crosslinker CL-1000 (UVP Cat. # 95-0174-01). Up to 100 μl from each droplet on a
petri dish was pooled by transferring to a 1.7 ml Eppendorf tube. Plating the mutagenized
and control samples for viable cell counts was used to judge the extent of mutagenesis,
with this dose giving a 95-99% death rate. The mutagenized culture was pelleted again at
3,000 RCF for 5 min. After discarding the supernatant, the pellet was resuspended in 1
mL LB + CRB and allowed to grow overnight. The entire culture was then frozen down
for use in downstream applications at a later time.
Selective evolution experiment by sorting for GFP+
subpopulations
To obtain an evolved mixed population, the ancestral mixed population was
serially propagated using a daily 1:1000 dilution to obtain about 10 generations of
regrowth per day, except on sorting days were only ~1.25x10⁵
cells were transferred, thus
increasing the dilution and the number of generations per day to ~17.3, and resulting in
an estimated 365 generations of growth for the entire experiment. The transfer cultures
were grown in 10 ml of LB + CRB + IPTG for 24 hours at 37°C and shaking at 120 RPM
for 365 generations. To allow further downstream analysis of the cultures and have a fail-
safe in the case of contamination, freezer stocks were stored every 10 generations
throughout this study in 16.7 % DMSO at −80°C.
A FACS Aria IIu (BD Biosciences (Cat. # 643179) flow cytometer/cell-sorter and
the FACS Diva software (v. 6.1.3) were used to measure the GFP signal decay and sort
cells throughout the experiment. The wavelengths used for GFP excitation and Syto17
excitation are 488nm and 688nm respectively. The received emission GFP/Syto17
23
wavelengths were filtered by their respective bandpass filters (GFP-540 nm filter and
Syto-660/20 nm filter) After the subpopulation of GFP fluorescent cells had dropped to
less than 15% of the total population, approximately 1.25x10⁵
GFP+
cells were sorted and
used to continue the passages.
Generating GFP decay curves
To generate GFP decay curves, strains were cultured under the same conditions as
the evolution experiment. A GFP fluorescence measurement time point was taken every
10 generations. To generate the GFP decay curves the initial time point’s total percentage
GFP+
cells in a population was compared to the remaining percentage at later times. At
each time point 20 μl of each transfer of tested cultures was diluted in a microplate well
with 0.3 μl of Syto17 red fluorescent nucleic acid stain (Life Technologies Cat. # S7579)
and 380 ml of ddH2O. The wavelengths used for GFP excitation and Syto17 excitation
are 488nm and 688nm, respectively. The emission wavelengths for GFP/Syto17 were
filtered by their respective bandpass filters (GFP-540 nm filter and Syto-660/20 nm
filter). All measurements were taken using a FACS LSR Fortessa flow cytometer (BD
Biosciences Cat. # 647465) and the FACSDiva software (BD Biosciences v. 6.1.3) at the
ICMB Microscopy Core Facility (University of Texas at Austin).
Analyzing whether GFP plasmid robustness increased after evolution
To determine if an observable difference in GFP plasmid stability existed between
the initial ancestor population (SKO16) and the final evolved mixed population, we
picked six clones the SKO16 ancestor clonal population and the SKO117 evolved mixed
24
population and passaged them for 150 generations using the same conditions as the ones
described for the selective evolution experiment. The GFP decay curves were constructed
as explained above in the GFP decay curves section.
Retransformation of evolved plasmids and strains
To eliminate the original genetic circuit to isolate only the chromosome, we cured
evolved clones and ancestor clones of their plasmids by passaging them for around 50
generations in 10 ml LB + IPTG. We then plated daily after each passage on LB + IPTG
(spreaded) plates until non-fluorescent colonies were identified. We proceeded to patch
them on LB + CRB plates to test for CRB-sensitive colonies. Sensitive colonies we
identified for each of the ancestor clones and evolved clones were then streaked for single
colonies and re-transformed with each of the 365-generation evolved plasmids or the
ancestral plasmid. The plasmids were isolated using the PureLink Quick Plasmid
Miniprep kit (Life Technologies Cat. # K2100-10).
Evolved clone genome sequencing and analysis
E. coli genomic DNA was isolated from each of the six evolved clones using the
PureLink Genomic DNA Mini Kit (Life Technologies Cat. # K1820-00). This DNA was
fragmented using a Covaris S220 sonicator to an average size of 600 bp and library
preparation was performed using the NEBNext DNA Library Prep Reagent Set for
Illumina (New England Biolabs Cat. # 6000E). We used Magnetic Ampure XP Beads
(Beckman Coulter Cat. #A63880) for the required clean up steps and during the final size
selection. In both cases the standard protocol provided was followed.
25
The SKO117 evolved clone genomic DNA libraries were sequenced on an
Illumina HiSeq 2500 instrument at the Genome Sequencing and Analysis Facility
(University of Texas at Austin). Mutations were predicted by the breseq analysis pipeline
(Deatherage and Barrick, 2014) using the E. coli K 12 W3110 (GenBank NC_007779.1)
genome as a reference sequence. The mutations identified are shown in Table 1.
26
Table 2. E.coli strains and plasmids used in this study
Strain Description Source
BW25113 Keio collection progenitor strain
(Datsenko and
Wanner, 2000)
SKO16
BW25113 transformed with plasmid pSKO4 (pSB1A2
containing BioBricks R0010 + E0240)
(Sleight et al.,
2010)
SKO117
SKO16-derived population that was UV mutagenized
and propagated for 365 generations with sorting for
high GFP intensity
This work
AER7 Clone 1 isolated from SKO117 with plasmid pAER7 This work
AER8 Clone 2 isolated from SKO117 with plasmid pAER8 This work
AER9 Clone 3 isolated from SKO117 with plasmid pAER9 This work
AER10 Clone 4 isolated from SKO117 with plasmid pAER10 This work
AER11 Clone 5 isolated from SKO117 with plasmid pAER11 This work
AER12 Clone 6 isolated from SKO117 with plasmid pAER12 This work
AER14 AER7 cured of evolved plasmid pAER7 This work
AER15 AER8 cured of evolved plasmid pAER8 This work
AER16 AER9 cured of evolved plasmid pAER9 This work
AER17 AER10 cured of evolved plasmid pAER10 This work
AER18 AER11 cured of evolved plasmid pAER11 This work
AER19 AER12 cured of evolved plasmid pAER12 This work
AER20 BW25113 transformed with pAER7 This work
AER21 BW25113 transformed with pAER8 This work
AER22 BW25113 transformed with pAER9 This work
AER23 BW25113 transformed with pAER10 This work
AER24 BW25113 transformed with pAER11 This work
AER25 BW25113 transformed with pAER12 This work
AER26 AER14 transformed with pSKO4 This work
AER27 AER15 transformed with pSKO4 This work
AER28 AER16 transformed with pSKO4 This work
AER29 AER17 transformed with pSKO4 This work
AER30 AER18 transformed with pSKO4 This work
27
REFERENCES
Anderson, J.C., Clarke, E.J., Arkin, A.P., Voigt, C.A., 2006. Environmentally controlled
invasion of cancer cells by engineered bacteria. J. Mol. Biol. 355, 619–627.
Baba, T., Ara, T., Hasegawa, M., Takai, Y., Okumura, Y., Baba, M., Datsenko, K.A.,
Tomita, M., Wanner, B.L., Mori, H., 2006. Construction of Escherichia coli K-12
in-frame, single-gene knockout mutants: the Keio collection. Mol. Syst. Biol. 2,
2006.0008.
Barrick, J.E., Yu, D.S., Yoon, S.H., Jeong, H., Oh, T.K., Schneider, D., Lenski, R.E.,
Kim, J.F., 2009. Genome evolution and adaptation in a long-term experiment with
Escherichia coli. Nature 461, 1243–1247.
Birnbaum, S., Bailey, J.E., 1991. Plasmid presence changes the relative levels of many
host cell proteins and ribosome components in recombinant Escherichia coli.
Biotechnol. Bioeng. 37, 736–745.
Bower, D.M., Prather, K.L.J., 2009. Engineering of bacterial strains and vectors for the
production of plasmid DNA. Appl. Microbiol. Biotechnol. 82, 805–813.
Cormack, B.P., Valdivia, R.H., Falkow, S., 1996. FACS-optimized mutants of the green
fluorescent protein (GFP), in: Gene. pp. 33–38.
Csörgo, B., Fehér, T., Tímár, E., Blattner, F.R., Pósfai, G., 2012. Low-mutation-rate,
reduced-genome Escherichia coli: an improved host for faithful maintenance of
engineered genetic constructs. Microb. Cell Fact. 11, 11.
Datsenko, K. a, Wanner, B.L., 2000. One-step inactivation of chromosomal genes in
Escherichia coli K-12 using PCR products. Proc. Natl. Acad. Sci. U. S. A. 97, 6640–
5.
De Gelder, L., Ponciano, J.M., Joyce, P., Top, E.M., 2007. Stability of a promiscuous
plasmid in different hosts: no guarantee for a long-term relationship. Microbiology
153, 452–463.
Deatherage, D.E., Barrick, J.E., 2014. Identification of Mutations in Laboratory Evolved
Microbes from Next-generation Sequencing data using breseq, in: Sun, L., Shou, W.
(Eds.), Engineering Multicellular Systems: Methods and Protocols. Humana Press.
DeLano, W.L., 2002. The PyMOL Molecular Graphics System. Schrödinger LLC
wwwpymolorg Version 1., http://www.pymol.org.
28
Elowitz, M.B., Leibler, S., 2000. A synthetic oscillatory network of transcriptional
regulators. Nature 403, 335–338.
Endy, D., 2005. Foundations for engineering biology. Nature 438, 449–453.
Flores, S., de Anda-Herrera, R., Gosset, G., Bolívar, F.G., 2004. Growth-rate recovery of
Escherichia coli cultures carrying a multicopy plasmid, by engineering of the
pentose-phosphate pathway. Biotechnol. Bioeng. 87, 485–494.
Friehs, K., 2004. Plasmid copy number and plasmid stability. Adv. Biochem. Eng.
Biotechnol. 86, 47–82.
Fukushima, S., Itaya, M., Kato, H., Ogasawara, N., Yoshikawa, H., 2007. Reassessment
of the in vivo functions of DNA polymerase I and RNase H in bacterial cell growth.
J. Bacteriol. 189, 8575–8583.
Glick, B.R., 1995. Metabolic load and heterologous gene expression. Biotechnol. Adv.
Hägg, P., De Pohl, J.W., Abdulkarim, F., Isaksson, L.A., 2004. A host/plasmid system
that is not dependent on antibiotics and antibiotic resistance genes for stable plasmid
maintenance in Escherichia coli. J. Biotechnol. 111, 17–30.
Herr, A.J., Williams, L.N., Preston, B.D., 2011. Antimutator variants of DNA
polymerases. Crit. Rev. Biochem. Mol. Biol.
Hughes, J.M., Lohman, B.K., Deckert, G.E., Nichols, E.P., Settles, M., Abdo, Z., Top,
E.M., 2012. The Role of Clonal Interference in the Evolutionary Dynamics of
Plasmid-Host Adaptation. MBio.
Iwasaki, H., Nakata, A., Walker, G.C., Shinagawa, H., 1990. The Escherichia coli polB
gene, which encodes DNA polymerase II, is regulated by the SOS system. J.
Bacteriol. 172 , 6268–6273.
Kingsbury, D.T., Helinski, D.R., 1970. DNA polymerase as a requirement for the
maintenance of the bacterial plasmid colicinogenic factor E1. Biochem. Biophys.
Res. Commun. 41, 1538–1544.
Kitagawa, M., Ara, T., Arifuzzaman, M., Ioka-Nakamichi, T., Inamoto, E., Toyonaga, H.,
Mori, H., 2005. Complete set of ORF clones of Escherichia coli ASKA library (a
complete set of E. coli K-12 ORF archive): unique resources for biological research.
DNA Res. 12, 291–299.
29
Li, Y., Korolev, S., Waksman, G., 1998. Crystal structures of open and closed forms of
binary and ternary complexes of the large fragment of Thermus aquaticus DNA
polymerase I: structural basis for nucleotide incorporation. EMBO J. 17, 7514–7525.
Napolitano, R., Janel-Bintz, R., Wagner, J., Fuchs, R.P., 2000. All three SOS-inducible
DNA polymerases (Pol II, Pol IV and Pol V) are involved in induced mutagenesis.
EMBO J. 19, 6259–6265.
Phue, J.-N., Lee, S.J., Trinh, L., Shiloach, J., 2008. Modified Escherichia coli B (BL21), a
superior producer of plasmid DNA compared with Escherichia coli K (DH5α).
Biotechnol. Bioeng. 101, 831–836.
Pósfai, G., Plunkett, G., Fehér, T., Frisch, D., Keil, G.M., Umenhoffer, K.,
Kolisnychenko, V., Stahl, B., Sharma, S.S., de Arruda, M., Burland, V., Harcum,
S.W., Blattner, F.R., 2006. Emergent properties of reduced-genome Escherichia
coli. Science (80-. ). 312, 1044–1046.
Prather, K.L.J., Edmonds, M.C., Herod, J.W., 2006. Identification and characterization of
IS1 transposition in plasmid amplification mutants of E. coli clones producing DNA
vaccines. Appl. Microbiol. Biotechnol. 73, 815–826.
Renda, B. a, Hammerling, M.J., Barrick, J.E., 2014. Engineering reduced evolutionary
potential for synthetic biology. Mol. Biosyst.
Sabe, H., Miwa, T., Kodaki, T., Izui, K., Hiraga, S., Katsuki, H., 1984. Molecular cloning
of the phosphoenolpyruvate carboxylase gene, ppc, of Escherichia coli. Gene 31,
279–283.
Seo, J.H., Bailey, J.E., 1985. Effects of recombinant plasmid content on growth
properties and cloned gene product formation in Escherichia coli. Biotechnol.
Bioeng. 27, 1668–1674.
Sleight, S.C., Bartley, B.A., Lieviant, J.A., Sauro, H.M., 2010. Designing and
engineering evolutionary robust genetic circuits. J. Biol. Eng. 4, 12.
Stephanopoulos, G., 2012. Synthetic Biology and Metabolic Engineering. ACS Synth.
Biol. 1, 514–525.
Tsuruta, H., Paddon, C.J., Eng, D., Lenihan, J.R., Horning, T., Anthony, L.C., Regentin,
R., Keasling, J.D., Renninger, N.S., Newman, J.D., 2009. High-level production of
amorpha-4, 11-diene, a precursor of the antimalarial agent artemisinin, in
Escherichia coli. PLoS One 4.
30
Wagner, J., Etienne, H., Janel-Bintz, R., Fuchs, R.P.P., 2002. Genetics of mutagenesis in
E.coli: Various combinations of translesion polymerases (Pol II, IV and V) deal with
lesion/sequence context diversity. DNA Repair (Amst). 1, 159–167.

More Related Content

What's hot

Genetic markers in characterization2
Genetic markers in characterization2Genetic markers in characterization2
Genetic markers in characterization2Bruno Mmassy
 
Genetic Analysis and Mapping in Bacteria and Bacteriophages
Genetic Analysis and Mapping in Bacteria and Bacteriophages Genetic Analysis and Mapping in Bacteria and Bacteriophages
Genetic Analysis and Mapping in Bacteria and Bacteriophages mpattani
 
Bacterial recombination and mapping in e.coli
Bacterial recombination and mapping in e.coliBacterial recombination and mapping in e.coli
Bacterial recombination and mapping in e.coliauringzaba
 
Comparative Genomics and Visualisation - Part 2
Comparative Genomics and Visualisation - Part 2Comparative Genomics and Visualisation - Part 2
Comparative Genomics and Visualisation - Part 2Leighton Pritchard
 
Describe - Gene Transfer
Describe - Gene TransferDescribe - Gene Transfer
Describe - Gene Transferb.stev
 
"Phylogeny-Driven Approaches to Genomics and Metagenomics" talk by Jonathan E...
"Phylogeny-Driven Approaches to Genomics and Metagenomics" talk by Jonathan E..."Phylogeny-Driven Approaches to Genomics and Metagenomics" talk by Jonathan E...
"Phylogeny-Driven Approaches to Genomics and Metagenomics" talk by Jonathan E...Jonathan Eisen
 
Stem Cells: Minireview Presentation
Stem Cells: Minireview PresentationStem Cells: Minireview Presentation
Stem Cells: Minireview PresentationJoshua Mendoza-Elias
 
Potentals of human amniotic fluid stem cells
Potentals of human amniotic fluid stem cellsPotentals of human amniotic fluid stem cells
Potentals of human amniotic fluid stem cellsPeyman Ghoraishizadeh
 

What's hot (20)

Bliss
BlissBliss
Bliss
 
Genetic markers in characterization2
Genetic markers in characterization2Genetic markers in characterization2
Genetic markers in characterization2
 
Transgenenics animals
Transgenenics animalsTransgenenics animals
Transgenenics animals
 
Genetic Analysis and Mapping in Bacteria and Bacteriophages
Genetic Analysis and Mapping in Bacteria and Bacteriophages Genetic Analysis and Mapping in Bacteria and Bacteriophages
Genetic Analysis and Mapping in Bacteria and Bacteriophages
 
Winnetal
WinnetalWinnetal
Winnetal
 
Bacterial recombination and mapping in e.coli
Bacterial recombination and mapping in e.coliBacterial recombination and mapping in e.coli
Bacterial recombination and mapping in e.coli
 
Comparative Genomics and Visualisation - Part 2
Comparative Genomics and Visualisation - Part 2Comparative Genomics and Visualisation - Part 2
Comparative Genomics and Visualisation - Part 2
 
Describe - Gene Transfer
Describe - Gene TransferDescribe - Gene Transfer
Describe - Gene Transfer
 
Genetic variation
Genetic variationGenetic variation
Genetic variation
 
Gene Clo Ning
Gene Clo NingGene Clo Ning
Gene Clo Ning
 
Ambe 101 @ lec 7,8
Ambe 101 @ lec 7,8Ambe 101 @ lec 7,8
Ambe 101 @ lec 7,8
 
"Phylogeny-Driven Approaches to Genomics and Metagenomics" talk by Jonathan E...
"Phylogeny-Driven Approaches to Genomics and Metagenomics" talk by Jonathan E..."Phylogeny-Driven Approaches to Genomics and Metagenomics" talk by Jonathan E...
"Phylogeny-Driven Approaches to Genomics and Metagenomics" talk by Jonathan E...
 
Molecular evolution
Molecular evolutionMolecular evolution
Molecular evolution
 
Cloning
CloningCloning
Cloning
 
Stem Cells: Minireview Presentation
Stem Cells: Minireview PresentationStem Cells: Minireview Presentation
Stem Cells: Minireview Presentation
 
Potentals of human amniotic fluid stem cells
Potentals of human amniotic fluid stem cellsPotentals of human amniotic fluid stem cells
Potentals of human amniotic fluid stem cells
 
Genetic presentation
Genetic presentationGenetic presentation
Genetic presentation
 
Genetic engineering
Genetic engineeringGenetic engineering
Genetic engineering
 
Gene order
Gene orderGene order
Gene order
 
Blood Mag Article
Blood Mag ArticleBlood Mag Article
Blood Mag Article
 

Similar to RODRIGUEZMENDOZ-THESIS-2014

Expression systems
Expression systemsExpression systems
Expression systemsAmjad Afridi
 
An Understanding Of Bacterial Transformation By Plasmid Dna
An Understanding Of Bacterial Transformation By Plasmid DnaAn Understanding Of Bacterial Transformation By Plasmid Dna
An Understanding Of Bacterial Transformation By Plasmid DnaGina Buck
 
4.4 genetic engineering & biotechnology
4.4 genetic engineering & biotechnology4.4 genetic engineering & biotechnology
4.4 genetic engineering & biotechnologycartlidge
 
Sleight and lenski_pbz_2007
Sleight and lenski_pbz_2007Sleight and lenski_pbz_2007
Sleight and lenski_pbz_2007danteess
 
Sleight and lenski
Sleight and lenskiSleight and lenski
Sleight and lenskidanteess
 
Evolution of Pathogens
Evolution of PathogensEvolution of Pathogens
Evolution of PathogensSumeena Karki
 
Biological Transformation Of Bacteria And Pglo Plasmid Dna
Biological Transformation Of Bacteria And Pglo Plasmid DnaBiological Transformation Of Bacteria And Pglo Plasmid Dna
Biological Transformation Of Bacteria And Pglo Plasmid DnaTracy Berry
 
4.6 Biotechnology And Genetic Engineering
4.6 Biotechnology And Genetic Engineering4.6 Biotechnology And Genetic Engineering
4.6 Biotechnology And Genetic EngineeringPatricia Lopez
 
4.4 Biotechnology And Genetic Engineering
4.4 Biotechnology And Genetic Engineering4.4 Biotechnology And Genetic Engineering
4.4 Biotechnology And Genetic EngineeringPatricia Lopez
 
Plang functional genome
Plang functional genomePlang functional genome
Plang functional genometcha163
 
Marine Host-Microbiome Interactions: Challenges and Opportunities
Marine Host-Microbiome Interactions: Challenges and OpportunitiesMarine Host-Microbiome Interactions: Challenges and Opportunities
Marine Host-Microbiome Interactions: Challenges and OpportunitiesJonathan Eisen
 
Deriving Mesenchymal Stem Cells from Human Amniotic Fluid – Potential for an ...
Deriving Mesenchymal Stem Cells from Human Amniotic Fluid – Potential for an ...Deriving Mesenchymal Stem Cells from Human Amniotic Fluid – Potential for an ...
Deriving Mesenchymal Stem Cells from Human Amniotic Fluid – Potential for an ...cordbloodsymposium
 
KnockOut mouse technology By Bikash karki
KnockOut mouse technology By Bikash karkiKnockOut mouse technology By Bikash karki
KnockOut mouse technology By Bikash karkiBikash Karki
 
The purpose of this lab exercise is to review terminology co.pdf
The purpose of this lab exercise is to review terminology co.pdfThe purpose of this lab exercise is to review terminology co.pdf
The purpose of this lab exercise is to review terminology co.pdfsales79
 

Similar to RODRIGUEZMENDOZ-THESIS-2014 (20)

Expression systems
Expression systemsExpression systems
Expression systems
 
An Understanding Of Bacterial Transformation By Plasmid Dna
An Understanding Of Bacterial Transformation By Plasmid DnaAn Understanding Of Bacterial Transformation By Plasmid Dna
An Understanding Of Bacterial Transformation By Plasmid Dna
 
Biology Literature Review Example
Biology Literature Review ExampleBiology Literature Review Example
Biology Literature Review Example
 
Biology Literature Review Example
Biology Literature Review ExampleBiology Literature Review Example
Biology Literature Review Example
 
4.4 genetic engineering & biotechnology
4.4 genetic engineering & biotechnology4.4 genetic engineering & biotechnology
4.4 genetic engineering & biotechnology
 
ResearchreportSTS
ResearchreportSTSResearchreportSTS
ResearchreportSTS
 
Sleight and lenski_pbz_2007
Sleight and lenski_pbz_2007Sleight and lenski_pbz_2007
Sleight and lenski_pbz_2007
 
Sleight and lenski
Sleight and lenskiSleight and lenski
Sleight and lenski
 
Evolution of Pathogens
Evolution of PathogensEvolution of Pathogens
Evolution of Pathogens
 
Biological Transformation Of Bacteria And Pglo Plasmid Dna
Biological Transformation Of Bacteria And Pglo Plasmid DnaBiological Transformation Of Bacteria And Pglo Plasmid Dna
Biological Transformation Of Bacteria And Pglo Plasmid Dna
 
Gene therapy
Gene therapyGene therapy
Gene therapy
 
4.6 Biotechnology And Genetic Engineering
4.6 Biotechnology And Genetic Engineering4.6 Biotechnology And Genetic Engineering
4.6 Biotechnology And Genetic Engineering
 
4.4 Biotechnology And Genetic Engineering
4.4 Biotechnology And Genetic Engineering4.4 Biotechnology And Genetic Engineering
4.4 Biotechnology And Genetic Engineering
 
Plang functional genome
Plang functional genomePlang functional genome
Plang functional genome
 
Marine Host-Microbiome Interactions: Challenges and Opportunities
Marine Host-Microbiome Interactions: Challenges and OpportunitiesMarine Host-Microbiome Interactions: Challenges and Opportunities
Marine Host-Microbiome Interactions: Challenges and Opportunities
 
Deriving Mesenchymal Stem Cells from Human Amniotic Fluid – Potential for an ...
Deriving Mesenchymal Stem Cells from Human Amniotic Fluid – Potential for an ...Deriving Mesenchymal Stem Cells from Human Amniotic Fluid – Potential for an ...
Deriving Mesenchymal Stem Cells from Human Amniotic Fluid – Potential for an ...
 
KnockOut mouse technology By Bikash karki
KnockOut mouse technology By Bikash karkiKnockOut mouse technology By Bikash karki
KnockOut mouse technology By Bikash karki
 
Cell review
Cell  reviewCell  review
Cell review
 
The purpose of this lab exercise is to review terminology co.pdf
The purpose of this lab exercise is to review terminology co.pdfThe purpose of this lab exercise is to review terminology co.pdf
The purpose of this lab exercise is to review terminology co.pdf
 
Editing genome
Editing genomeEditing genome
Editing genome
 

RODRIGUEZMENDOZ-THESIS-2014

  • 2. The Thesis Committee for Álvaro Eugenio Rodríguez Mendoza Certifies that this is the approved version of the following thesis: Identifying mutations that enhance the evolutionary stability of fluorescent protein expression from a plasmid in Escherichia coli APPROVED BY SUPERVISING COMMITTEE: Jeffrey E. Barrick Rasika Harshey Supervisor:
  • 3. Identifying mutations that enhance the evolutionary stability of fluorescent protein expression from a plasmid in Escherichia coli by Álvaro Eugenio Rodríguez Mendoza, B.S. Thesis Presented to the Faculty of the Graduate School of The University of Texas at Austin in Partial Fulfillment of the Requirements for the Degree of Master of Arts The University of Texas at Austin May 2014
  • 4. Dedication This thesis is dedicated to my family: My mom Isabel Mendoza and dad Álvaro Rodríguez Brizuela, and both of my sisters, Margarita and Paola. Each has supported me during times of happiness and times of hardship. Also special thanks to both my niece Sofia and my nephew Emil for all their happiness that always makes me smile. Thanks also to Micaela the cat, my pet companion. Finally thank you to all of you who were part of my Texas A&M scientific family and who are part of my recently adopted family scientific family at UT Austin.
  • 5. v Acknowledgements I would like to thank my advisor Prof. Jeffrey E. Barrick and Dr. Daniel Deatherage for their support and guidance throughout this scientific endeavor. I thank the rest of the Barrick Lab for their support. Finally, I want to express my gratitude to Prof. Rasika Harshey for her guidance during my career as a graduate student. This work was supported by the U.S. National Institutes of Health (R00-GM087550), Barrick lab startup funds from The University of Texas at Austin, and the Mexican Consejo Nacional de Ciencia y Tecnología (CONACYT).
  • 6. vi Abstract Identifying mutations that enhance the evolutionary stability of fluorescent protein expression from a plasmid in Escherichia coli Alvaro Eugenio Rodriguez Mendoza, M.A. The University of Texas at Austin, 2014 Supervisor: Jeffrey E. Barrick Synthetic biologists and metabolic engineers seek to design and create organisms with novel functions. A major difficulty with many designed genetic devices is that they lack evolutionary robustness. In this study, our aim was to identify mutations that could enhance the evolutionary stability of green fluorescent protein (GFP) expression from a plasmid in Escherichia coli. To achieve this goal, we created a mutagenized strain library and performed an evolution experiment. To enrich potential mutants with improved GFP stability, we periodically sorted for cells that remained highly fluorescent as this population was propagated for several hundred generations and less-robust strains accumulated inactivating mutations. Further testing of clones isolated from the final evolved population showed that GFP expression was more stable in these strains and suggested mutations in the chromosome were responsible. Re-sequencing the genomes of four of these strains found that, among other genetic differences from the ancestor, all had a mutation in either PolA or PolB. These two types of DNA polymerase mutations may enhance GFP stability by causing a lower point mutation rate in the E. coli host.
  • 7. vii Table of Contents List of Tables ...................................................................................................... viii List of Figures....................................................................................................... ix INTRODUCTION 1 RESULTS AND DISCUSSION 6 Selection for more evolutionarily stable GFP expression ..................................6 Determining if evolutionary stability has increased in evolved GFP+ cells....10 Isolation of genetic factors that contribute to the GFP stability increase ......13 Mutations present in evolved strains with greater GFP stability....................15 CONCLUSIONS 17 MATERIALS AND METHODS 21 Bacterial strains and plasmids............................................................................21 Generation of a UV mutagenized population....................................................21 Generating GFP decay curves ............................................................................23 Retransformation of evolved plasmids and strains...........................................24 Evolved clone genome sequencing and analysis................................................24 REFERENCES 27
  • 8. viii List of Tables Table 1. Mutations identified by whole-genome sequencing of four evolved strains..............................................................................15 Table 2. E. coli strains and plasmids used in this study.........................................26
  • 9. ix List of Figures Figure 1. Plasmid used in this study that encodes a simple genetic circuit .............7 Figure 2. Representative sorting time point distribution of GFP intensity in the evolving population.................................................................................8 Figure 3. Evolution experiment timeline .................................................................9 Figure 4. Flow cytometer measurements used to define GFP+ /GFP– subpopulations .................................................................................................................11 Figure 5. Flow cytometer GFP+ decay measurements...........................................12 Figure 6. Isolating the effects of evolved hosts versus evolved plasmids on stability .................................................................................................................14
  • 10. 1 INTRODUCTION Synthetic biology and metabolic engineering share the objective of designing and manufacturing novel organisms. They also use a common set of genetic tools and share aspects of their design processes. For example, it is common in both fields to use libraries of standardized genetic parts, including promoters, ribosome binding sites, protein-coding sequences, and transcriptional terminators. Another shared element of these two fields is that a plasmid is often used to engineer a host organism, such as Escherichia coli, to produce heterologous proteins that will give it novel capabilities. However, these fields differ somewhat in their objectives. Synthetic biology has historically focused more on designing and engineering genetic circuits to control cellular behaviors, while metabolic engineering has concentrated on extending and optimizing complex metabolic pathways to manufacture bioproducts (Endy, 2005; Stephanopoulos, 2012). One example of the innovative outcomes that can be produced by these genetic engineering fields is the creation of synthetic oscillatory networks, such as those formed by taking a set of three repressor genes and arranging their respective promoters into a negative feedback cycle (Elowitz and Leibler, 2000). A second example is described in a study in which genes from three different organisms (E. coli, Staphylococcus aureus, and Artemisia annua) were redesigned or refactored to construct a new metabolic pathway in E. coli that is capable of producing an antimalarial drug precursor (Tsuruta et al., 2009).
  • 11. 2 A final example is a piece of work in which a gene network was engineered so that E. coli could sense a low oxygen environment indicative of cancerous tissue and then respond by invading and destroying nearby cells (Anderson et al., 2006). In the examples of engineered genetic circuits or metabolic pathways above, a plasmid or a combination of plasmids encoding foreign proteins were used. Such heterologous biological constructs can be genetically unstable. The presence of a plasmid typically incurs an energetic cost on a host cell known as a metabolic load. This burden arises because the transformed plasmid will take away resources essential for cellular replication (ATP, amino acids, ribosomes, etc.) and divert them towards maintaining the plasmid DNA and producing its encoded proteins (Glick, 1995). Increased plasmid size, higher plasmid copy number, and greater expression of plasmid-encoded proteins have been shown to increase metabolic load (Birnbaum and Bailey, 1991; Friehs, 2004; Seo and Bailey, 1985). In evolutionary terms, the metabolic load imposed by a plasmid reduces the growth rate of the host and therefore decreases its biological fitness. This fitness cost generally means cells in a population that lose a plasmid, or that sustain mutations in a plasmid which disrupt the costly expression of foreign proteins, are favored. In this way, a majority of biological engineering efforts may be subjected to undesirable evolution that reduces how long a desired cellular behavior is maintained after successive
  • 12. 3 generations of cellular replication. Many examples of plasmid/host systems having poor evolutionary reliability have been reported (Hughes et al., 2012; Renda et al., 2014; Sabe et al., 1984). Researchers have developed various strategies for improving the evolutionary lifespans of plasmid-encoded genes. These solutions include encoding a foreign protein on the plasmid that provides the host with a novel alternative pathway to obtain energy (Flores et al., 2004) or encoding a gene on the plasmid that complements a deletion of the same essential gene from the host chromosome (e.g., infA which encodes translation initiation factor 1) (Hägg et al., 2004). Yet, these methods only partially bypass the problem of plasmid stability. Like the much more commonly used strategy of encoding an antibiotic resistance gene on a plasmid to select for its maintenance, they primarily address the segregational stability of the plasmid. That is, cells that do not inherit a plasmid with a functional copy of these genes, whether due to mutations or random partitioning of plasmid copies between daughter cells, are nonviable or less fit. However, these solutions do not address the metabolic burden of producing other foreign proteins whose functions are not linked to plasmid survival, so a plasmid may also still have poor sequence stability over evolutionary time. That is, sequences encoding costly but unselected functions on the plasmid can sustain inactivating mutations that favor the replication of their hosts relative to those carrying the unmutated
  • 13. 4 plasmid. These disruptive mutations in plasmids can readily occur through several mechanisms in bacteria like E. coli (e.g., point mutations or transposon insertions) and rapidly become present in all copies of a plasmid in a descendant cell due to assortative segregation (Bower and Prather, 2009). For our purposes, we will focus only on a plasmid’s sequence stability when talking about evolutionary plasmid stability. Recently, Sleight et al. performed a comprehensive study of the evolutionary dynamics of plasmid stability for several engineered genetic circuits (Sleight et al., 2010). Their study, aimed to systematically test a set of basic design principles for increasing the sequence stability of engineered plasmids (e.g., avoid high copy plasmids and high expression promoters, or use inducible promoters). Sleight measured the loss in function over evolutionary time of several simple genetic circuits that were constructed from a set of standardized genetic parts with specific biological functions (known as Biobricks). The Biobrick registry notation for genetic parts is used throughout this text (e.g., R0010 is the notation for a specific lac promoter sequence) (Endy, 2005). Sleight et al. studied two initial circuits, T9002 and I7101, and versions of these circuits with their sequences rationally altered to improve stability (Sleight et al., 2010). When a significant decay in green fluorescent protein (GFP) signal (the output of a functioning circuit) was observed in a cell population after propagation by serial transfer for several days, plasmids and their genetic circuits were sequenced to find out what
  • 14. 5 mutations had occurred. After redesigning the sequences of these circuits to eliminate certain mutational hotspots, Sleight et al. were able to improve their evolutionary half- lives (time until population fluorescence decayed to one-half its initial value) by more than two-fold. Interestingly, for one optimized construct they did not find any mutations in their plasmid-encoded circuit after fluorescence output decayed, indicating that chromosomal mutations might have caused the loss of GFP expression in this case. In this study, our aim was to find variants of E. coli with mutations that improved the evolutionary reliability of a GFP genetic circuit encoded on a plasmid. We started with a UV-mutagenized host-plasmid library created from the most stable redesigned circuit from the Sleight et al. study. This population was propagated for several hundred generations of re-growth by serial transfer with periodic cell sorting for the subpopulation of cells that maintained GFP expression in order to enrich for variants that potentially had increased evolutionary stability. We found that isolates from the final evolved population did exhibit improved stability of GFP expression compared to the ancestral host-plasmid pair. We tested the effects of evolved plasmids and hosts separately on this improved phenotype and found that mutations in the host chromosomes were involved in all cases. Finally, we sequenced the genomes of a subset of the evolved E. coli and found genetic changes that suggest they are antimutators with globally reduced rates of point mutations.
  • 15. 6 RESULTS AND DISCUSSION Selection for more evolutionarily stable GFP expression In a previous study, Sleight et al. redesigned the sequence of the I7101 genetic circuit, which simply encodes GFP under control of an IPTG inducible promoter, for greater evolutionary stability (Sleight et al., 2010). We began our study with their most robust genetic circuit design (Figure 1). It consists of the promoter (R0010) driving expression of GFP (E0240) followed by two transcriptional terminators (B0010 and B0012). Our sample of their plasmid containing this genetic circuit in a pSB1A2 backbone was designated pSKO4. We transformed this construct into E. coli K12 BW25113 cells to create strain SKO16 to begin our study. In order to test if plasmid or chromosomal mutations could increase the evolutionary stability of this system, we performed a genetic selection for a decreased rate of loss of GFP fluorescence. We started by UV mutagenizing the SKO16 strain. If it was possible for a mutation to make the system more stable, we reasoned that this strain library might contain mutant E. coli or mutant plasmids that had greater sequence stability and would therefore be able to maintain a high GFP intensity in the face of inactivating mutations over more generations of laboratory propagation. To isolate these mutants, we needed to preferentially sort and enrich cells that remained highly fluorescent from those that accumulated mutations that inactivated GFP expression. One main difference between our study and earlier studies of the evolutionary stability of plasmids is our use of fluorescent-activated cell sorting (FACS) and flow
  • 16. 7 cytometer instruments to understand evolutionary robustness (see further details in the Methods section). In the Sleight et al. study a fluorometer was used to measure evolutionary half-lives as the time elapsed at which half of the mean "bulk" fluorescence signal was lost from a whole population of cells. In our case we opted to use a flow cytometer or cell sorter, which records the distribution of fluorescence values for each cell in a population and can allow us to isolate a specific subpopulation of cells on the basis of their fluorescence properties. This measurement and sorting method also enabled Figure 1. Plasmid used in this study that encodes a simple genetic circuit The redesigned I7101 genetic circuit is shown with its constituent parts labeled. They include an IPTG-inducible lac promoter (blue), a GFP coding sequence (green), and two distinct termination sites (red). BioBrick accession numbers for the Registry of Standard Biological Parts are given for each piece of the genetic circuit (e.g., R0010). The circuit was cloned into the BioBrick pSB1A2 plasmid backbone, which contains a pBR322 origin of replication (orange) and an ampicillin resistance marker gene (purple).
  • 17. 8 us to determine how much GFP fluorescence varies within a population, which provides a clearer picture of the behavior of distinct subpopulations. As the mutagenized host-plasmid population was propagated at a rate of 10 generations per day (by 1000-fold serial dilution into fresh media), a bimodal distribution developed in the GFP intensities of individual cells in the population (Figure 2). First, there was a high intensity subpopulation peak (near 105 arbitrary fluorescence units) that represented GFP expression from the ancestral plasmid. Second, there was low GFP intensity cell subpopulation (located near 103 fluorescence units) corresponding to a loss or decrease in GFP fluorescence due to mutations. As these peaks were roughly 100-fold different in fluorescence intensity, this separation made it possible to greatly enrich Figure 2. Representative sorting time point distribution of GFP intensity in the evolving population. Evolved populations of cells containing pSKO4 tended to exhibit a bimodal distribution of fluorescence intensity as mutations that inactivated or decreased GFP expression occurred and began to outcompete high intensity GFP cells. The dashed box indicates the arbitrary sort window that was periodically used to enrich the remaining highly fluorescent GFP subpopulation versus the low intensity GFP mutants to allow the continuation of the evolution experiment. In a distribution such as the one shown, cells are counted and displayed as a histogram according to their GFP fluorescence.
  • 18. 9 individuals that remained highly GFP flourescent by sorting for cells with fluorescence above a cutoff value (Figure 2). This bimodal separation between the low GFP intensity cell subpopulation and high GFP intensity subpopulation allowed us to periodically perform cell sorting steps to prevent the loss of the high GFP intensity subpopulation as we propagated our SKO16 mutant strain library for 365 generations of regrowth (Figure 3). We sorted the population whenever the abundance of the strongly intensity GFP cell subpopulation fell to less than 15% of the total population. When this happened, ~1.25x10⁵ GFP+ cells were sorted and transferred to allow for the propagation to continue. As explained above, the high intensity GFP cells and the low GFP intensity cells have 2-log separation, so we expected a clean sort, but we always observed only a partial enrichment of the highly fluorescent Figure 3. Evolution experiment timeline Blue arrows indicate the sorting time points throughout the experiment. At every sorting time point, only 15% or less of the population remained in the high GFP intensity range. So, ~1.25×10⁵ high intensity GFP cells were sorted to enrich this subpopulation, which possibly included variants with mutations that led to greater evolutionary stability of the genetic circuit. The last sorts are further apart than the initial sorts (indicated by dashed lines), indicating that it took fluorescence longer to decay later in the experiment, as would be expected if robust variants were being enriched in the population. The last three arrows represent a final set of sorting steps used to enrich the remaining high intensity GFP cells as much as possible in the population before clones were isolated for further analysis.
  • 19. 10 GFP subpopulation. It is possible that this occurred due to the instrument failing to detect some combinations of low intensity GFP cells and high intensity GFP cells as separate events. In any case, as long as a significant number of high GFP intensity cells were maintained after the decay in fluorescence that inevitably occurred after evolution, we did not expect it to affect the outcome of this experiment. As stated above, due to the proportion of high-GFP-intensity cells in the evolving population decaying over time, we had to maintain and enrich this subpopulation by cell sorting. One important observation seen throughout the evolution experiment was that after the first few cell sorting events, the rate of decay of the high intensity GFP cells decreased (Figure 3). This result suggested that the remaining high intensity GFP cells exhibited more evolutionarily reliable expression of GFP, possibly due to the selection of genetic variants with mutations either on the plasmid or the chromosome. Determining if evolutionary stability has increased in evolved GFP+ cells We wanted to determine the validity of the perceived increase in the evolutionary stability of the GFP genetic circuit in the final high GFP intensity cell subpopulation. We started by isolating six random clones from the SKO16 (initial non-UV mutagenized ancestor) population and six strongly fluorescent clones from final mixed population sample saved at the end of the evolution experiment (SKO117). We measured the decay of GFP fluorescence for each of these six strains for 150 generations under the same conditions as the evolution experiment. To comprehend this set of measurements, we defined two ranges of fluorescence intensity values, a GFP+ range and a GFP− range, on
  • 20. 11 the basis of examining all samples (Figure 4). In this manner, we could then distinguish when a subpopulation of cells maintained at least some GFP fluorescence and when the GFP fluorescence was sufficiently inactivated that there was no appreciable fluorescence. This set of measurements is shown in Figure 5. First, we find that significant variation between the samples of ancestral SKO16 clones exists during the initial generations but that the decay of GFP+ cells occurs rapidly in all cases. By 70 generations only a single clone has 20% GFP+ descendants (Figure 5A). In contrast, all but one of the evolved SKO117 clones maintained a percentage of GFP+ cells above the 40% level past 100 generations. For this set, we excluded clone AER 10 as its initial fluorescence started GFP intensity #Events GFP+GFP− B#Events GFP+GFP− A GFP intensity Figure 4. Flow cytometer measurements used to define GFP+ /GFP– subpopulations For the follow-up evolution experiments, we defined global fluorescence intensity windows to classify cells as GFP– or GFP+ . The threshold values were determined after examining all re-evolved populations and finding that GFP– cells always eventually arose in the lower window. In some cases we observed subpopulations with intermediate fluorescence values arise, apparently due to mutations that reduced GFP expression. These cells were classified as GFP+ by this scheme. Data is shown for two samples from the follow-up evolution experiments: (A) An initial population before evolution that mostly falls in the GFP+ category. (B) A population that has become largely GFP– after evolution. In both cases, the x-axis is labeled using a compressed log-scale between the GFP intensity values of 10−4 and 104 . The y-axis shows the cell count or number of events.
  • 21. 12 at a low level, indicating that it was not a candidate for a more evolutionarily robust mutant and therefore not interesting for further study (Figure 5B). Figure 5. Flow cytometer GFP+ decay measurements (A) Measurements for six SKO16 non-UV mutagenized clones. Here a fast decay of the GFP+ cells occurs. In most replicates, only 20% of the population remains GFP+ after 70 generations. (B) Measurements obtained for the six SKO117 evolved clones. Here a slower decay of the GFP+ cells per generation occurs, as many cells remain GFP+ past 130 generations, excluding the AER 10 clone that has a low initial GFP intensity.
  • 22. 13 Isolation of genetic factors that contribute to the GFP stability increase To further test our initial hypothesis, we proceeded to examine what roles the plasmid and the chromosome had in extending the evolutionary robustness of GFP+ cell fluorescence in the SKO117 evolved clones. We tested this distinction by isolating each component in the E. coli expression system (E. coli K-12 BW25113 and pSKO4 plasmid). As explained in more detail in the Methods section, we cured each E. coli strain of its evolved plasmid and re-transformed it with the ancestral plasmid, and we also transformed the plasmid isolated from each evolved strain into the ancestral E. coli strain. Our results suggest that evolved E. coli with mutations in their chromosomes are able to reproduce the stability phenotype with ancestral plasmids in most cases (Figure 6). Three clear examples of this behavior are seen in Figure 6B, 6C, and 6E. We could not cure one of the evolved clones of its plasmid (Figure 6A). In this case, we depended only on the data obtained from the evolved plasmid construct to draw a conclusion. Based on the behavior of this combination, it is likely that the evolved chromosome also increases stability here. Finally, in Figure 6D the GFP decay behavior displayed by both the isolated evolved host and the isolated evolved plasmid strain resembles an intermediate phenotype between the ancestral strain and the evolved clone (Figure 5B). This result could indicate a case where both plasmid and chromosome carry mutations that improve GFP stability. It is even possible that the evolved plasmid and chromosome are required together for maximal robustness because their mutations interact. We opted to exclude this potentially more complicated case from further experiments.
  • 23. 14 Figure 6. Isolating the effects of evolved hosts versus evolved plasmids on stability In these cases, we separately compared the effects of evolved plasmids or evolved host chromosomes on GFP decay. (A) AER7 evolved host/plasmid. Due to problems constructing the “isolated evolved chromosome”, only the measurements for the “isolated evolved plasmid” strain (AER20) were obtained. Here the AER20 strain decays in a manner similar to that of an SKO16 ancestral clone (Fig. 5A). (B) AER8 evolved host/plasmid. We observed differences in the behavior of the evolved strain transformed with the ancestral plasmid (AER15) and the ancestral strain transformed with the cognate evolved pAER8 plasmid (AER21). This difference in the measured decay shows that the mutation conferring improved stability appears to reside on the E. coli chromosome and not the plasmid (compare to the decay curve for evolved host with evolved plasmid in Fig. 5B). (C) AER9 evolved host/plasmid. AER16 “isolated chromosome strain” also appeared to have a chromosomal mutation causing the increased evolutionary stability of GFP expression. (D) AER11 evolved host/plasmid. This result is inconclusive as both evolved plasmid (AER24) and evolved chromosome (AER18) display an intermediate phenotype between the GFP decay of the ancestor (SKO16) and the evolved population (SKO117). (E) AER12 evolved host/plasmid. This set behaves in a way comparable to the AER16 and AER19 strains “isolated evolved chromosome” strains, which also leads us to conclude that mutations in the chromosome resulted in the gain in GFP evolutionary stability.
  • 24. 15 Mutations present in evolved strains with greater GFP stability On the basis of our stability measurements, we selected four evolved clones for whole-genome re-sequencing (AER 7, AER 8, AER9, and AER12). The purpose of obtaining the sequencing data was to compare the differences at the chromosomal level in comparison to the SKO16 ancestor and that of the SKO117 evolved clones. By further comparing mutations in different mutagenized and evolved strains, we hoped to identify mutations that could play a role in their increased evolutionary robustness. By using the breseq pipeline to analyze our sequencing data, we were able to characterize the mutations present in the SKO117 evolved clones. We identified thirteen distinct Table 1. Mutations identified by whole-genome sequencing of four evolved strains Thirteen mutations identified by analyzing Illumina genome re-sequencing data for four clonal samples isolated from the SKO117 evolved population with the breseq computational pipeline (Barrick et al., 2009). On the basis of the genetic differences identified, we determined that clones AER7, AER8, and AER9 likely belong to a single subpopulation that was derived from the same mutagenized ancestor cell and that AER12 belongs to a distinct subpopulation derived from a different mutagenized ancestor.
  • 25. 16 mutations across the four selected evolved strains (Table 1). Interestingly, we could separate the analyzed clones AER7, AER8, and AER9 as originating from one subpopulation and AER12 as originating from a second subpopulation, each with its own set of many shared mutations that likely arose due to the UV mutagenesis step.
  • 26. 17 CONCLUSIONS Now that a set of candidate mutations able to increase the evolutionary reliability of GFP expression from a plasmid is available, further testing is required to determine the specific mutations that are responsible. We propose three experiments that would help in characterizing our evolved strains in future work. First, we could test relevant mutants from the Keio collection of single-gene knockouts (Baba et al., 2006). This experiment would allow us to determine whether a loss-of-function mutation in a gene is responsible for the gain in evolutionary robustness. Alternatively, we could use the ASKA plasmid library to explore if a gain-of-function mutation – functionally equivalent to gene overexpression – has occurred and contributes to this phenotype (Kitagawa et al., 2005). Second, to further understand the observed results, we could engineer the specific point mutations we observed in each gene of interest individually into the ancestral E. coli genome, then compare the maintenance of GFP expression in these "reconstructed" strains to the ancestor. Third, we could characterize the mutations present in evolved or reconstructed strains by performing a competition assays to determine how they affect the fitness cost of plasmid maintenance (i.e., the metabolic load) (De Gelder et al., 2007). We expected GFP expression from our synthetic plasmid to be disrupted by new spontaneous mutations that occurred during growth of the bacterial cultures. Therefore, we examined the scientific literature related to the genes hit by mutations in the re- sequenced chromosomes (Table 1) to see whether any had previously been shown to reduce E. coli mutation rates. Examples of known ways to genetically engineer reduced
  • 27. 18 mutation rates in E. coli include strains in which all insertion sequence (IS) elements have been removed (Pósfai et al., 2006). These mobile elements can insert into plasmids and can cause disruptions/deletions (e.g., IS1 elements present in several E. coli strains) (Prather et al., 2006). Another example of engineering a lower mutation rate is deleting specific genes that allow for recombination in an E. coli strain, such as recA, to reduce recombination between homologous sequences present in a plasmid (Phue et al., 2008). Another important mechanism that has been described for reducing mutation rates in E. coli is the use of certain DNA polymerase variants. Reducing the rate of DNA replication seems to be correlated with enhanced fidelity in these "antimutator" mutants (Kingsbury and Helinski, 1970). The molecular mechanism of this antimutator effect may be increased proofreading efficiency or improved selectivity in nucleotide incorporation. A compilation of DNA polymerases with known antimutator variants exists in the literature (Herr et al., 2011). One of our candidate mutations is in E. coli PolA (PolI), one of the polymerases in this compendium with known antimutator variants. PolA is an essential bacterial polymerase with both a 5′ to 3′ exonuclease activity and 3′ to 5′ proofreading activity. Its main role is removing the RNA primers used in lagging strand synthesis and filling in the resulting gaps during chromosomal replication (Fukushima et al., 2007). Although the mutation found in our evolved strain does not exactly match any of the known antimutator variants of PolA, it does occur in the finger domain specifically in a region where most antimutator variants have mutations. Therefore, we propose that our PolA mutation also has an antimutator effect.
  • 28. 19 More specifically, we predict that the H734Y amino acid substitution causes a conformational change in the finger domain of PolI from examining its structural context using PyMol (v.1.3) and a crystal structure of Taq Polymerase (3KTQ) domain (DeLano, 2002; Li et al., 1998). This finger domain has a dual role in PolI, controlling nucleotide selectivity and modulating the difference in extension rate between mispaired and properly paired primer termini. Thus, altering the efficiency of one of these functions could create a PolI variant that had higher DNA replication fidelity. This change would be expected to reduce the overall point mutation rate in these cells, which would make mutations in a plasmid accumulate more slowly. Thus, this PolA mutation offers a possible explanation of how the evolutionary stability of GFP expression from the plasmid improved in the AER7 isolate from the final evolved population. In the second sequenced subpopulation, two PolB (PolII) mutations were found. In E. coli, PolB is regulated by the SOS response, specifically by the LexA repressor, and it is therefore mainly expressed under stress conditions (Iwasaki et al., 1990). PolB is important for repairing certain types of DNA damage, as it is capable of bypassing any replication barriers related to this damage. However, PolB lacks proofreading activity. Thus, it is error-prone and has been implicated in stress-induced mutagenesis (Napolitano et al., 2000; Wagner et al., 2002). Deletion of PolB and two other error-prone polymerases from the E. coli chromosome has been shown to improve the evolutionary stability of a genetic circuit in an engineered E. coli host (Csörgo et al., 2012). This improvement apparently occurs
  • 29. 20 because error-prone polymerases are active to some extent even under normal growth conditions and cause some spontaneous mutations. Therefore, we suggest that the loss-of- function (nonsense) mutation we identified in PolB in evolved clones AER7, AER8, and AER9 functionally knocks out its activity and also – like the PolA mutation – reduces the overall point mutation rate in these E. coli hosts. In summary, we identified chromosomal mutations in the evolved clones that were present in the SKO117 final evolved mixed population. Out of this set, we identified mutations of interest for future study in two DNA polymerases (PolA and PolB). It is likely that each polymerase mutation reduces the rate of mutations in the host cell "chassis" to improve the evolutionary stability of GFP expression from a plasmid. The PolA mutation, present in one subpopulation, may cause a conformational change in a replicative polymerase that increases its fidelity. The PolB mutation seems to knock out an error-prone repair polymerase that appears to elevate the mutation rate under normal growth conditions. Future work is needed to confirm that these mutations are responsible for the increased evolutionary robustness in our evolved strains. It will also be interesting to see if E. coli hosts for synthetic biology with even lower mutation rates can be created by combining these mutations in a single strain or by repeating our selection for improved evolutionary stability on strains that already have these mutations.
  • 30. 21 MATERIALS AND METHODS Bacterial strains and plasmids We transformed the progenitor strain of the Keio collection, Escherichia coli K- 12 BW25113 (Baba et al., 2006), with the plasmid pSKO4 to create SKO16, the starting strain for our study. The high copy number pSKO4 plasmid (pBR322 origin) encodes an ampicillin resistance marker gene and contains a GFPmut3 reporter under control of an inducible Lac promoter (Cormack et al., 1996; Sleight et al., 2010). This plasmid was obtained from the Sauro Lab (University of Washington). For a comprehensive list of all strains and plasmids used in this study see Table 2. We used electrocompetent cells and electroporation for all transformations. Throughout, LB liquid media and LB agar were supplemented with carbenicillin (CRB), if required, to a final concentration of 100 mg/µl. When required, IPTG was also added to a final concentration of 1 mM when supplementing LB liquid media and 10 µl of 100 mM IPTG was spread on top of LB agar plates. Generation of a UV mutagenized population Strain SKO16, was revived from a freezer stock in LB + CRB at 37°C. After overnight growth, 1 ml of culture was pelleted by centrifugation at 3,000 RCF for 5 min. The supernatant was discarded and the pellet was resuspended in 1 ml of sterile saline solution (145 mM NaCl). Six or more droplets of 120 μl of the suspension were transferred to the surface of an empty plastic petri dish. Two different petri dishes were exposed to 27,000 μJ/cm2 (mutagenized) or 0 μJ/cm2 (control) doses of irradiation in a
  • 31. 22 UV crosslinker CL-1000 (UVP Cat. # 95-0174-01). Up to 100 μl from each droplet on a petri dish was pooled by transferring to a 1.7 ml Eppendorf tube. Plating the mutagenized and control samples for viable cell counts was used to judge the extent of mutagenesis, with this dose giving a 95-99% death rate. The mutagenized culture was pelleted again at 3,000 RCF for 5 min. After discarding the supernatant, the pellet was resuspended in 1 mL LB + CRB and allowed to grow overnight. The entire culture was then frozen down for use in downstream applications at a later time. Selective evolution experiment by sorting for GFP+ subpopulations To obtain an evolved mixed population, the ancestral mixed population was serially propagated using a daily 1:1000 dilution to obtain about 10 generations of regrowth per day, except on sorting days were only ~1.25x10⁵ cells were transferred, thus increasing the dilution and the number of generations per day to ~17.3, and resulting in an estimated 365 generations of growth for the entire experiment. The transfer cultures were grown in 10 ml of LB + CRB + IPTG for 24 hours at 37°C and shaking at 120 RPM for 365 generations. To allow further downstream analysis of the cultures and have a fail- safe in the case of contamination, freezer stocks were stored every 10 generations throughout this study in 16.7 % DMSO at −80°C. A FACS Aria IIu (BD Biosciences (Cat. # 643179) flow cytometer/cell-sorter and the FACS Diva software (v. 6.1.3) were used to measure the GFP signal decay and sort cells throughout the experiment. The wavelengths used for GFP excitation and Syto17 excitation are 488nm and 688nm respectively. The received emission GFP/Syto17
  • 32. 23 wavelengths were filtered by their respective bandpass filters (GFP-540 nm filter and Syto-660/20 nm filter) After the subpopulation of GFP fluorescent cells had dropped to less than 15% of the total population, approximately 1.25x10⁵ GFP+ cells were sorted and used to continue the passages. Generating GFP decay curves To generate GFP decay curves, strains were cultured under the same conditions as the evolution experiment. A GFP fluorescence measurement time point was taken every 10 generations. To generate the GFP decay curves the initial time point’s total percentage GFP+ cells in a population was compared to the remaining percentage at later times. At each time point 20 μl of each transfer of tested cultures was diluted in a microplate well with 0.3 μl of Syto17 red fluorescent nucleic acid stain (Life Technologies Cat. # S7579) and 380 ml of ddH2O. The wavelengths used for GFP excitation and Syto17 excitation are 488nm and 688nm, respectively. The emission wavelengths for GFP/Syto17 were filtered by their respective bandpass filters (GFP-540 nm filter and Syto-660/20 nm filter). All measurements were taken using a FACS LSR Fortessa flow cytometer (BD Biosciences Cat. # 647465) and the FACSDiva software (BD Biosciences v. 6.1.3) at the ICMB Microscopy Core Facility (University of Texas at Austin). Analyzing whether GFP plasmid robustness increased after evolution To determine if an observable difference in GFP plasmid stability existed between the initial ancestor population (SKO16) and the final evolved mixed population, we picked six clones the SKO16 ancestor clonal population and the SKO117 evolved mixed
  • 33. 24 population and passaged them for 150 generations using the same conditions as the ones described for the selective evolution experiment. The GFP decay curves were constructed as explained above in the GFP decay curves section. Retransformation of evolved plasmids and strains To eliminate the original genetic circuit to isolate only the chromosome, we cured evolved clones and ancestor clones of their plasmids by passaging them for around 50 generations in 10 ml LB + IPTG. We then plated daily after each passage on LB + IPTG (spreaded) plates until non-fluorescent colonies were identified. We proceeded to patch them on LB + CRB plates to test for CRB-sensitive colonies. Sensitive colonies we identified for each of the ancestor clones and evolved clones were then streaked for single colonies and re-transformed with each of the 365-generation evolved plasmids or the ancestral plasmid. The plasmids were isolated using the PureLink Quick Plasmid Miniprep kit (Life Technologies Cat. # K2100-10). Evolved clone genome sequencing and analysis E. coli genomic DNA was isolated from each of the six evolved clones using the PureLink Genomic DNA Mini Kit (Life Technologies Cat. # K1820-00). This DNA was fragmented using a Covaris S220 sonicator to an average size of 600 bp and library preparation was performed using the NEBNext DNA Library Prep Reagent Set for Illumina (New England Biolabs Cat. # 6000E). We used Magnetic Ampure XP Beads (Beckman Coulter Cat. #A63880) for the required clean up steps and during the final size selection. In both cases the standard protocol provided was followed.
  • 34. 25 The SKO117 evolved clone genomic DNA libraries were sequenced on an Illumina HiSeq 2500 instrument at the Genome Sequencing and Analysis Facility (University of Texas at Austin). Mutations were predicted by the breseq analysis pipeline (Deatherage and Barrick, 2014) using the E. coli K 12 W3110 (GenBank NC_007779.1) genome as a reference sequence. The mutations identified are shown in Table 1.
  • 35. 26 Table 2. E.coli strains and plasmids used in this study Strain Description Source BW25113 Keio collection progenitor strain (Datsenko and Wanner, 2000) SKO16 BW25113 transformed with plasmid pSKO4 (pSB1A2 containing BioBricks R0010 + E0240) (Sleight et al., 2010) SKO117 SKO16-derived population that was UV mutagenized and propagated for 365 generations with sorting for high GFP intensity This work AER7 Clone 1 isolated from SKO117 with plasmid pAER7 This work AER8 Clone 2 isolated from SKO117 with plasmid pAER8 This work AER9 Clone 3 isolated from SKO117 with plasmid pAER9 This work AER10 Clone 4 isolated from SKO117 with plasmid pAER10 This work AER11 Clone 5 isolated from SKO117 with plasmid pAER11 This work AER12 Clone 6 isolated from SKO117 with plasmid pAER12 This work AER14 AER7 cured of evolved plasmid pAER7 This work AER15 AER8 cured of evolved plasmid pAER8 This work AER16 AER9 cured of evolved plasmid pAER9 This work AER17 AER10 cured of evolved plasmid pAER10 This work AER18 AER11 cured of evolved plasmid pAER11 This work AER19 AER12 cured of evolved plasmid pAER12 This work AER20 BW25113 transformed with pAER7 This work AER21 BW25113 transformed with pAER8 This work AER22 BW25113 transformed with pAER9 This work AER23 BW25113 transformed with pAER10 This work AER24 BW25113 transformed with pAER11 This work AER25 BW25113 transformed with pAER12 This work AER26 AER14 transformed with pSKO4 This work AER27 AER15 transformed with pSKO4 This work AER28 AER16 transformed with pSKO4 This work AER29 AER17 transformed with pSKO4 This work AER30 AER18 transformed with pSKO4 This work
  • 36. 27 REFERENCES Anderson, J.C., Clarke, E.J., Arkin, A.P., Voigt, C.A., 2006. Environmentally controlled invasion of cancer cells by engineered bacteria. J. Mol. Biol. 355, 619–627. Baba, T., Ara, T., Hasegawa, M., Takai, Y., Okumura, Y., Baba, M., Datsenko, K.A., Tomita, M., Wanner, B.L., Mori, H., 2006. Construction of Escherichia coli K-12 in-frame, single-gene knockout mutants: the Keio collection. Mol. Syst. Biol. 2, 2006.0008. Barrick, J.E., Yu, D.S., Yoon, S.H., Jeong, H., Oh, T.K., Schneider, D., Lenski, R.E., Kim, J.F., 2009. Genome evolution and adaptation in a long-term experiment with Escherichia coli. Nature 461, 1243–1247. Birnbaum, S., Bailey, J.E., 1991. Plasmid presence changes the relative levels of many host cell proteins and ribosome components in recombinant Escherichia coli. Biotechnol. Bioeng. 37, 736–745. Bower, D.M., Prather, K.L.J., 2009. Engineering of bacterial strains and vectors for the production of plasmid DNA. Appl. Microbiol. Biotechnol. 82, 805–813. Cormack, B.P., Valdivia, R.H., Falkow, S., 1996. FACS-optimized mutants of the green fluorescent protein (GFP), in: Gene. pp. 33–38. Csörgo, B., Fehér, T., Tímár, E., Blattner, F.R., Pósfai, G., 2012. Low-mutation-rate, reduced-genome Escherichia coli: an improved host for faithful maintenance of engineered genetic constructs. Microb. Cell Fact. 11, 11. Datsenko, K. a, Wanner, B.L., 2000. One-step inactivation of chromosomal genes in Escherichia coli K-12 using PCR products. Proc. Natl. Acad. Sci. U. S. A. 97, 6640– 5. De Gelder, L., Ponciano, J.M., Joyce, P., Top, E.M., 2007. Stability of a promiscuous plasmid in different hosts: no guarantee for a long-term relationship. Microbiology 153, 452–463. Deatherage, D.E., Barrick, J.E., 2014. Identification of Mutations in Laboratory Evolved Microbes from Next-generation Sequencing data using breseq, in: Sun, L., Shou, W. (Eds.), Engineering Multicellular Systems: Methods and Protocols. Humana Press. DeLano, W.L., 2002. The PyMOL Molecular Graphics System. Schrödinger LLC wwwpymolorg Version 1., http://www.pymol.org.
  • 37. 28 Elowitz, M.B., Leibler, S., 2000. A synthetic oscillatory network of transcriptional regulators. Nature 403, 335–338. Endy, D., 2005. Foundations for engineering biology. Nature 438, 449–453. Flores, S., de Anda-Herrera, R., Gosset, G., Bolívar, F.G., 2004. Growth-rate recovery of Escherichia coli cultures carrying a multicopy plasmid, by engineering of the pentose-phosphate pathway. Biotechnol. Bioeng. 87, 485–494. Friehs, K., 2004. Plasmid copy number and plasmid stability. Adv. Biochem. Eng. Biotechnol. 86, 47–82. Fukushima, S., Itaya, M., Kato, H., Ogasawara, N., Yoshikawa, H., 2007. Reassessment of the in vivo functions of DNA polymerase I and RNase H in bacterial cell growth. J. Bacteriol. 189, 8575–8583. Glick, B.R., 1995. Metabolic load and heterologous gene expression. Biotechnol. Adv. Hägg, P., De Pohl, J.W., Abdulkarim, F., Isaksson, L.A., 2004. A host/plasmid system that is not dependent on antibiotics and antibiotic resistance genes for stable plasmid maintenance in Escherichia coli. J. Biotechnol. 111, 17–30. Herr, A.J., Williams, L.N., Preston, B.D., 2011. Antimutator variants of DNA polymerases. Crit. Rev. Biochem. Mol. Biol. Hughes, J.M., Lohman, B.K., Deckert, G.E., Nichols, E.P., Settles, M., Abdo, Z., Top, E.M., 2012. The Role of Clonal Interference in the Evolutionary Dynamics of Plasmid-Host Adaptation. MBio. Iwasaki, H., Nakata, A., Walker, G.C., Shinagawa, H., 1990. The Escherichia coli polB gene, which encodes DNA polymerase II, is regulated by the SOS system. J. Bacteriol. 172 , 6268–6273. Kingsbury, D.T., Helinski, D.R., 1970. DNA polymerase as a requirement for the maintenance of the bacterial plasmid colicinogenic factor E1. Biochem. Biophys. Res. Commun. 41, 1538–1544. Kitagawa, M., Ara, T., Arifuzzaman, M., Ioka-Nakamichi, T., Inamoto, E., Toyonaga, H., Mori, H., 2005. Complete set of ORF clones of Escherichia coli ASKA library (a complete set of E. coli K-12 ORF archive): unique resources for biological research. DNA Res. 12, 291–299.
  • 38. 29 Li, Y., Korolev, S., Waksman, G., 1998. Crystal structures of open and closed forms of binary and ternary complexes of the large fragment of Thermus aquaticus DNA polymerase I: structural basis for nucleotide incorporation. EMBO J. 17, 7514–7525. Napolitano, R., Janel-Bintz, R., Wagner, J., Fuchs, R.P., 2000. All three SOS-inducible DNA polymerases (Pol II, Pol IV and Pol V) are involved in induced mutagenesis. EMBO J. 19, 6259–6265. Phue, J.-N., Lee, S.J., Trinh, L., Shiloach, J., 2008. Modified Escherichia coli B (BL21), a superior producer of plasmid DNA compared with Escherichia coli K (DH5α). Biotechnol. Bioeng. 101, 831–836. Pósfai, G., Plunkett, G., Fehér, T., Frisch, D., Keil, G.M., Umenhoffer, K., Kolisnychenko, V., Stahl, B., Sharma, S.S., de Arruda, M., Burland, V., Harcum, S.W., Blattner, F.R., 2006. Emergent properties of reduced-genome Escherichia coli. Science (80-. ). 312, 1044–1046. Prather, K.L.J., Edmonds, M.C., Herod, J.W., 2006. Identification and characterization of IS1 transposition in plasmid amplification mutants of E. coli clones producing DNA vaccines. Appl. Microbiol. Biotechnol. 73, 815–826. Renda, B. a, Hammerling, M.J., Barrick, J.E., 2014. Engineering reduced evolutionary potential for synthetic biology. Mol. Biosyst. Sabe, H., Miwa, T., Kodaki, T., Izui, K., Hiraga, S., Katsuki, H., 1984. Molecular cloning of the phosphoenolpyruvate carboxylase gene, ppc, of Escherichia coli. Gene 31, 279–283. Seo, J.H., Bailey, J.E., 1985. Effects of recombinant plasmid content on growth properties and cloned gene product formation in Escherichia coli. Biotechnol. Bioeng. 27, 1668–1674. Sleight, S.C., Bartley, B.A., Lieviant, J.A., Sauro, H.M., 2010. Designing and engineering evolutionary robust genetic circuits. J. Biol. Eng. 4, 12. Stephanopoulos, G., 2012. Synthetic Biology and Metabolic Engineering. ACS Synth. Biol. 1, 514–525. Tsuruta, H., Paddon, C.J., Eng, D., Lenihan, J.R., Horning, T., Anthony, L.C., Regentin, R., Keasling, J.D., Renninger, N.S., Newman, J.D., 2009. High-level production of amorpha-4, 11-diene, a precursor of the antimalarial agent artemisinin, in Escherichia coli. PLoS One 4.
  • 39. 30 Wagner, J., Etienne, H., Janel-Bintz, R., Fuchs, R.P.P., 2002. Genetics of mutagenesis in E.coli: Various combinations of translesion polymerases (Pol II, IV and V) deal with lesion/sequence context diversity. DNA Repair (Amst). 1, 159–167.