Rn, steiner ranch, river place metrics
•
1 like•305 views

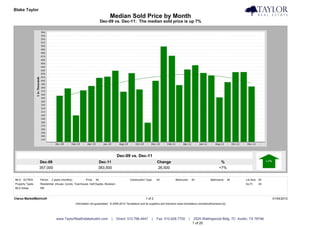
The document compares real estate data from December 2009 to December 2011 in Austin, Texas. It finds that the median sold price increased 7% over that period, from $357,000 to $383,500. The median price of properties for sale was up 12%, while the number of properties sold increased 8%. Under contract properties rose 29% between December 2009 and December 2011. Overall, the data shows modest increases in home prices and sales activity in the Austin area over the 2-year period examined.

Recommended
More Related Content
What's hot
What's hot (20)
Similar to Rn, steiner ranch, river place metrics
Similar to Rn, steiner ranch, river place metrics (12)
Rn, steiner ranch, river place metrics
- 1. Blake Taylor Taylor Real Estate Median Sold Price by Month Dec-09 vs. Dec-11: The median sold price is up 7% Dec-09 vs. Dec-11 Dec-09 Dec-11 Change % 357,000 383,500 26,500 +7% MLS: ACTRIS Period: 2 years (monthly) Price: All Construction Type: All Bedrooms: All Bathrooms: All Lot Size: All Property Types: Residential: (House, Condo, Townhouse, Half Duplex, Modular) Sq Ft: All MLS Areas: RN Clarus MarketMetrics® 1 of 2 01/04/2012 Information not guaranteed. © 2009-2010 Terradatum and its suppliers and licensors (www.terradatum.com/about/licensors.td). www.TaylorRealEstateAustin.com | Direct: 512.796.4447 | Fax: 512.628.7720 | 2525 Wallingwood Bldg. 7C Austin, TX 78746 1 of 20
- 2. Blake Taylor Taylor Real Estate Median Sold Price by Month Dec-09 vs. Dec-11: The median sold price is up 7% Time Period Median Price # Units Average DOM Dec-11 383,500 43 124 Nov-11 425,200 31 70 Oct-11 425,000 45 75 Sep-11 396,000 33 58 Aug-11 352,000 61 79 Jul-11 415,000 35 46 Jun-11 422,500 82 65 May-11 445,000 61 80 Apr-11 432,500 32 131 Mar-11 387,500 52 110 Feb-11 472,154 31 110 Jan-11 499,000 25 84 Dec-10 400,000 37 99 Nov-10 279,000 25 92 Oct-10 375,000 31 87 Sep-10 422,000 41 75 Aug-10 368,500 44 84 Jul-10 429,000 53 64 Jun-10 412,000 51 78 May-10 408,500 46 63 Apr-10 385,000 33 91 Mar-10 372,250 42 89 Feb-10 300,000 25 84 Jan-10 378,000 17 82 Dec-09 357,000 40 96 Clarus MarketMetrics® 2 of 2 01/04/2012 Information not guaranteed. © 2009-2010 Terradatum and its suppliers and licensors (www.terradatum.com/about/licensors.td). www.TaylorRealEstateAustin.com | Direct: 512.796.4447 | Fax: 512.628.7720 | 2525 Wallingwood Bldg. 7C Austin, TX 78746 2 of 20
- 3. Blake Taylor Taylor Real Estate Median For Sale vs. Median Sold Dec-09 vs. Dec-11: The median price of for sale properties is up 12% and the median price of sold properties is up 7% Dec-09 vs. Dec-11 Dec-09 vs. Dec-11 Dec-09 Dec-11 Change % Dec-09 Dec-11 Change % 475,000 533,450 58,450 +12% 357,000 383,500 26,500 +7% MLS: ACTRIS Period: 2 years (monthly) Price: All Construction Type: All Bedrooms: All Bathrooms: All Lot Size: All Property Types: Residential: (House, Condo, Townhouse, Half Duplex, Modular) Sq Ft: All MLS Areas: RN Clarus MarketMetrics® 1 of 2 01/04/2012 Information not guaranteed. © 2009-2010 Terradatum and its suppliers and licensors (www.terradatum.com/about/licensors.td). www.TaylorRealEstateAustin.com | Direct: 512.796.4447 | Fax: 512.628.7720 | 2525 Wallingwood Bldg. 7C Austin, TX 78746 3 of 20
- 4. Blake Taylor Taylor Real Estate Median For Sale vs. Median Sold Dec-09 vs. Dec-11: The median price of for sale properties is up 12% and the median price of sold properties is up 7% For Sale # Properties Sold # Properties Price Time Period Median For Sale Median Sold Difference Dec-11 533,450 266 383,500 43 -149,950 Nov-11 527,000 301 425,200 31 -101,800 Oct-11 525,000 347 425,000 45 -100,000 Sep-11 525,000 354 396,000 33 -129,000 Aug-11 529,500 369 352,000 61 -177,500 Jul-11 525,000 390 415,000 35 -110,000 Jun-11 542,450 378 422,500 82 -119,950 May-11 529,500 395 445,000 61 -84,500 Apr-11 549,900 361 432,500 32 -117,400 Mar-11 533,750 345 387,500 52 -146,250 Feb-11 549,900 295 472,154 31 -77,746 Jan-11 549,100 281 499,000 25 -50,100 Dec-10 522,450 298 400,000 37 -122,450 Nov-10 499,500 345 279,000 25 -220,500 Oct-10 499,700 376 375,000 31 -124,700 Sep-10 499,500 395 422,000 41 -77,500 Aug-10 488,900 447 368,500 44 -120,400 Jul-10 495,000 485 429,000 53 -66,000 Jun-10 504,450 480 412,000 51 -92,450 May-10 495,000 453 408,500 46 -86,500 Apr-10 499,000 441 385,000 33 -114,000 Mar-10 489,000 391 372,250 42 -116,750 Feb-10 470,500 333 300,000 25 -170,500 Jan-10 458,716 336 378,000 17 -80,716 Dec-09 475,000 335 357,000 40 -118,000 Clarus MarketMetrics® 2 of 2 01/04/2012 Information not guaranteed. © 2009-2010 Terradatum and its suppliers and licensors (www.terradatum.com/about/licensors.td). www.TaylorRealEstateAustin.com | Direct: 512.796.4447 | Fax: 512.628.7720 | 2525 Wallingwood Bldg. 7C Austin, TX 78746 4 of 20
- 5. Blake Taylor Taylor Real Estate Sold Properties by Month Dec-09 vs. Dec-11: The number of Sold properties is up 8% Dec-09 vs. Dec-11 Dec-09 Dec-11 Change % 40 43 3 +8% MLS: ACTRIS Period: 2 years (monthly) Price: All Construction Type: All Bedrooms: All Bathrooms: All Lot Size: All Property Types: Residential: (House, Condo, Townhouse, Half Duplex, Modular) Sq Ft: All MLS Areas: RN Clarus MarketMetrics® 1 of 2 01/04/2012 Information not guaranteed. © 2009-2010 Terradatum and its suppliers and licensors (www.terradatum.com/about/licensors.td). www.TaylorRealEstateAustin.com | Direct: 512.796.4447 | Fax: 512.628.7720 | 2525 Wallingwood Bldg. 7C Austin, TX 78746 5 of 20
- 6. Blake Taylor Taylor Real Estate Sold Properties by Month Dec-09 vs. Dec-11: The number of Sold properties is up 8% Full Market Bank Properties Non-Bank Properties Time Period # Properties Median Price Average DOM # Properties % Bank Median Price # Properties % Non-Bank Median Price Dec-11 43 383,500 124 1 2.3 505,000 42 97.7 382,250 Nov-11 31 425,200 70 2 6.5 257,000 29 93.5 428,000 Oct-11 45 425,000 75 1 2.2 443,000 44 97.8 415,000 Sep-11 33 396,000 58 0 33 100.0 396,000 Aug-11 61 352,000 79 3 4.9 475,150 58 95.1 348,500 Jul-11 35 415,000 46 5 14.3 547,000 30 85.7 396,250 Jun-11 82 422,500 65 6 7.3 280,000 76 92.7 425,950 May-11 61 445,000 80 3 4.9 270,000 58 95.1 455,000 Apr-11 32 432,500 131 3 9.4 310,000 29 90.6 435,000 Mar-11 52 387,500 110 9 17.3 325,000 43 82.7 392,850 Feb-11 31 472,154 110 6 19.4 302,500 25 80.7 510,000 Jan-11 25 499,000 84 5 20.0 625,000 20 80.0 462,000 Dec-10 37 400,000 99 6 16.2 207,000 31 83.8 417,000 Nov-10 25 279,000 92 3 12.0 435,000 22 88.0 277,000 Oct-10 31 375,000 87 2 6.5 304,750 29 93.5 375,000 Sep-10 41 422,000 75 4 9.8 286,348 37 90.2 422,000 Aug-10 44 368,500 84 4 9.1 251,750 40 90.9 392,500 Jul-10 53 429,000 64 4 7.5 355,000 49 92.5 433,600 Jun-10 51 412,000 78 4 7.8 229,750 47 92.2 435,000 May-10 46 408,500 63 2 4.3 323,450 44 95.7 411,500 Apr-10 33 385,000 91 4 12.1 411,250 29 87.9 385,000 Mar-10 42 372,250 89 5 11.9 280,000 37 88.1 388,500 Feb-10 25 300,000 84 6 24.0 255,748 19 76.0 340,000 Jan-10 17 378,000 82 1 5.9 182,175 16 94.1 384,000 Dec-09 40 357,000 96 5 12.5 330,000 35 87.5 363,000 Clarus MarketMetrics® 2 of 2 01/04/2012 Information not guaranteed. © 2009-2010 Terradatum and its suppliers and licensors (www.terradatum.com/about/licensors.td). www.TaylorRealEstateAustin.com | Direct: 512.796.4447 | Fax: 512.628.7720 | 2525 Wallingwood Bldg. 7C Austin, TX 78746 6 of 20
- 7. Blake Taylor Taylor Real Estate Under Contract Properties by Month Dec-09 vs. Dec-11: The number of Under Contract properties is up 29% Dec-09 vs. Dec-11 Dec-09 Dec-11 Change % 21 27 6 +29% MLS: ACTRIS Period: 2 years (monthly) Price: All Construction Type: All Bedrooms: All Bathrooms: All Lot Size: All Property Types: Residential: (House, Condo, Townhouse, Half Duplex, Modular) Sq Ft: All MLS Areas: RN Clarus MarketMetrics® 1 of 2 01/04/2012 Information not guaranteed. © 2009-2010 Terradatum and its suppliers and licensors (www.terradatum.com/about/licensors.td). www.TaylorRealEstateAustin.com | Direct: 512.796.4447 | Fax: 512.628.7720 | 2525 Wallingwood Bldg. 7C Austin, TX 78746 7 of 20
- 8. Blake Taylor Taylor Real Estate Under Contract Properties by Month Dec-09 vs. Dec-11: The number of Under Contract properties is up 29% Full Market Bank Properties Non-Bank Properties Time Period # Properties Median Price Average DOM # Properties % Bank Median Price # Properties % Non-Bank Median Price Dec-11 27 435,000 148 3 11.1 335,900 24 88.9 474,300 Nov-11 41 379,000 98 5 12.2 209,900 36 87.8 392,495 Oct-11 45 429,000 89 0 45 100.0 429,000 Sep-11 31 429,000 81 3 9.7 425,000 28 90.3 434,000 Aug-11 40 441,944 72 1 2.5 261,500 39 97.5 448,888 Jul-11 55 347,500 64 2 3.6 364,185 53 96.4 347,500 Jun-11 47 439,000 69 4 8.5 680,840 43 91.5 429,900 May-11 75 425,000 60 6 8.0 144,950 69 92.0 437,000 Apr-11 55 489,000 103 6 10.9 323,900 49 89.1 499,000 Mar-11 50 454,450 65 3 6.0 303,900 47 94.0 469,000 Feb-11 38 392,500 107 7 18.4 265,000 31 81.6 410,000 Jan-11 31 399,990 137 6 19.4 525,050 25 80.7 399,990 Dec-10 33 499,500 91 6 18.2 506,950 27 81.8 499,500 Nov-10 30 379,450 99 4 13.3 284,900 26 86.7 404,495 Oct-10 38 409,191 100 3 7.9 594,900 35 92.1 400,000 Sep-10 31 419,000 78 5 16.1 400,000 26 83.9 438,610 Aug-10 39 339,500 85 3 7.7 143,000 36 92.3 359,250 Jul-10 51 436,000 77 3 5.9 293,600 48 94.1 467,450 Jun-10 49 429,000 68 3 6.1 385,000 46 93.9 436,995 May-10 34 424,482 67 2 5.9 375,750 32 94.1 460,732 Apr-10 57 425,058 77 3 5.3 247,500 54 94.7 430,000 Mar-10 39 405,000 65 4 10.3 252,450 35 89.7 417,585 Feb-10 33 339,900 101 4 12.1 372,900 29 87.9 336,610 Jan-10 32 349,356 82 8 25.0 255,000 24 75.0 417,964 Dec-09 21 349,000 114 3 14.3 259,900 18 85.7 366,500 Clarus MarketMetrics® 2 of 2 01/04/2012 Information not guaranteed. © 2009-2010 Terradatum and its suppliers and licensors (www.terradatum.com/about/licensors.td). www.TaylorRealEstateAustin.com | Direct: 512.796.4447 | Fax: 512.628.7720 | 2525 Wallingwood Bldg. 7C Austin, TX 78746 8 of 20
- 9. Blake Taylor Taylor Real Estate New Properties by Month Dec-09 vs. Dec-11: The number of New properties is down 33% Dec-09 vs. Dec-11 Dec-09 Dec-11 Change % 46 31 -15 -33% MLS: ACTRIS Period: 2 years (monthly) Price: All Construction Type: All Bedrooms: All Bathrooms: All Lot Size: All Property Types: Residential: (House, Condo, Townhouse, Half Duplex, Modular) Sq Ft: All MLS Areas: RN Clarus MarketMetrics® 1 of 2 01/04/2012 Information not guaranteed. © 2009-2010 Terradatum and its suppliers and licensors (www.terradatum.com/about/licensors.td). www.TaylorRealEstateAustin.com | Direct: 512.796.4447 | Fax: 512.628.7720 | 2525 Wallingwood Bldg. 7C Austin, TX 78746 9 of 20
- 10. Blake Taylor Taylor Real Estate New Properties by Month Dec-09 vs. Dec-11: The number of New properties is down 33% Full Market Bank Properties Non-Bank Properties Time Period # Properties Median Price # Properties % Bank Median Price # Properties % Non-Bank Median Price Dec-11 31 515,000 0 31 100.0 515,000 Nov-11 34 464,950 3 8.8 339,000 31 91.2 479,900 Oct-11 62 499,900 1 1.6 84,900 61 98.4 499,900 Sep-11 58 425,250 5 8.6 299,000 53 91.4 439,000 Aug-11 70 435,000 2 2.9 339,900 68 97.1 435,000 Jul-11 93 400,840 3 3.2 389,900 90 96.8 405,415 Jun-11 77 474,900 3 3.9 425,000 74 96.1 484,450 May-11 120 482,500 2 1.7 524,450 118 98.3 482,500 Apr-11 92 502,495 4 4.3 524,450 88 95.7 502,495 Mar-11 115 439,965 4 3.5 284,400 111 96.5 442,888 Feb-11 75 500,000 4 5.3 260,700 71 94.7 524,900 Jan-11 50 613,900 4 8.0 561,400 46 92.0 619,000 Dec-10 31 419,000 8 25.8 347,950 23 74.2 465,000 Nov-10 65 419,990 4 6.2 667,400 61 93.8 419,990 Oct-10 60 430,445 4 6.7 239,900 56 93.3 445,950 Sep-10 48 463,060 9 18.8 299,900 39 81.2 475,000 Aug-10 69 436,000 5 7.2 400,000 64 92.8 436,815 Jul-10 85 369,900 6 7.1 524,500 79 92.9 369,900 Jun-10 95 509,900 9 9.5 293,600 86 90.5 519,950 May-10 96 399,500 5 5.2 153,000 91 94.8 400,000 Apr-10 136 438,250 7 5.2 385,000 129 94.8 439,000 Mar-10 112 479,000 8 7.1 246,250 104 92.9 495,000 Feb-10 56 492,450 4 7.1 352,450 52 92.9 562,000 Jan-10 76 398,414 8 10.5 305,950 68 89.5 408,788 Dec-09 46 462,400 8 17.4 274,900 38 82.6 478,695 Clarus MarketMetrics® 2 of 2 01/04/2012 Information not guaranteed. © 2009-2010 Terradatum and its suppliers and licensors (www.terradatum.com/about/licensors.td). www.TaylorRealEstateAustin.com | Direct: 512.796.4447 | Fax: 512.628.7720 | 2525 Wallingwood Bldg. 7C Austin, TX 78746 10 of 20
- 11. Blake Taylor Taylor Real Estate For Sale Properties by Month Dec-09 vs. Dec-11: The number of For Sale properties is down 21% Dec-09 vs. Dec-11 Dec-09 Dec-11 Change % 335 266 -69 -21% MLS: ACTRIS Period: 2 years (monthly) Price: All Construction Type: All Bedrooms: All Bathrooms: All Lot Size: All Property Types: Residential: (House, Condo, Townhouse, Half Duplex, Modular) Sq Ft: All MLS Areas: RN Clarus MarketMetrics® 1 of 2 01/04/2012 Information not guaranteed. © 2009-2010 Terradatum and its suppliers and licensors (www.terradatum.com/about/licensors.td). www.TaylorRealEstateAustin.com | Direct: 512.796.4447 | Fax: 512.628.7720 | 2525 Wallingwood Bldg. 7C Austin, TX 78746 11 of 20
- 12. Blake Taylor Taylor Real Estate For Sale Properties by Month Dec-09 vs. Dec-11: The number of For Sale properties is down 21% Full Market Bank Properties Non-Bank Properties Time Period # Properties Median Price Average DOM # Properties % Bank Median Price # Properties % Non-Bank Median Price Dec-11 266 533,450 144 8 3.0 337,450 258 97.0 550,000 Nov-11 301 527,000 133 13 4.3 299,000 288 95.7 550,000 Oct-11 347 525,000 119 10 2.9 262,000 337 97.1 527,000 Sep-11 354 525,000 118 12 3.4 317,450 342 96.6 533,500 Aug-11 369 529,500 107 8 2.2 325,700 361 97.8 539,900 Jul-11 390 525,000 100 8 2.0 329,950 382 98.0 527,388 Jun-11 378 542,450 100 10 2.6 441,685 368 97.3 549,000 May-11 395 529,500 91 14 3.5 260,700 381 96.5 537,500 Apr-11 361 549,900 103 19 5.3 299,500 342 94.7 554,702 Mar-11 345 533,750 105 20 5.8 301,700 325 94.2 549,900 Feb-11 295 549,900 132 26 8.8 314,700 269 91.2 599,000 Jan-11 281 549,100 152 28 10.0 346,600 253 90.0 558,900 Dec-10 298 522,450 153 32 10.7 344,900 266 89.3 549,500 Nov-10 345 499,500 140 30 8.7 339,900 315 91.3 519,900 Oct-10 376 499,700 139 32 8.5 346,600 344 91.5 525,000 Sep-10 395 499,500 142 35 8.9 359,100 360 91.1 519,950 Aug-10 447 488,900 130 31 6.9 359,100 416 93.1 489,900 Jul-10 485 495,000 120 32 6.6 349,150 453 93.4 499,900 Jun-10 480 504,450 113 31 6.5 339,900 449 93.5 524,900 May-10 453 495,000 112 25 5.5 348,300 428 94.5 504,500 Apr-10 441 499,000 110 27 6.1 339,900 414 93.9 520,000 Mar-10 391 489,000 125 29 7.4 269,900 362 92.6 499,900 Feb-10 333 470,500 137 26 7.8 344,100 307 92.2 495,000 Jan-10 336 458,716 136 30 8.9 334,900 306 91.1 475,000 Dec-09 335 475,000 148 27 8.1 329,900 308 91.9 499,000 Clarus MarketMetrics® 2 of 2 01/04/2012 Information not guaranteed. © 2009-2010 Terradatum and its suppliers and licensors (www.terradatum.com/about/licensors.td). www.TaylorRealEstateAustin.com | Direct: 512.796.4447 | Fax: 512.628.7720 | 2525 Wallingwood Bldg. 7C Austin, TX 78746 12 of 20
- 13. Blake Taylor Taylor Real Estate Expired Properties by Month Dec-09 vs. Dec-11: The number of Expired properties is down 19% Dec-09 vs. Dec-11 Dec-09 Dec-11 Change % 54 44 -10 -19% MLS: ACTRIS Period: 2 years (monthly) Price: All Construction Type: All Bedrooms: All Bathrooms: All Lot Size: All Property Types: Residential: (House, Condo, Townhouse, Half Duplex, Modular) Sq Ft: All MLS Areas: RN Clarus MarketMetrics® 1 of 2 01/04/2012 Information not guaranteed. © 2009-2010 Terradatum and its suppliers and licensors (www.terradatum.com/about/licensors.td). www.TaylorRealEstateAustin.com | Direct: 512.796.4447 | Fax: 512.628.7720 | 2525 Wallingwood Bldg. 7C Austin, TX 78746 13 of 20
- 14. Blake Taylor Taylor Real Estate Expired Properties by Month Dec-09 vs. Dec-11: The number of Expired properties is down 19% Full Market Bank Properties Non-Bank Properties Time Period # Properties Median Price Average DOM # Properties % Bank Median Price # Properties % Non-Bank Median Price Dec-11 44 521,000 162 1 2.3 299,000 43 97.7 527,000 Nov-11 25 644,000 175 0 25 100.0 644,000 Oct-11 35 519,000 124 0 35 100.0 519,000 Sep-11 38 534,700 156 0 38 100.0 534,700 Aug-11 33 500,000 104 0 33 100.0 500,000 Jul-11 36 568,888 135 0 36 100.0 568,888 Jun-11 34 617,500 138 1 2.9 525,000 33 97.1 660,000 May-11 19 542,000 94 1 5.3 259,900 18 94.7 553,500 Apr-11 31 601,900 148 1 3.2 949,000 30 96.8 600,450 Mar-11 26 505,000 119 2 7.7 344,500 24 92.3 505,000 Feb-11 27 675,000 239 3 11.1 334,900 24 88.9 709,450 Jan-11 30 435,184 177 0 30 100.0 435,184 Dec-10 34 532,450 190 2 5.9 334,950 32 94.1 541,900 Nov-10 48 437,200 144 2 4.2 232,450 46 95.8 456,750 Oct-10 58 492,450 142 3 5.2 495,000 55 94.8 489,900 Sep-10 48 482,450 165 2 4.2 972,500 46 95.8 462,000 Aug-10 61 419,000 132 2 3.3 449,000 59 96.7 419,000 Jul-10 56 524,950 130 3 5.4 945,000 53 94.6 524,900 Jun-10 31 437,500 114 2 6.5 224,900 29 93.5 439,000 May-10 34 430,000 177 1 2.9 119,900 33 97.1 470,000 Apr-10 27 419,000 163 4 14.8 187,450 23 85.2 435,000 Mar-10 47 379,000 153 5 10.6 245,000 42 89.4 424,000 Feb-10 21 650,000 131 1 4.8 470,500 20 95.2 662,500 Jan-10 27 369,958 176 0 27 100.0 369,958 Dec-09 54 579,000 161 2 3.7 529,500 52 96.3 581,950 Clarus MarketMetrics® 2 of 2 01/04/2012 Information not guaranteed. © 2009-2010 Terradatum and its suppliers and licensors (www.terradatum.com/about/licensors.td). www.TaylorRealEstateAustin.com | Direct: 512.796.4447 | Fax: 512.628.7720 | 2525 Wallingwood Bldg. 7C Austin, TX 78746 14 of 20
- 15. Blake Taylor Taylor Real Estate Supply & Demand by Month Dec-09 vs. Dec-11: The number of for sale properties is down 21% and the number of sold properties is up 8% Dec-09 vs. Dec-11 Dec-09 vs. Dec-11 Dec-09 Dec-11 Change % Dec-09 Dec-11 Change % 335 266 -69 -21% 40 43 3 +8% MLS: ACTRIS Period: 2 years (monthly) Price: All Construction Type: All Bedrooms: All Bathrooms: All Lot Size: All Property Types: Residential: (House, Condo, Townhouse, Half Duplex, Modular) Sq Ft: All MLS Areas: RN Clarus MarketMetrics® 1 of 2 01/04/2012 Information not guaranteed. © 2009-2010 Terradatum and its suppliers and licensors (www.terradatum.com/about/licensors.td). www.TaylorRealEstateAustin.com | Direct: 512.796.4447 | Fax: 512.628.7720 | 2525 Wallingwood Bldg. 7C Austin, TX 78746 15 of 20
- 16. Blake Taylor Taylor Real Estate Supply & Demand by Month Dec-09 vs. Dec-11: The number of for sale properties is down 21% and the number of sold properties is up 8% # Properties Average DOM # Properties Average DOM Time Period For Sale For Sale Sold Sold Dec-11 266 144 43 124 Nov-11 301 133 31 70 Oct-11 347 119 45 75 Sep-11 354 118 33 58 Aug-11 369 107 61 79 Jul-11 390 100 35 46 Jun-11 378 100 82 65 May-11 395 91 61 80 Apr-11 361 103 32 131 Mar-11 345 105 52 110 Feb-11 295 132 31 110 Jan-11 281 152 25 84 Dec-10 298 153 37 99 Nov-10 345 140 25 92 Oct-10 376 139 31 87 Sep-10 395 142 41 75 Aug-10 447 130 44 84 Jul-10 485 120 53 64 Jun-10 480 113 51 78 May-10 453 112 46 63 Apr-10 441 110 33 91 Mar-10 391 125 42 89 Feb-10 333 137 25 84 Jan-10 336 136 17 82 Dec-09 335 148 40 96 Clarus MarketMetrics® 2 of 2 01/04/2012 Information not guaranteed. © 2009-2010 Terradatum and its suppliers and licensors (www.terradatum.com/about/licensors.td). www.TaylorRealEstateAustin.com | Direct: 512.796.4447 | Fax: 512.628.7720 | 2525 Wallingwood Bldg. 7C Austin, TX 78746 16 of 20
- 17. Blake Taylor Taylor Real Estate The Average Days on Market by Month Dec-09 vs. Dec-11: The average days on market is up 30% Dec-09 vs. Dec-11 Dec-09 Dec-11 Change % 114 148 34 +30% MLS: ACTRIS Period: 2 years (monthly) Price: All Construction Type: All Bedrooms: All Bathrooms: All Lot Size: All Property Types: Residential: (House, Condo, Townhouse, Half Duplex, Modular) Sq Ft: All MLS Areas: RN Clarus MarketMetrics® 1 of 2 01/04/2012 Information not guaranteed. © 2009-2010 Terradatum and its suppliers and licensors (www.terradatum.com/about/licensors.td). www.TaylorRealEstateAustin.com | Direct: 512.796.4447 | Fax: 512.628.7720 | 2525 Wallingwood Bldg. 7C Austin, TX 78746 17 of 20
- 18. Blake Taylor Taylor Real Estate The Average Days on Market by Month Dec-09 vs. Dec-11: The average days on market is up 30% Time Period Average DOM # UC Units Dec-11 148 27 Nov-11 98 41 Oct-11 89 45 Sep-11 81 31 Aug-11 72 40 Jul-11 64 55 Jun-11 69 47 May-11 60 75 Apr-11 103 55 Mar-11 65 50 Feb-11 107 38 Jan-11 137 31 Dec-10 91 33 Nov-10 99 30 Oct-10 100 38 Sep-10 78 31 Aug-10 85 39 Jul-10 77 51 Jun-10 68 49 May-10 67 34 Apr-10 77 57 Mar-10 65 39 Feb-10 101 33 Jan-10 82 32 Dec-09 114 21 Clarus MarketMetrics® 2 of 2 01/04/2012 Information not guaranteed. © 2009-2010 Terradatum and its suppliers and licensors (www.terradatum.com/about/licensors.td). www.TaylorRealEstateAustin.com | Direct: 512.796.4447 | Fax: 512.628.7720 | 2525 Wallingwood Bldg. 7C Austin, TX 78746 18 of 20
- 19. Blake Taylor Taylor Real Estate Months Supply of Inventory Dec-09 vs. Dec-11: The average months supply of inventory is down 42% Dec-09 vs. Dec-11 Dec-09 Dec-11 Change % 12.4 7.2 -5.2 -42% MLS: ACTRIS Period: 2 years (monthly) Price: All Construction Type: All Bedrooms: All Bathrooms: All Lot Size: All Property Types: Residential: (House, Condo, Townhouse, Half Duplex, Modular) Sq Ft: All MLS Areas: RN Clarus MarketMetrics® 1 of 2 01/04/2012 Information not guaranteed. © 2009-2010 Terradatum and its suppliers and licensors (www.terradatum.com/about/licensors.td). www.TaylorRealEstateAustin.com | Direct: 512.796.4447 | Fax: 512.628.7720 | 2525 Wallingwood Bldg. 7C Austin, TX 78746 19 of 20
- 20. Blake Taylor Taylor Real Estate Months Supply of Inventory Dec-09 vs. Dec-11: The average months supply of inventory is down 42% # Units For Sale # UC Units UC Average Time Period Last Day of Month During Month MSI DOM Dec-11 195 27 7.2 148 Nov-11 235 41 5.7 98 Oct-11 267 45 5.9 89 Sep-11 285 31 9.2 81 Aug-11 296 40 7.4 72 Jul-11 299 55 5.4 64 Jun-11 297 47 6.3 69 May-11 301 75 4.0 60 Apr-11 275 55 5.0 103 Mar-11 269 50 5.4 65 Feb-11 230 38 6.1 107 Jan-11 220 31 7.1 137 Dec-10 231 33 7.0 91 Nov-10 267 30 8.9 99 Oct-10 280 38 7.4 100 Sep-10 316 31 10.2 78 Aug-10 347 39 8.9 85 Jul-10 378 51 7.4 77 Jun-10 400 49 8.2 68 May-10 385 34 11.3 67 Apr-10 357 57 6.3 77 Mar-10 305 39 7.8 65 Feb-10 279 33 8.5 101 Jan-10 277 32 8.7 82 Dec-09 260 21 12.4 114 Clarus MarketMetrics® 2 of 2 01/04/2012 Information not guaranteed. © 2009-2010 Terradatum and its suppliers and licensors (www.terradatum.com/about/licensors.td). www.TaylorRealEstateAustin.com | Direct: 512.796.4447 | Fax: 512.628.7720 | 2525 Wallingwood Bldg. 7C Austin, TX 78746 20 of 20