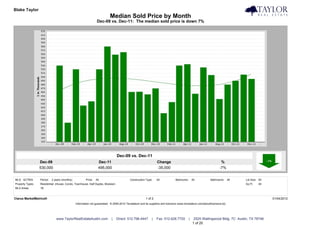
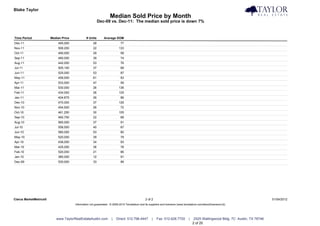
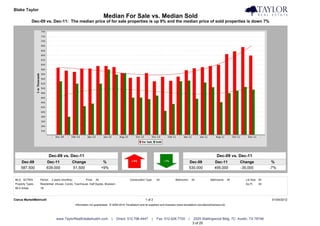
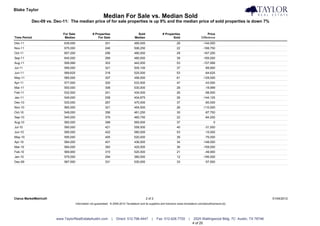
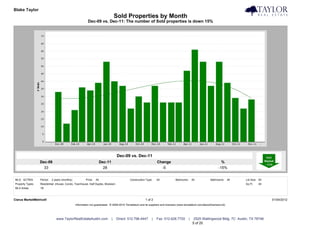
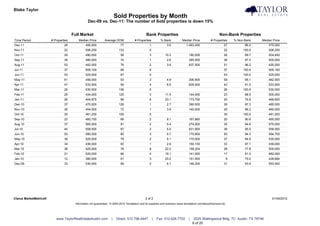
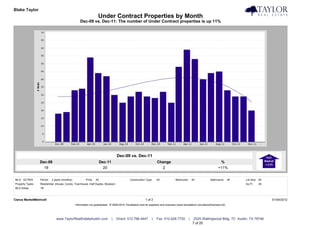
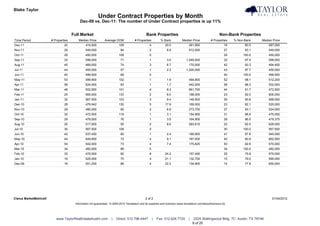
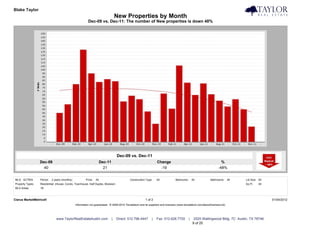
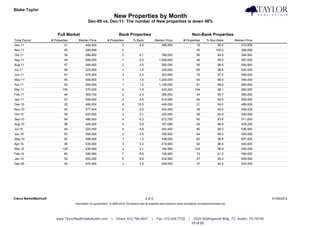
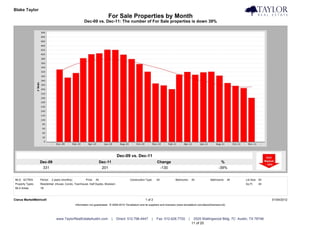
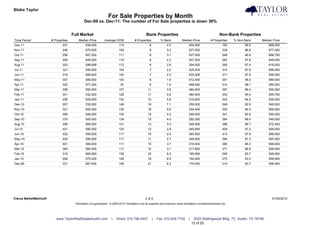
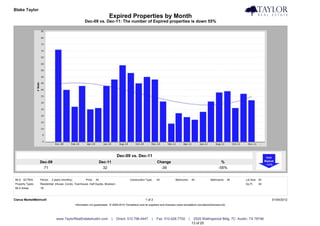
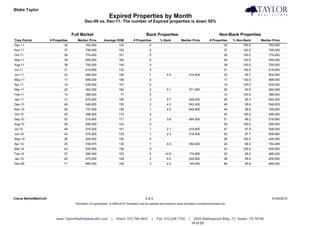
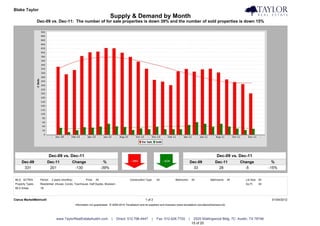
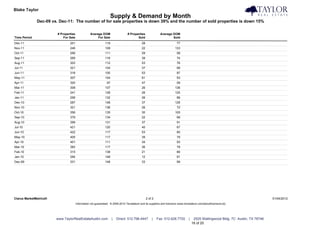
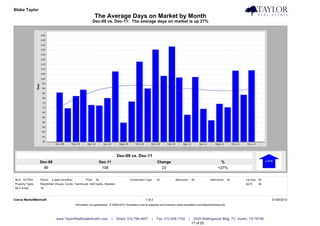
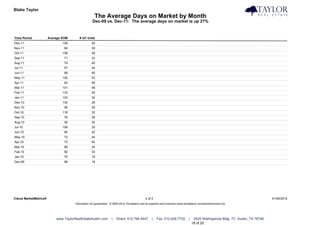
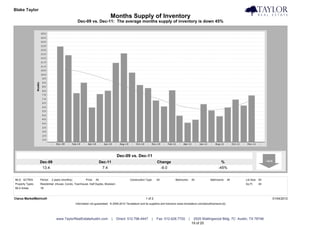
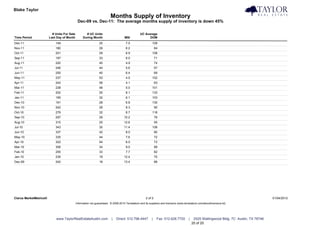
Blake Taylor                                                                                                                                                                            Taylor Real Estate
                                                                            Median Sold Price by Month
                                                                  Dec-09 vs. Dec-11: The median sold price is down 7%


                                                                                 Dec-09 vs. Dec-11
                  Dec-09                                           Dec-11                                         Change                                              %
                  530,000                                          495,000                                        -35,000                                            -7%


MLS: ACTRIS       Period:   2 years (monthly)           Price:   All                        Construction Type:    All            Bedrooms:       All          Bathrooms:      All   Lot Size: All
Property Types:   Residential: (House, Condo, Townhouse, Half Duplex, Modular)                                                                                                      Sq Ft:    All
MLS Areas:        1B


Clarus MarketMetrics®                                                                                    1 of 2                                                                                     01/04/2012
                                                Information not guaranteed. © 2009-2010 Terradatum and its suppliers and licensors (www.terradatum.com/about/licensors.td).


                               www.TaylorRealEstateAustin.com                |   Direct: 512.796.4447         |   Fax: 512.628.7720          |    2525 Wallingwood Bldg. 7C Austin, TX 78746
                                                                                                                                                 1 of 20
Blake Taylor                                                                                                                                                              Taylor Real Estate
                                                                   Median Sold Price by Month
                                                          Dec-09 vs. Dec-11: The median sold price is down 7%


Time Period             Median Price            # Units       Average DOM
Dec-11                      495,000                  28                    77
Nov-11                      506,250                  22                   133
Oct-11                      490,000                  29                    58
Sep-11                      480,000                  39                    74
Aug-11                      442,000                  53                    76
Jul-11                      505,100                  37                    68
Jun-11                      525,000                  53                    87
May-11                      456,000                  61                    93
Apr-11                      533,500                  47                    59
Mar-11                      530,000                  26                   136
Feb-11                      434,000                  26                   125
Jan-11                      404,875                  26                    86
Dec-10                      470,000                  37                   126
Nov-10                      454,500                  26                    72
Oct-10                      461,250                  30                   105
Sep-10                      460,750                  22                    68
Aug-10                      565,000                  37                    91
Jul-10                      558,500                  40                    67
Jun-10                      580,000                  53                    80
May-10                      520,000                  39                    79
Apr-10                      436,000                  34                    93
Mar-10                      425,000                  36                    78
Feb-10                      520,000                  21                    66
Jan-10                      380,000                  12                    91
Dec-09                      530,000                  33                    99


Clarus MarketMetrics®                                                                           2 of 2                                                                               01/04/2012
                                       Information not guaranteed. © 2009-2010 Terradatum and its suppliers and licensors (www.terradatum.com/about/licensors.td).


                           www.TaylorRealEstateAustin.com           |   Direct: 512.796.4447         |   Fax: 512.628.7720         |    2525 Wallingwood Bldg. 7C Austin, TX 78746
                                                                                                                                       2 of 20
Blake Taylor                                                                                                                                                                               Taylor Real Estate
                                                                        Median For Sale vs. Median Sold
             Dec-09 vs. Dec-11: The median price of for sale properties is up 9% and the median price of sold properties is down 7%


                            Dec-09 vs. Dec-11                                                                                                                       Dec-09 vs. Dec-11
    Dec-09             Dec-11                Change                      %                                                                     Dec-09             Dec-11             Change             %
    587,500            639,000               51,500                     +9%                                                                    530,000            495,000            -35,000           -7%


MLS: ACTRIS       Period:    2 years (monthly)           Price:   All                        Construction Type:    All             Bedrooms:       All         Bathrooms:      All     Lot Size: All
Property Types:   Residential: (House, Condo, Townhouse, Half Duplex, Modular)                                                                                                         Sq Ft:    All
MLS Areas:        1B


Clarus MarketMetrics®                                                                                     1 of 2                                                                                        01/04/2012
                                                 Information not guaranteed. © 2009-2010 Terradatum and its suppliers and licensors (www.terradatum.com/about/licensors.td).


                                www.TaylorRealEstateAustin.com                |   Direct: 512.796.4447         |   Fax: 512.628.7720           |    2525 Wallingwood Bldg. 7C Austin, TX 78746
                                                                                                                                                   3 of 20
Blake Taylor                                                                                                                                                              Taylor Real Estate
                                                             Median For Sale vs. Median Sold
           Dec-09 vs. Dec-11: The median price of for sale properties is up 9% and the median price of sold properties is down 7%

                            For Sale                # Properties                         Sold                 # Properties                        Price
Time Period                  Median                     For Sale                       Median                        Sold                    Difference
Dec-11                      639,000                            201                    495,000                            28                    -144,000
Nov-11                      675,000                            246                    506,250                            22                    -168,750
Oct-11                      657,200                            256                    490,000                            29                    -167,200
Sep-11                      645,000                            269                    480,000                            39                    -165,000
Aug-11                      599,999                            303                    442,000                            53                    -157,999
Jul-11                      595,000                            321                    505,100                            37                     -89,900
Jun-11                      589,625                            318                    525,000                            53                     -64,625
May-11                      585,000                            307                    456,000                            61                    -129,000
Apr-11                      577,000                            320                    533,500                            47                     -43,500
Mar-11                      550,000                            308                    530,000                            26                     -19,999
Feb-11                      532,500                            241                    434,000                            26                     -98,500
Jan-11                      549,000                            258                    404,875                            26                    -144,125
Dec-10                      530,000                            267                    470,000                            37                     -60,000
Nov-10                      565,000                            321                    454,500                            26                    -110,500
Oct-10                      549,000                            356                    461,250                            30                     -87,750
Sep-10                      545,000                            379                    460,750                            22                     -84,250
Aug-10                      565,000                            399                    565,000                            37                            0
Jul-10                      590,000                            421                    558,500                            40                     -31,500
Jun-10                      595,000                            422                    580,000                            53                     -15,000
May-10                      595,000                            405                    520,000                            39                     -75,000
Apr-10                      584,000                            401                    436,000                            34                    -148,000
Mar-10                      584,000                            383                    425,000                            36                    -159,000
Feb-10                      569,900                            315                    520,000                            21                     -49,900
Jan-10                      575,000                            294                    380,000                            12                    -195,000
Dec-09                      587,500                            331                    530,000                            33                     -57,500


Clarus MarketMetrics®                                                                           2 of 2                                                                               01/04/2012
                                       Information not guaranteed. © 2009-2010 Terradatum and its suppliers and licensors (www.terradatum.com/about/licensors.td).


                        www.TaylorRealEstateAustin.com               |   Direct: 512.796.4447        |   Fax: 512.628.7720         |    2525 Wallingwood Bldg. 7C Austin, TX 78746
                                                                                                                                       4 of 20
Blake Taylor                                                                                                                                                                            Taylor Real Estate
                                                                                    Sold Properties by Month
                                                          Dec-09 vs. Dec-11: The number of Sold properties is down 15%


                                                                                    Dec-09 vs. Dec-11
                  Dec-09                                               Dec-11                                     Change                                               %
                    33                                                   28                                         -5                                               -15%


MLS: ACTRIS       Period:   2 years (monthly)           Price:   All                        Construction Type:    All             Bedrooms:       All         Bathrooms:      All   Lot Size: All
Property Types:   Residential: (House, Condo, Townhouse, Half Duplex, Modular)                                                                                                      Sq Ft:    All
MLS Areas:        1B


Clarus MarketMetrics®                                                                                    1 of 2                                                                                     01/04/2012
                                                Information not guaranteed. © 2009-2010 Terradatum and its suppliers and licensors (www.terradatum.com/about/licensors.td).


                               www.TaylorRealEstateAustin.com                   |   Direct: 512.796.4447      |   Fax: 512.628.7720           |    2525 Wallingwood Bldg. 7C Austin, TX 78746
                                                                                                                                                  5 of 20
Blake Taylor                                                                                                                                                                       Taylor Real Estate
                                                                         Sold Properties by Month
                                                  Dec-09 vs. Dec-11: The number of Sold properties is down 15%


                                       Full Market                                                Bank Properties                                            Non-Bank Properties
Time Period             # Properties      Median Price         Average DOM              # Properties          % Bank           Median Price           # Properties    % Non-Bank        Median Price
Dec-11                           28             495,000                     77                      1             3.6             1,463,400                      27         96.4            475,000
Nov-11                           22             506,250                    133                      0                                                            22        100.0            506,250
Oct-11                           29             490,000                     58                      3            10.3               180,000                      26         89.7            504,450
Sep-11                           39             480,000                     74                      1             2.6               385,000                      38         97.4            500,000
Aug-11                           53             442,000                     76                      2             3.8               837,500                      51         96.2            425,000
Jul-11                           37             505,100                     68                      0                                                            37        100.0            505,100
Jun-11                           53             525,000                     87                      0                                                            53        100.0            525,000
May-11                           61             456,000                     93                      3             4.9               306,900                      58         95.1            462,500
Apr-11                           47             533,500                     59                      4             8.5               629,500                      43         91.5            533,500
Mar-11                           26             530,000                    136                      0                                                            26        100.0            530,000
Feb-11                           26             434,000                    125                      3            11.5               144,000                      23         88.5            500,000
Jan-11                           26             404,875                     86                      6            23.1               173,750                      20         76.9            466,650
Dec-10                           37             470,000                    126                      1             2.7               390,000                      36         97.3            485,000
Nov-10                           26             454,500                     72                      1             3.9               140,000                      25         96.2            460,000
Oct-10                           30             461,250                    105                      0                                                            30        100.0            461,250
Sep-10                           22             460,750                     68                      2             9.1               167,860                      20         90.9            465,000
Aug-10                           37             565,000                     91                      2             5.4               274,000                      35         94.6            575,000
Jul-10                           40             558,500                     67                      2             5.0               831,950                      38         95.0            558,500
Jun-10                           53             580,000                     80                      3             5.7               175,800                      50         94.3            594,750
May-10                           39             520,000                     79                      2             5.1               170,000                      37         94.9            535,000
Apr-10                           34             436,000                     93                      1             2.9               150,150                      33         97.1            439,000
Mar-10                           36             425,000                     78                      8            22.2               158,204                      28         77.8            500,000
Feb-10                           21             520,000                     66                      4            19.1               141,000                      17         81.0            682,000
Jan-10                           12             380,000                     91                      3            25.0               151,500                       9         75.0            428,684
Dec-09                           33             530,000                     99                      2             6.1               146,200                      31         93.9            553,500


Clarus MarketMetrics®                                                                            2 of 2                                                                                       01/04/2012
                                        Information not guaranteed. © 2009-2010 Terradatum and its suppliers and licensors (www.terradatum.com/about/licensors.td).


                           www.TaylorRealEstateAustin.com            |   Direct: 512.796.4447           |   Fax: 512.628.7720       |    2525 Wallingwood Bldg. 7C Austin, TX 78746
                                                                                                                                        6 of 20
Blake Taylor                                                                                                                                                                            Taylor Real Estate
                                                                   Under Contract Properties by Month
                                                   Dec-09 vs. Dec-11: The number of Under Contract properties is up 11%


                                                                                    Dec-09 vs. Dec-11
                  Dec-09                                               Dec-11                                     Change                                             %
                    18                                                   20                                         2                                               +11%


MLS: ACTRIS       Period:   2 years (monthly)           Price:   All                        Construction Type:    All             Bedrooms:       All         Bathrooms:      All   Lot Size: All
Property Types:   Residential: (House, Condo, Townhouse, Half Duplex, Modular)                                                                                                      Sq Ft:    All
MLS Areas:        1B


Clarus MarketMetrics®                                                                                    1 of 2                                                                                     01/04/2012
                                                Information not guaranteed. © 2009-2010 Terradatum and its suppliers and licensors (www.terradatum.com/about/licensors.td).


                               www.TaylorRealEstateAustin.com                   |   Direct: 512.796.4447      |   Fax: 512.628.7720           |    2525 Wallingwood Bldg. 7C Austin, TX 78746
                                                                                                                                                  7 of 20
Blake Taylor                                                                                                                                                                       Taylor Real Estate
                                                          Under Contract Properties by Month
                                           Dec-09 vs. Dec-11: The number of Under Contract properties is up 11%


                                       Full Market                                                Bank Properties                                            Non-Bank Properties
Time Period             # Properties      Median Price         Average DOM              # Properties          % Bank           Median Price           # Properties    % Non-Bank        Median Price
Dec-11                           20             474,500                    109                      4            20.0               361,950                      16         80.0            487,000
Nov-11                           29             549,000                     84                      2             6.9               912,000                      27         93.1            549,000
Oct-11                           29             450,000                    108                      0                                                            29        100.0            450,000
Sep-11                           33             599,000                     71                      1             3.0             1,549,000                      32         97.0            599,000
Aug-11                           45             469,000                     74                      3             6.7               170,000                      42         93.3            494,450
Jul-11                           44             455,000                     57                      1             2.3             1,200,000                      43         97.7            450,000
Jun-11                           40             499,500                     69                      0                                                            40        100.0            499,500
May-11                           53             499,900                    102                      1             1.9               494,900                      52         98.1            512,200
Apr-11                           59             524,000                     63                      1             1.7               442,000                      58         98.3            532,000
Mar-11                           48             502,950                    101                      4             8.3               661,700                      44         91.7            472,500
Feb-11                           25             565,000                    133                      2             8.0               198,000                      23         92.0            600,000
Jan-11                           32             567,500                    103                      3             9.4               146,500                      29         90.6            599,000
Dec-10                           28             479,942                    130                      5            17.9               169,000                      23         82.1            520,000
Nov-10                           29             485,000                     90                      2             6.9               273,700                      27         93.1            524,000
Oct-10                           32             472,500                    118                      1             3.1               154,900                      31         96.9            475,000
Sep-10                           29             479,000                     76                      1             3.5               164,900                      28         96.5            479,375
Aug-10                           25             517,000                     55                      2             8.0               263,610                      23         92.0            629,000
Jul-10                           30             567,500                    108                      0                                                            30        100.0            567,500
Jun-10                           42             537,450                     80                      1             2.4               169,900                      41         97.6            545,000
May-10                           44             649,950                     72                      4             9.1               187,000                      40         90.9            662,500
Apr-10                           54             542,000                     73                      4             7.4               175,825                      50         92.6            570,000
Mar-10                           34             482,000                     89                      0                                                            34        100.0            482,000
Feb-10                           33             475,000                     82                      8            24.2               157,450                      25         75.8            575,000
Jan-10                           19             525,000                     70                      4            21.1               132,700                      15         79.0            590,000
Dec-09                           18             551,250                     86                      4            22.2               134,900                      14         77.8            650,000


Clarus MarketMetrics®                                                                            2 of 2                                                                                       01/04/2012
                                        Information not guaranteed. © 2009-2010 Terradatum and its suppliers and licensors (www.terradatum.com/about/licensors.td).


                           www.TaylorRealEstateAustin.com            |   Direct: 512.796.4447           |   Fax: 512.628.7720       |    2525 Wallingwood Bldg. 7C Austin, TX 78746
                                                                                                                                        8 of 20
Blake Taylor                                                                                                                                                                            Taylor Real Estate
                                                                                    New Properties by Month
                                                          Dec-09 vs. Dec-11: The number of New properties is down 48%


                                                                                    Dec-09 vs. Dec-11
                  Dec-09                                               Dec-11                                     Change                                               %
                    40                                                   21                                         -19                                              -48%


MLS: ACTRIS       Period:   2 years (monthly)           Price:   All                        Construction Type:    All             Bedrooms:       All         Bathrooms:      All   Lot Size: All
Property Types:   Residential: (House, Condo, Townhouse, Half Duplex, Modular)                                                                                                      Sq Ft:    All
MLS Areas:        1B


Clarus MarketMetrics®                                                                                    1 of 2                                                                                     01/04/2012
                                                Information not guaranteed. © 2009-2010 Terradatum and its suppliers and licensors (www.terradatum.com/about/licensors.td).


                               www.TaylorRealEstateAustin.com                   |   Direct: 512.796.4447      |   Fax: 512.628.7720           |    2525 Wallingwood Bldg. 7C Austin, TX 78746
                                                                                                                                                  9 of 20
Blake Taylor                                                                                                                                                                    Taylor Real Estate
                                                                        New Properties by Month
                                                 Dec-09 vs. Dec-11: The number of New properties is down 48%


                            Full Market                                   Bank Properties                                              Non-Bank Properties
Time Period             # Properties     Median Price            # Properties         % Bank              Median Price         # Properties       % Non-Bank         Median Price
Dec-11                           21            449,900                       2             9.5                366,950                     19               90.5          510,000
Nov-11                           45            599,999                       0                                                            45             100.0           599,999
Oct-11                           59            599,900                       3             5.1                789,000                     56               94.9          594,900
Sep-11                           49            599,000                       1             2.0              1,549,000                     48               98.0          587,000
Aug-11                           57            549,000                       2             3.5                280,000                     55               96.5          549,900
Jul-11                           66            525,000                       1             1.5                320,000                     65               98.5          525,000
Jun-11                           81            575,000                       2             2.5                343,950                     79               97.5          595,000
May-11                           65            549,900                       1             1.5              1,200,000                     64               98.5          549,450
Apr-11                           82            584,000                       1             1.2              1,199,000                     81               98.8          569,000
Mar-11                          106            570,000                       2             1.9                420,500                    104               98.1          582,000
Feb-11                           46            569,750                       2             4.3                369,950                     44               95.7          594,250
Jan-11                           67            559,000                       3             4.5                319,900                     64               95.5          559,000
Dec-10                           25            489,000                       4            16.0                449,650                     21               84.0          489,000
Nov-10                           42            577,424                       4             9.5                254,450                     38               90.5          589,425
Oct-10                           59            520,000                       3             5.1                245,000                     56               94.9          520,000
Sep-10                           64            488,500                       4             6.2                273,700                     60               93.8          511,000
Aug-10                           56            428,000                       2             3.6                167,060                     54               96.4          439,250
Jul-10                           84            522,450                       4             4.8                342,400                     80               95.2          536,950
Jun-10                           87            595,000                       3             3.5                169,900                     84               96.5          599,000
May-10                           83            599,000                       1             1.2                348,000                     82               98.8          607,000
Apr-10                           95            535,000                       3             3.2                419,900                     92               96.8          540,000
Mar-10                          128            539,500                       4             3.1                184,950                    124               96.9          549,250
Feb-10                           80            506,950                       7             8.8                159,900                     73               91.2          595,000
Jan-10                           52            655,000                       5             9.6                234,900                     47               90.4          699,000
Dec-09                           40            474,950                       3             7.5                248,000                     37               92.5          525,000


Clarus MarketMetrics®                                                                            2 of 2                                                                                   01/04/2012
                                       Information not guaranteed. © 2009-2010 Terradatum and its suppliers and licensors (www.terradatum.com/about/licensors.td).


                           www.TaylorRealEstateAustin.com           |   Direct: 512.796.4447          |    Fax: 512.628.7720       |    2525 Wallingwood Bldg. 7C Austin, TX 78746
                                                                                                                                       10 of 20
Blake Taylor                                                                                                                                                                            Taylor Real Estate
                                                                           For Sale Properties by Month
                                                       Dec-09 vs. Dec-11: The number of For Sale properties is down 39%


                                                                                    Dec-09 vs. Dec-11
                  Dec-09                                               Dec-11                                     Change                                               %
                   331                                                  201                                        -130                                              -39%


MLS: ACTRIS       Period:   2 years (monthly)           Price:   All                        Construction Type:    All             Bedrooms:       All         Bathrooms:      All   Lot Size: All
Property Types:   Residential: (House, Condo, Townhouse, Half Duplex, Modular)                                                                                                      Sq Ft:    All
MLS Areas:        1B


Clarus MarketMetrics®                                                                                    1 of 2                                                                                     01/04/2012
                                                Information not guaranteed. © 2009-2010 Terradatum and its suppliers and licensors (www.terradatum.com/about/licensors.td).


                               www.TaylorRealEstateAustin.com                   |   Direct: 512.796.4447      |   Fax: 512.628.7720           |    2525 Wallingwood Bldg. 7C Austin, TX 78746
                                                                                                                                                  11 of 20
Blake Taylor                                                                                                                                                                       Taylor Real Estate
                                                                  For Sale Properties by Month
                                               Dec-09 vs. Dec-11: The number of For Sale properties is down 39%


                                       Full Market                                                Bank Properties                                            Non-Bank Properties
Time Period             # Properties      Median Price         Average DOM              # Properties          % Bank           Median Price           # Properties    % Non-Bank        Median Price
Dec-11                          201             639,000                    119                      8             4.0               404,000                     193         96.0            669,000
Nov-11                          246             675,000                    109                      8             3.2               527,500                     238         96.8            677,000
Oct-11                          256             657,200                    111                      8             3.1               527,500                     248         96.9            666,750
Sep-11                          269             645,000                    116                      6             2.2               527,500                     263         97.8            649,000
Aug-11                          303             599,999                    112                      8             2.6               394,500                     295         97.4            619,000
Jul-11                          321             595,000                    104                      7             2.2               525,000                     314         97.8            598,000
Jun-11                          318             589,625                    100                      7             2.2               525,000                     311         97.8            595,000
May-11                          307             585,000                    104                      6             1.9               512,450                     301         98.0            589,000
Apr-11                          320             577,000                     97                      6             1.9               468,450                     314         98.1            589,250
Mar-11                          308             550,000                    107                     11             3.6               484,900                     297         96.4            550,000
Feb-11                          241             532,500                    128                     11             4.6               484,900                     230         95.4            549,750
Jan-11                          258             549,000                    132                     15             5.8               319,900                     243         94.2            559,000
Dec-10                          267             530,000                    148                     19             7.1               259,000                     248         92.9            549,000
Nov-10                          321             565,000                    136                     18             5.6               254,450                     303         94.4            569,900
Oct-10                          356             549,000                    135                     15             4.2               248,000                     341         95.8            550,000
Sep-10                          379             545,000                    134                     15             4.0               392,500                     364         96.0            549,000
Aug-10                          399             565,000                    131                     13             3.3               348,000                     386         96.7            572,450
Jul-10                          421             590,000                    120                     12             2.9               449,950                     409         97.2            595,000
Jun-10                          422             595,000                    117                     10             2.4               383,950                     412         97.6            599,000
May-10                          405             595,000                    117                     11             2.7               348,000                     394         97.3            597,000
Apr-10                          401             584,000                    111                     15             3.7               318,500                     386         96.3            599,000
Mar-10                          383             584,000                    117                     12             3.1               217,600                     371         96.9            599,000
Feb-10                          315             569,900                    138                     20             6.3               185,950                     295         93.7            599,900
Jan-10                          294             575,000                    148                     19             6.5               194,000                     275         93.5            599,900
Dec-09                          331             587,500                    148                     21             6.3               170,000                     310         93.7            599,950


Clarus MarketMetrics®                                                                            2 of 2                                                                                       01/04/2012
                                        Information not guaranteed. © 2009-2010 Terradatum and its suppliers and licensors (www.terradatum.com/about/licensors.td).


                           www.TaylorRealEstateAustin.com            |   Direct: 512.796.4447           |   Fax: 512.628.7720       |    2525 Wallingwood Bldg. 7C Austin, TX 78746
                                                                                                                                        12 of 20
Blake Taylor                                                                                                                                                                            Taylor Real Estate
                                                                           Expired Properties by Month
                                                       Dec-09 vs. Dec-11: The number of Expired properties is down 55%


                                                                                    Dec-09 vs. Dec-11
                  Dec-09                                               Dec-11                                     Change                                               %
                    71                                                   32                                         -39                                              -55%


MLS: ACTRIS       Period:   2 years (monthly)           Price:   All                        Construction Type:    All             Bedrooms:       All         Bathrooms:      All   Lot Size: All
Property Types:   Residential: (House, Condo, Townhouse, Half Duplex, Modular)                                                                                                      Sq Ft:    All
MLS Areas:        1B


Clarus MarketMetrics®                                                                                    1 of 2                                                                                     01/04/2012
                                                Information not guaranteed. © 2009-2010 Terradatum and its suppliers and licensors (www.terradatum.com/about/licensors.td).


                               www.TaylorRealEstateAustin.com                   |   Direct: 512.796.4447      |   Fax: 512.628.7720           |    2525 Wallingwood Bldg. 7C Austin, TX 78746
                                                                                                                                                  13 of 20
Blake Taylor                                                                                                                                                                       Taylor Real Estate
                                                                   Expired Properties by Month
                                               Dec-09 vs. Dec-11: The number of Expired properties is down 55%


                                       Full Market                                                Bank Properties                                            Non-Bank Properties
Time Period             # Properties      Median Price         Average DOM             # Properties           % Bank          Median Price           # Properties     % Non-Bank       Median Price
Dec-11                           32             762,500                    142                      0                                                            32        100.0           762,500
Nov-11                           37             795,000                    150                      0                                                            37        100.0           795,000
Oct-11                           26             774,450                    151                      0                                                            26        100.0           774,450
Sep-11                           39             565,000                    164                      0                                                            39        100.0           565,000
Aug-11                           38             700,000                    148                      0                                                            38        100.0           700,000
Jul-11                           31             619,900                    132                      0                                                            31        100.0           619,900
Jun-11                           23             489,000                    126                      1             4.3               414,400                      22         95.7           504,500
May-11                           17             699,000                    106                      0                                                            17        100.0           699,000
Apr-11                           19             635,000                    157                      0                                                            19        100.0           635,000
Mar-11                           22             462,200                    162                      2             9.1               371,950                      20         90.9           464,538
Feb-11                           14             389,000                     77                      0                                                            14        100.0           389,000
Jan-11                           31             675,000                    156                      3             9.7               248,000                      28         90.3           694,325
Dec-10                           48             548,825                    153                      2             4.2               542,450                      46         95.8           548,825
Nov-10                           50             737,000                    158                      1             2.0               649,900                      49         98.0           749,000
Oct-10                           45             499,000                    175                      0                                                            45        100.0           499,000
Sep-10                           53             519,900                    171                      2             3.8               564,000                      51         96.2           519,900
Aug-10                           59             595,000                    124                      0                                                            59        100.0           595,000
Jul-10                           48             574,000                    101                      1             2.1               419,900                      47         97.9           599,000
Jun-10                           43             575,000                    135                      1             2.3               318,500                      42         97.7           609,950
May-10                           26             429,000                    154                      0                                                            26        100.0           429,000
Apr-10                           25             749,575                    135                      1             4.0               350,000                      24         96.0           754,288
Mar-10                           43             635,000                    158                      0                                                            43        100.0           635,000
Feb-10                           27             390,000                    153                      4            14.8               174,900                      23         85.2           488,226
Jan-10                           40             575,000                    128                      2             5.0               204,900                      38         95.0           609,500
Dec-09                           71             660,000                    156                      3             4.2               145,900                      68         95.8           680,000


Clarus MarketMetrics®                                                                            2 of 2                                                                                       01/04/2012
                                        Information not guaranteed. © 2009-2010 Terradatum and its suppliers and licensors (www.terradatum.com/about/licensors.td).


                            www.TaylorRealEstateAustin.com           |   Direct: 512.796.4447           |   Fax: 512.628.7720       |    2525 Wallingwood Bldg. 7C Austin, TX 78746
                                                                                                                                        14 of 20
Blake Taylor                                                                                                                                                                                Taylor Real Estate
                                                                                Supply & Demand by Month
                  Dec-09 vs. Dec-11: The number of for sale properties is down 39% and the number of sold properties is down 15%


                             Dec-09 vs. Dec-11                                                                                                                       Dec-09 vs. Dec-11
     Dec-09             Dec-11                Change                       %                                                                    Dec-09              Dec-11            Change              %
      331                201                   -130                      -39%                                                                     33                  28                -5              -15%


MLS: ACTRIS        Period:    2 years (monthly)           Price:   All                        Construction Type:    All             Bedrooms:       All         Bathrooms:      All     Lot Size: All
Property Types:    Residential: (House, Condo, Townhouse, Half Duplex, Modular)                                                                                                         Sq Ft:    All
MLS Areas:         1B


Clarus MarketMetrics®                                                                                      1 of 2                                                                                        01/04/2012
                                                  Information not guaranteed. © 2009-2010 Terradatum and its suppliers and licensors (www.terradatum.com/about/licensors.td).


                                 www.TaylorRealEstateAustin.com                 |   Direct: 512.796.4447        |   Fax: 512.628.7720           |    2525 Wallingwood Bldg. 7C Austin, TX 78746
                                                                                                                                                    15 of 20
Blake Taylor                                                                                                                                                              Taylor Real Estate
                                                                   Supply & Demand by Month
              Dec-09 vs. Dec-11: The number of for sale properties is down 39% and the number of sold properties is down 15%

                        # Properties              Average DOM                    # Properties                Average DOM
Time Period                 For Sale                   For Sale                         Sold                         Sold
Dec-11                          201                            119                           28                          77
Nov-11                          246                            109                           22                         133
Oct-11                          256                            111                           29                          58
Sep-11                          269                            116                           39                          74
Aug-11                          303                            112                           53                          76
Jul-11                          321                            104                           37                          68
Jun-11                          318                            100                           53                          87
May-11                          307                            104                           61                          93
Apr-11                          320                             97                           47                          59
Mar-11                          308                            107                           26                         136
Feb-11                          241                            128                           26                         125
Jan-11                          258                            132                           26                          86
Dec-10                          267                            148                           37                         126
Nov-10                          321                            136                           26                          72
Oct-10                          356                            135                           30                         105
Sep-10                          379                            134                           22                          68
Aug-10                          399                            131                           37                          91
Jul-10                          421                            120                           40                          67
Jun-10                          422                            117                           53                          80
May-10                          405                            117                           39                          79
Apr-10                          401                            111                           34                          93
Mar-10                          383                            117                           36                          78
Feb-10                          315                            138                           21                          66
Jan-10                          294                            148                           12                          91
Dec-09                          331                            148                           33                          99


Clarus MarketMetrics®                                                                             2 of 2                                                                             01/04/2012
                                       Information not guaranteed. © 2009-2010 Terradatum and its suppliers and licensors (www.terradatum.com/about/licensors.td).


                        www.TaylorRealEstateAustin.com               |   Direct: 512.796.4447         |    Fax: 512.628.7720       |    2525 Wallingwood Bldg. 7C Austin, TX 78746
                                                                                                                                       16 of 20
Blake Taylor                                                                                                                                                                            Taylor Real Estate
                                                                 The Average Days on Market by Month
                                                              Dec-09 vs. Dec-11: The average days on market is up 27%


                                                                                    Dec-09 vs. Dec-11
                  Dec-09                                               Dec-11                                     Change                                             %
                    86                                                  109                                         23                                              +27%


MLS: ACTRIS       Period:   2 years (monthly)           Price:   All                        Construction Type:    All             Bedrooms:       All         Bathrooms:      All   Lot Size: All
Property Types:   Residential: (House, Condo, Townhouse, Half Duplex, Modular)                                                                                                      Sq Ft:    All
MLS Areas:        1B


Clarus MarketMetrics®                                                                                    1 of 2                                                                                     01/04/2012
                                                Information not guaranteed. © 2009-2010 Terradatum and its suppliers and licensors (www.terradatum.com/about/licensors.td).


                               www.TaylorRealEstateAustin.com                   |   Direct: 512.796.4447      |   Fax: 512.628.7720           |    2525 Wallingwood Bldg. 7C Austin, TX 78746
                                                                                                                                                  17 of 20
Blake Taylor                                                                                                                                                              Taylor Real Estate
                                                      The Average Days on Market by Month
                                                     Dec-09 vs. Dec-11: The average days on market is up 27%


Time Period             Average DOM       # UC Units
Dec-11                          109                 20
Nov-11                           84                 29
Oct-11                          108                 29
Sep-11                           71                 33
Aug-11                           74                 45
Jul-11                           57                 44
Jun-11                           69                 40
May-11                          102                 53
Apr-11                           63                 59
Mar-11                          101                 48
Feb-11                          133                 25
Jan-11                          103                 32
Dec-10                          130                 28
Nov-10                           90                 29
Oct-10                          118                 32
Sep-10                           76                 29
Aug-10                           55                 25
Jul-10                          108                 30
Jun-10                           80                 42
May-10                           72                 44
Apr-10                           73                 54
Mar-10                           89                 34
Feb-10                           82                 33
Jan-10                           70                 19
Dec-09                           86                 18


Clarus MarketMetrics®                                                                           2 of 2                                                                               01/04/2012
                                       Information not guaranteed. © 2009-2010 Terradatum and its suppliers and licensors (www.terradatum.com/about/licensors.td).


                            www.TaylorRealEstateAustin.com          |   Direct: 512.796.4447         |   Fax: 512.628.7720         |    2525 Wallingwood Bldg. 7C Austin, TX 78746
                                                                                                                                       18 of 20
Blake Taylor                                                                                                                                                                            Taylor Real Estate
                                                                            Months Supply of Inventory
                                                 Dec-09 vs. Dec-11: The average months supply of inventory is down 45%


                                                                                    Dec-09 vs. Dec-11
                  Dec-09                                               Dec-11                                     Change                                              %
                   13.4                                                 7.4                                        -6.0                                             -45%


MLS: ACTRIS       Period:   2 years (monthly)           Price:   All                        Construction Type:    All            Bedrooms:       All          Bathrooms:      All   Lot Size: All
Property Types:   Residential: (House, Condo, Townhouse, Half Duplex, Modular)                                                                                                      Sq Ft:    All
MLS Areas:        1B


Clarus MarketMetrics®                                                                                    1 of 2                                                                                     01/04/2012
                                                Information not guaranteed. © 2009-2010 Terradatum and its suppliers and licensors (www.terradatum.com/about/licensors.td).


                               www.TaylorRealEstateAustin.com                   |   Direct: 512.796.4447      |   Fax: 512.628.7720          |    2525 Wallingwood Bldg. 7C Austin, TX 78746
                                                                                                                                                 19 of 20
Blake Taylor                                                                                                                                                                    Taylor Real Estate
                                                                         Months Supply of Inventory
                                              Dec-09 vs. Dec-11: The average months supply of inventory is down 45%

                          # Units For Sale          # UC Units                                   UC Average
Time Period             Last Day of Month         During Month                      MSI                DOM
Dec-11                      149                                 20                   7.5                   109
Nov-11                      180                                 29                   6.2                       84
Oct-11                      201                                 29                   6.9                   108
Sep-11                      197                                 33                   6.0                       71
Aug-11                      220                                 45                   4.9                       74
Jul-11                      246                                 44                   5.6                       57
Jun-11                      255                                 40                   6.4                       69
May-11                      237                                 53                   4.5                   102
Apr-11                      242                                 59                   4.1                       63
Mar-11                      238                                 48                   5.0                   101
Feb-11                      202                                 25                   8.1                   133
Jan-11                      195                                 32                   6.1                   103
Dec-10                      191                                 28                   6.8                   130
Nov-10                      242                                 29                   8.3                       90
Oct-10                      279                                 32                   8.7                   118
Sep-10                      297                                 29                  10.2                       76
Aug-10                      315                                 25                  12.6                       55
Jul-10                      343                                 30                  11.4                   108
Jun-10                      337                                 42                   8.0                       80
May-10                      335                                 44                   7.6                       72
Apr-10                      322                                 54                   6.0                       73
Mar-10                      306                                 34                   9.0                       89
Feb-10                      255                                 33                   7.7                       82
Jan-10                      235                                 19                  12.4                       70
Dec-09                      242                                 18                  13.4                       86


Clarus MarketMetrics®                                                                                 2 of 2                                                                               01/04/2012
                                             Information not guaranteed. © 2009-2010 Terradatum and its suppliers and licensors (www.terradatum.com/about/licensors.td).


                             www.TaylorRealEstateAustin.com               |   Direct: 512.796.4447         |    Fax: 512.628.7720        |    2525 Wallingwood Bldg. 7C Austin, TX 78746
                                                                                                                                             20 of 20

1 b, old west austin metrics

  • 1.
    Blake Taylor Taylor Real Estate Median Sold Price by Month Dec-09 vs. Dec-11: The median sold price is down 7% Dec-09 vs. Dec-11 Dec-09 Dec-11 Change % 530,000 495,000 -35,000 -7% MLS: ACTRIS Period: 2 years (monthly) Price: All Construction Type: All Bedrooms: All Bathrooms: All Lot Size: All Property Types: Residential: (House, Condo, Townhouse, Half Duplex, Modular) Sq Ft: All MLS Areas: 1B Clarus MarketMetrics® 1 of 2 01/04/2012 Information not guaranteed. © 2009-2010 Terradatum and its suppliers and licensors (www.terradatum.com/about/licensors.td). www.TaylorRealEstateAustin.com | Direct: 512.796.4447 | Fax: 512.628.7720 | 2525 Wallingwood Bldg. 7C Austin, TX 78746 1 of 20
  • 2.
    Blake Taylor Taylor Real Estate Median Sold Price by Month Dec-09 vs. Dec-11: The median sold price is down 7% Time Period Median Price # Units Average DOM Dec-11 495,000 28 77 Nov-11 506,250 22 133 Oct-11 490,000 29 58 Sep-11 480,000 39 74 Aug-11 442,000 53 76 Jul-11 505,100 37 68 Jun-11 525,000 53 87 May-11 456,000 61 93 Apr-11 533,500 47 59 Mar-11 530,000 26 136 Feb-11 434,000 26 125 Jan-11 404,875 26 86 Dec-10 470,000 37 126 Nov-10 454,500 26 72 Oct-10 461,250 30 105 Sep-10 460,750 22 68 Aug-10 565,000 37 91 Jul-10 558,500 40 67 Jun-10 580,000 53 80 May-10 520,000 39 79 Apr-10 436,000 34 93 Mar-10 425,000 36 78 Feb-10 520,000 21 66 Jan-10 380,000 12 91 Dec-09 530,000 33 99 Clarus MarketMetrics® 2 of 2 01/04/2012 Information not guaranteed. © 2009-2010 Terradatum and its suppliers and licensors (www.terradatum.com/about/licensors.td). www.TaylorRealEstateAustin.com | Direct: 512.796.4447 | Fax: 512.628.7720 | 2525 Wallingwood Bldg. 7C Austin, TX 78746 2 of 20
  • 3.
    Blake Taylor Taylor Real Estate Median For Sale vs. Median Sold Dec-09 vs. Dec-11: The median price of for sale properties is up 9% and the median price of sold properties is down 7% Dec-09 vs. Dec-11 Dec-09 vs. Dec-11 Dec-09 Dec-11 Change % Dec-09 Dec-11 Change % 587,500 639,000 51,500 +9% 530,000 495,000 -35,000 -7% MLS: ACTRIS Period: 2 years (monthly) Price: All Construction Type: All Bedrooms: All Bathrooms: All Lot Size: All Property Types: Residential: (House, Condo, Townhouse, Half Duplex, Modular) Sq Ft: All MLS Areas: 1B Clarus MarketMetrics® 1 of 2 01/04/2012 Information not guaranteed. © 2009-2010 Terradatum and its suppliers and licensors (www.terradatum.com/about/licensors.td). www.TaylorRealEstateAustin.com | Direct: 512.796.4447 | Fax: 512.628.7720 | 2525 Wallingwood Bldg. 7C Austin, TX 78746 3 of 20
  • 4.
    Blake Taylor Taylor Real Estate Median For Sale vs. Median Sold Dec-09 vs. Dec-11: The median price of for sale properties is up 9% and the median price of sold properties is down 7% For Sale # Properties Sold # Properties Price Time Period Median For Sale Median Sold Difference Dec-11 639,000 201 495,000 28 -144,000 Nov-11 675,000 246 506,250 22 -168,750 Oct-11 657,200 256 490,000 29 -167,200 Sep-11 645,000 269 480,000 39 -165,000 Aug-11 599,999 303 442,000 53 -157,999 Jul-11 595,000 321 505,100 37 -89,900 Jun-11 589,625 318 525,000 53 -64,625 May-11 585,000 307 456,000 61 -129,000 Apr-11 577,000 320 533,500 47 -43,500 Mar-11 550,000 308 530,000 26 -19,999 Feb-11 532,500 241 434,000 26 -98,500 Jan-11 549,000 258 404,875 26 -144,125 Dec-10 530,000 267 470,000 37 -60,000 Nov-10 565,000 321 454,500 26 -110,500 Oct-10 549,000 356 461,250 30 -87,750 Sep-10 545,000 379 460,750 22 -84,250 Aug-10 565,000 399 565,000 37 0 Jul-10 590,000 421 558,500 40 -31,500 Jun-10 595,000 422 580,000 53 -15,000 May-10 595,000 405 520,000 39 -75,000 Apr-10 584,000 401 436,000 34 -148,000 Mar-10 584,000 383 425,000 36 -159,000 Feb-10 569,900 315 520,000 21 -49,900 Jan-10 575,000 294 380,000 12 -195,000 Dec-09 587,500 331 530,000 33 -57,500 Clarus MarketMetrics® 2 of 2 01/04/2012 Information not guaranteed. © 2009-2010 Terradatum and its suppliers and licensors (www.terradatum.com/about/licensors.td). www.TaylorRealEstateAustin.com | Direct: 512.796.4447 | Fax: 512.628.7720 | 2525 Wallingwood Bldg. 7C Austin, TX 78746 4 of 20
  • 5.
    Blake Taylor Taylor Real Estate Sold Properties by Month Dec-09 vs. Dec-11: The number of Sold properties is down 15% Dec-09 vs. Dec-11 Dec-09 Dec-11 Change % 33 28 -5 -15% MLS: ACTRIS Period: 2 years (monthly) Price: All Construction Type: All Bedrooms: All Bathrooms: All Lot Size: All Property Types: Residential: (House, Condo, Townhouse, Half Duplex, Modular) Sq Ft: All MLS Areas: 1B Clarus MarketMetrics® 1 of 2 01/04/2012 Information not guaranteed. © 2009-2010 Terradatum and its suppliers and licensors (www.terradatum.com/about/licensors.td). www.TaylorRealEstateAustin.com | Direct: 512.796.4447 | Fax: 512.628.7720 | 2525 Wallingwood Bldg. 7C Austin, TX 78746 5 of 20
  • 6.
    Blake Taylor Taylor Real Estate Sold Properties by Month Dec-09 vs. Dec-11: The number of Sold properties is down 15% Full Market Bank Properties Non-Bank Properties Time Period # Properties Median Price Average DOM # Properties % Bank Median Price # Properties % Non-Bank Median Price Dec-11 28 495,000 77 1 3.6 1,463,400 27 96.4 475,000 Nov-11 22 506,250 133 0 22 100.0 506,250 Oct-11 29 490,000 58 3 10.3 180,000 26 89.7 504,450 Sep-11 39 480,000 74 1 2.6 385,000 38 97.4 500,000 Aug-11 53 442,000 76 2 3.8 837,500 51 96.2 425,000 Jul-11 37 505,100 68 0 37 100.0 505,100 Jun-11 53 525,000 87 0 53 100.0 525,000 May-11 61 456,000 93 3 4.9 306,900 58 95.1 462,500 Apr-11 47 533,500 59 4 8.5 629,500 43 91.5 533,500 Mar-11 26 530,000 136 0 26 100.0 530,000 Feb-11 26 434,000 125 3 11.5 144,000 23 88.5 500,000 Jan-11 26 404,875 86 6 23.1 173,750 20 76.9 466,650 Dec-10 37 470,000 126 1 2.7 390,000 36 97.3 485,000 Nov-10 26 454,500 72 1 3.9 140,000 25 96.2 460,000 Oct-10 30 461,250 105 0 30 100.0 461,250 Sep-10 22 460,750 68 2 9.1 167,860 20 90.9 465,000 Aug-10 37 565,000 91 2 5.4 274,000 35 94.6 575,000 Jul-10 40 558,500 67 2 5.0 831,950 38 95.0 558,500 Jun-10 53 580,000 80 3 5.7 175,800 50 94.3 594,750 May-10 39 520,000 79 2 5.1 170,000 37 94.9 535,000 Apr-10 34 436,000 93 1 2.9 150,150 33 97.1 439,000 Mar-10 36 425,000 78 8 22.2 158,204 28 77.8 500,000 Feb-10 21 520,000 66 4 19.1 141,000 17 81.0 682,000 Jan-10 12 380,000 91 3 25.0 151,500 9 75.0 428,684 Dec-09 33 530,000 99 2 6.1 146,200 31 93.9 553,500 Clarus MarketMetrics® 2 of 2 01/04/2012 Information not guaranteed. © 2009-2010 Terradatum and its suppliers and licensors (www.terradatum.com/about/licensors.td). www.TaylorRealEstateAustin.com | Direct: 512.796.4447 | Fax: 512.628.7720 | 2525 Wallingwood Bldg. 7C Austin, TX 78746 6 of 20
  • 7.
    Blake Taylor Taylor Real Estate Under Contract Properties by Month Dec-09 vs. Dec-11: The number of Under Contract properties is up 11% Dec-09 vs. Dec-11 Dec-09 Dec-11 Change % 18 20 2 +11% MLS: ACTRIS Period: 2 years (monthly) Price: All Construction Type: All Bedrooms: All Bathrooms: All Lot Size: All Property Types: Residential: (House, Condo, Townhouse, Half Duplex, Modular) Sq Ft: All MLS Areas: 1B Clarus MarketMetrics® 1 of 2 01/04/2012 Information not guaranteed. © 2009-2010 Terradatum and its suppliers and licensors (www.terradatum.com/about/licensors.td). www.TaylorRealEstateAustin.com | Direct: 512.796.4447 | Fax: 512.628.7720 | 2525 Wallingwood Bldg. 7C Austin, TX 78746 7 of 20
  • 8.
    Blake Taylor Taylor Real Estate Under Contract Properties by Month Dec-09 vs. Dec-11: The number of Under Contract properties is up 11% Full Market Bank Properties Non-Bank Properties Time Period # Properties Median Price Average DOM # Properties % Bank Median Price # Properties % Non-Bank Median Price Dec-11 20 474,500 109 4 20.0 361,950 16 80.0 487,000 Nov-11 29 549,000 84 2 6.9 912,000 27 93.1 549,000 Oct-11 29 450,000 108 0 29 100.0 450,000 Sep-11 33 599,000 71 1 3.0 1,549,000 32 97.0 599,000 Aug-11 45 469,000 74 3 6.7 170,000 42 93.3 494,450 Jul-11 44 455,000 57 1 2.3 1,200,000 43 97.7 450,000 Jun-11 40 499,500 69 0 40 100.0 499,500 May-11 53 499,900 102 1 1.9 494,900 52 98.1 512,200 Apr-11 59 524,000 63 1 1.7 442,000 58 98.3 532,000 Mar-11 48 502,950 101 4 8.3 661,700 44 91.7 472,500 Feb-11 25 565,000 133 2 8.0 198,000 23 92.0 600,000 Jan-11 32 567,500 103 3 9.4 146,500 29 90.6 599,000 Dec-10 28 479,942 130 5 17.9 169,000 23 82.1 520,000 Nov-10 29 485,000 90 2 6.9 273,700 27 93.1 524,000 Oct-10 32 472,500 118 1 3.1 154,900 31 96.9 475,000 Sep-10 29 479,000 76 1 3.5 164,900 28 96.5 479,375 Aug-10 25 517,000 55 2 8.0 263,610 23 92.0 629,000 Jul-10 30 567,500 108 0 30 100.0 567,500 Jun-10 42 537,450 80 1 2.4 169,900 41 97.6 545,000 May-10 44 649,950 72 4 9.1 187,000 40 90.9 662,500 Apr-10 54 542,000 73 4 7.4 175,825 50 92.6 570,000 Mar-10 34 482,000 89 0 34 100.0 482,000 Feb-10 33 475,000 82 8 24.2 157,450 25 75.8 575,000 Jan-10 19 525,000 70 4 21.1 132,700 15 79.0 590,000 Dec-09 18 551,250 86 4 22.2 134,900 14 77.8 650,000 Clarus MarketMetrics® 2 of 2 01/04/2012 Information not guaranteed. © 2009-2010 Terradatum and its suppliers and licensors (www.terradatum.com/about/licensors.td). www.TaylorRealEstateAustin.com | Direct: 512.796.4447 | Fax: 512.628.7720 | 2525 Wallingwood Bldg. 7C Austin, TX 78746 8 of 20
  • 9.
    Blake Taylor Taylor Real Estate New Properties by Month Dec-09 vs. Dec-11: The number of New properties is down 48% Dec-09 vs. Dec-11 Dec-09 Dec-11 Change % 40 21 -19 -48% MLS: ACTRIS Period: 2 years (monthly) Price: All Construction Type: All Bedrooms: All Bathrooms: All Lot Size: All Property Types: Residential: (House, Condo, Townhouse, Half Duplex, Modular) Sq Ft: All MLS Areas: 1B Clarus MarketMetrics® 1 of 2 01/04/2012 Information not guaranteed. © 2009-2010 Terradatum and its suppliers and licensors (www.terradatum.com/about/licensors.td). www.TaylorRealEstateAustin.com | Direct: 512.796.4447 | Fax: 512.628.7720 | 2525 Wallingwood Bldg. 7C Austin, TX 78746 9 of 20
  • 10.
    Blake Taylor Taylor Real Estate New Properties by Month Dec-09 vs. Dec-11: The number of New properties is down 48% Full Market Bank Properties Non-Bank Properties Time Period # Properties Median Price # Properties % Bank Median Price # Properties % Non-Bank Median Price Dec-11 21 449,900 2 9.5 366,950 19 90.5 510,000 Nov-11 45 599,999 0 45 100.0 599,999 Oct-11 59 599,900 3 5.1 789,000 56 94.9 594,900 Sep-11 49 599,000 1 2.0 1,549,000 48 98.0 587,000 Aug-11 57 549,000 2 3.5 280,000 55 96.5 549,900 Jul-11 66 525,000 1 1.5 320,000 65 98.5 525,000 Jun-11 81 575,000 2 2.5 343,950 79 97.5 595,000 May-11 65 549,900 1 1.5 1,200,000 64 98.5 549,450 Apr-11 82 584,000 1 1.2 1,199,000 81 98.8 569,000 Mar-11 106 570,000 2 1.9 420,500 104 98.1 582,000 Feb-11 46 569,750 2 4.3 369,950 44 95.7 594,250 Jan-11 67 559,000 3 4.5 319,900 64 95.5 559,000 Dec-10 25 489,000 4 16.0 449,650 21 84.0 489,000 Nov-10 42 577,424 4 9.5 254,450 38 90.5 589,425 Oct-10 59 520,000 3 5.1 245,000 56 94.9 520,000 Sep-10 64 488,500 4 6.2 273,700 60 93.8 511,000 Aug-10 56 428,000 2 3.6 167,060 54 96.4 439,250 Jul-10 84 522,450 4 4.8 342,400 80 95.2 536,950 Jun-10 87 595,000 3 3.5 169,900 84 96.5 599,000 May-10 83 599,000 1 1.2 348,000 82 98.8 607,000 Apr-10 95 535,000 3 3.2 419,900 92 96.8 540,000 Mar-10 128 539,500 4 3.1 184,950 124 96.9 549,250 Feb-10 80 506,950 7 8.8 159,900 73 91.2 595,000 Jan-10 52 655,000 5 9.6 234,900 47 90.4 699,000 Dec-09 40 474,950 3 7.5 248,000 37 92.5 525,000 Clarus MarketMetrics® 2 of 2 01/04/2012 Information not guaranteed. © 2009-2010 Terradatum and its suppliers and licensors (www.terradatum.com/about/licensors.td). www.TaylorRealEstateAustin.com | Direct: 512.796.4447 | Fax: 512.628.7720 | 2525 Wallingwood Bldg. 7C Austin, TX 78746 10 of 20
  • 11.
    Blake Taylor Taylor Real Estate For Sale Properties by Month Dec-09 vs. Dec-11: The number of For Sale properties is down 39% Dec-09 vs. Dec-11 Dec-09 Dec-11 Change % 331 201 -130 -39% MLS: ACTRIS Period: 2 years (monthly) Price: All Construction Type: All Bedrooms: All Bathrooms: All Lot Size: All Property Types: Residential: (House, Condo, Townhouse, Half Duplex, Modular) Sq Ft: All MLS Areas: 1B Clarus MarketMetrics® 1 of 2 01/04/2012 Information not guaranteed. © 2009-2010 Terradatum and its suppliers and licensors (www.terradatum.com/about/licensors.td). www.TaylorRealEstateAustin.com | Direct: 512.796.4447 | Fax: 512.628.7720 | 2525 Wallingwood Bldg. 7C Austin, TX 78746 11 of 20
  • 12.
    Blake Taylor Taylor Real Estate For Sale Properties by Month Dec-09 vs. Dec-11: The number of For Sale properties is down 39% Full Market Bank Properties Non-Bank Properties Time Period # Properties Median Price Average DOM # Properties % Bank Median Price # Properties % Non-Bank Median Price Dec-11 201 639,000 119 8 4.0 404,000 193 96.0 669,000 Nov-11 246 675,000 109 8 3.2 527,500 238 96.8 677,000 Oct-11 256 657,200 111 8 3.1 527,500 248 96.9 666,750 Sep-11 269 645,000 116 6 2.2 527,500 263 97.8 649,000 Aug-11 303 599,999 112 8 2.6 394,500 295 97.4 619,000 Jul-11 321 595,000 104 7 2.2 525,000 314 97.8 598,000 Jun-11 318 589,625 100 7 2.2 525,000 311 97.8 595,000 May-11 307 585,000 104 6 1.9 512,450 301 98.0 589,000 Apr-11 320 577,000 97 6 1.9 468,450 314 98.1 589,250 Mar-11 308 550,000 107 11 3.6 484,900 297 96.4 550,000 Feb-11 241 532,500 128 11 4.6 484,900 230 95.4 549,750 Jan-11 258 549,000 132 15 5.8 319,900 243 94.2 559,000 Dec-10 267 530,000 148 19 7.1 259,000 248 92.9 549,000 Nov-10 321 565,000 136 18 5.6 254,450 303 94.4 569,900 Oct-10 356 549,000 135 15 4.2 248,000 341 95.8 550,000 Sep-10 379 545,000 134 15 4.0 392,500 364 96.0 549,000 Aug-10 399 565,000 131 13 3.3 348,000 386 96.7 572,450 Jul-10 421 590,000 120 12 2.9 449,950 409 97.2 595,000 Jun-10 422 595,000 117 10 2.4 383,950 412 97.6 599,000 May-10 405 595,000 117 11 2.7 348,000 394 97.3 597,000 Apr-10 401 584,000 111 15 3.7 318,500 386 96.3 599,000 Mar-10 383 584,000 117 12 3.1 217,600 371 96.9 599,000 Feb-10 315 569,900 138 20 6.3 185,950 295 93.7 599,900 Jan-10 294 575,000 148 19 6.5 194,000 275 93.5 599,900 Dec-09 331 587,500 148 21 6.3 170,000 310 93.7 599,950 Clarus MarketMetrics® 2 of 2 01/04/2012 Information not guaranteed. © 2009-2010 Terradatum and its suppliers and licensors (www.terradatum.com/about/licensors.td). www.TaylorRealEstateAustin.com | Direct: 512.796.4447 | Fax: 512.628.7720 | 2525 Wallingwood Bldg. 7C Austin, TX 78746 12 of 20
  • 13.
    Blake Taylor Taylor Real Estate Expired Properties by Month Dec-09 vs. Dec-11: The number of Expired properties is down 55% Dec-09 vs. Dec-11 Dec-09 Dec-11 Change % 71 32 -39 -55% MLS: ACTRIS Period: 2 years (monthly) Price: All Construction Type: All Bedrooms: All Bathrooms: All Lot Size: All Property Types: Residential: (House, Condo, Townhouse, Half Duplex, Modular) Sq Ft: All MLS Areas: 1B Clarus MarketMetrics® 1 of 2 01/04/2012 Information not guaranteed. © 2009-2010 Terradatum and its suppliers and licensors (www.terradatum.com/about/licensors.td). www.TaylorRealEstateAustin.com | Direct: 512.796.4447 | Fax: 512.628.7720 | 2525 Wallingwood Bldg. 7C Austin, TX 78746 13 of 20
  • 14.
    Blake Taylor Taylor Real Estate Expired Properties by Month Dec-09 vs. Dec-11: The number of Expired properties is down 55% Full Market Bank Properties Non-Bank Properties Time Period # Properties Median Price Average DOM # Properties % Bank Median Price # Properties % Non-Bank Median Price Dec-11 32 762,500 142 0 32 100.0 762,500 Nov-11 37 795,000 150 0 37 100.0 795,000 Oct-11 26 774,450 151 0 26 100.0 774,450 Sep-11 39 565,000 164 0 39 100.0 565,000 Aug-11 38 700,000 148 0 38 100.0 700,000 Jul-11 31 619,900 132 0 31 100.0 619,900 Jun-11 23 489,000 126 1 4.3 414,400 22 95.7 504,500 May-11 17 699,000 106 0 17 100.0 699,000 Apr-11 19 635,000 157 0 19 100.0 635,000 Mar-11 22 462,200 162 2 9.1 371,950 20 90.9 464,538 Feb-11 14 389,000 77 0 14 100.0 389,000 Jan-11 31 675,000 156 3 9.7 248,000 28 90.3 694,325 Dec-10 48 548,825 153 2 4.2 542,450 46 95.8 548,825 Nov-10 50 737,000 158 1 2.0 649,900 49 98.0 749,000 Oct-10 45 499,000 175 0 45 100.0 499,000 Sep-10 53 519,900 171 2 3.8 564,000 51 96.2 519,900 Aug-10 59 595,000 124 0 59 100.0 595,000 Jul-10 48 574,000 101 1 2.1 419,900 47 97.9 599,000 Jun-10 43 575,000 135 1 2.3 318,500 42 97.7 609,950 May-10 26 429,000 154 0 26 100.0 429,000 Apr-10 25 749,575 135 1 4.0 350,000 24 96.0 754,288 Mar-10 43 635,000 158 0 43 100.0 635,000 Feb-10 27 390,000 153 4 14.8 174,900 23 85.2 488,226 Jan-10 40 575,000 128 2 5.0 204,900 38 95.0 609,500 Dec-09 71 660,000 156 3 4.2 145,900 68 95.8 680,000 Clarus MarketMetrics® 2 of 2 01/04/2012 Information not guaranteed. © 2009-2010 Terradatum and its suppliers and licensors (www.terradatum.com/about/licensors.td). www.TaylorRealEstateAustin.com | Direct: 512.796.4447 | Fax: 512.628.7720 | 2525 Wallingwood Bldg. 7C Austin, TX 78746 14 of 20
  • 15.
    Blake Taylor Taylor Real Estate Supply & Demand by Month Dec-09 vs. Dec-11: The number of for sale properties is down 39% and the number of sold properties is down 15% Dec-09 vs. Dec-11 Dec-09 vs. Dec-11 Dec-09 Dec-11 Change % Dec-09 Dec-11 Change % 331 201 -130 -39% 33 28 -5 -15% MLS: ACTRIS Period: 2 years (monthly) Price: All Construction Type: All Bedrooms: All Bathrooms: All Lot Size: All Property Types: Residential: (House, Condo, Townhouse, Half Duplex, Modular) Sq Ft: All MLS Areas: 1B Clarus MarketMetrics® 1 of 2 01/04/2012 Information not guaranteed. © 2009-2010 Terradatum and its suppliers and licensors (www.terradatum.com/about/licensors.td). www.TaylorRealEstateAustin.com | Direct: 512.796.4447 | Fax: 512.628.7720 | 2525 Wallingwood Bldg. 7C Austin, TX 78746 15 of 20
  • 16.
    Blake Taylor Taylor Real Estate Supply & Demand by Month Dec-09 vs. Dec-11: The number of for sale properties is down 39% and the number of sold properties is down 15% # Properties Average DOM # Properties Average DOM Time Period For Sale For Sale Sold Sold Dec-11 201 119 28 77 Nov-11 246 109 22 133 Oct-11 256 111 29 58 Sep-11 269 116 39 74 Aug-11 303 112 53 76 Jul-11 321 104 37 68 Jun-11 318 100 53 87 May-11 307 104 61 93 Apr-11 320 97 47 59 Mar-11 308 107 26 136 Feb-11 241 128 26 125 Jan-11 258 132 26 86 Dec-10 267 148 37 126 Nov-10 321 136 26 72 Oct-10 356 135 30 105 Sep-10 379 134 22 68 Aug-10 399 131 37 91 Jul-10 421 120 40 67 Jun-10 422 117 53 80 May-10 405 117 39 79 Apr-10 401 111 34 93 Mar-10 383 117 36 78 Feb-10 315 138 21 66 Jan-10 294 148 12 91 Dec-09 331 148 33 99 Clarus MarketMetrics® 2 of 2 01/04/2012 Information not guaranteed. © 2009-2010 Terradatum and its suppliers and licensors (www.terradatum.com/about/licensors.td). www.TaylorRealEstateAustin.com | Direct: 512.796.4447 | Fax: 512.628.7720 | 2525 Wallingwood Bldg. 7C Austin, TX 78746 16 of 20
  • 17.
    Blake Taylor Taylor Real Estate The Average Days on Market by Month Dec-09 vs. Dec-11: The average days on market is up 27% Dec-09 vs. Dec-11 Dec-09 Dec-11 Change % 86 109 23 +27% MLS: ACTRIS Period: 2 years (monthly) Price: All Construction Type: All Bedrooms: All Bathrooms: All Lot Size: All Property Types: Residential: (House, Condo, Townhouse, Half Duplex, Modular) Sq Ft: All MLS Areas: 1B Clarus MarketMetrics® 1 of 2 01/04/2012 Information not guaranteed. © 2009-2010 Terradatum and its suppliers and licensors (www.terradatum.com/about/licensors.td). www.TaylorRealEstateAustin.com | Direct: 512.796.4447 | Fax: 512.628.7720 | 2525 Wallingwood Bldg. 7C Austin, TX 78746 17 of 20
  • 18.
    Blake Taylor Taylor Real Estate The Average Days on Market by Month Dec-09 vs. Dec-11: The average days on market is up 27% Time Period Average DOM # UC Units Dec-11 109 20 Nov-11 84 29 Oct-11 108 29 Sep-11 71 33 Aug-11 74 45 Jul-11 57 44 Jun-11 69 40 May-11 102 53 Apr-11 63 59 Mar-11 101 48 Feb-11 133 25 Jan-11 103 32 Dec-10 130 28 Nov-10 90 29 Oct-10 118 32 Sep-10 76 29 Aug-10 55 25 Jul-10 108 30 Jun-10 80 42 May-10 72 44 Apr-10 73 54 Mar-10 89 34 Feb-10 82 33 Jan-10 70 19 Dec-09 86 18 Clarus MarketMetrics® 2 of 2 01/04/2012 Information not guaranteed. © 2009-2010 Terradatum and its suppliers and licensors (www.terradatum.com/about/licensors.td). www.TaylorRealEstateAustin.com | Direct: 512.796.4447 | Fax: 512.628.7720 | 2525 Wallingwood Bldg. 7C Austin, TX 78746 18 of 20
  • 19.
    Blake Taylor Taylor Real Estate Months Supply of Inventory Dec-09 vs. Dec-11: The average months supply of inventory is down 45% Dec-09 vs. Dec-11 Dec-09 Dec-11 Change % 13.4 7.4 -6.0 -45% MLS: ACTRIS Period: 2 years (monthly) Price: All Construction Type: All Bedrooms: All Bathrooms: All Lot Size: All Property Types: Residential: (House, Condo, Townhouse, Half Duplex, Modular) Sq Ft: All MLS Areas: 1B Clarus MarketMetrics® 1 of 2 01/04/2012 Information not guaranteed. © 2009-2010 Terradatum and its suppliers and licensors (www.terradatum.com/about/licensors.td). www.TaylorRealEstateAustin.com | Direct: 512.796.4447 | Fax: 512.628.7720 | 2525 Wallingwood Bldg. 7C Austin, TX 78746 19 of 20
  • 20.
    Blake Taylor Taylor Real Estate Months Supply of Inventory Dec-09 vs. Dec-11: The average months supply of inventory is down 45% # Units For Sale # UC Units UC Average Time Period Last Day of Month During Month MSI DOM Dec-11 149 20 7.5 109 Nov-11 180 29 6.2 84 Oct-11 201 29 6.9 108 Sep-11 197 33 6.0 71 Aug-11 220 45 4.9 74 Jul-11 246 44 5.6 57 Jun-11 255 40 6.4 69 May-11 237 53 4.5 102 Apr-11 242 59 4.1 63 Mar-11 238 48 5.0 101 Feb-11 202 25 8.1 133 Jan-11 195 32 6.1 103 Dec-10 191 28 6.8 130 Nov-10 242 29 8.3 90 Oct-10 279 32 8.7 118 Sep-10 297 29 10.2 76 Aug-10 315 25 12.6 55 Jul-10 343 30 11.4 108 Jun-10 337 42 8.0 80 May-10 335 44 7.6 72 Apr-10 322 54 6.0 73 Mar-10 306 34 9.0 89 Feb-10 255 33 7.7 82 Jan-10 235 19 12.4 70 Dec-09 242 18 13.4 86 Clarus MarketMetrics® 2 of 2 01/04/2012 Information not guaranteed. © 2009-2010 Terradatum and its suppliers and licensors (www.terradatum.com/about/licensors.td). www.TaylorRealEstateAustin.com | Direct: 512.796.4447 | Fax: 512.628.7720 | 2525 Wallingwood Bldg. 7C Austin, TX 78746 20 of 20