Download to read offline
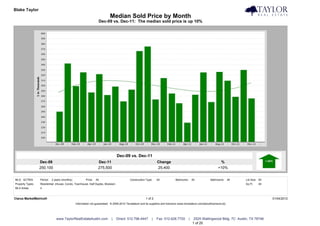
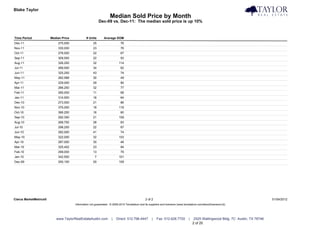
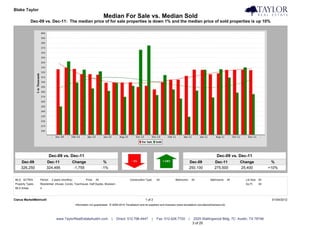
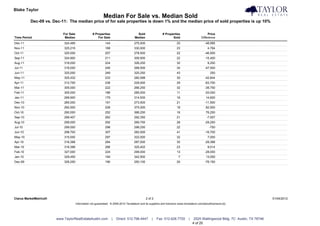
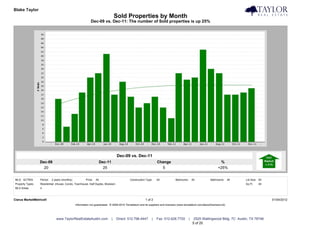
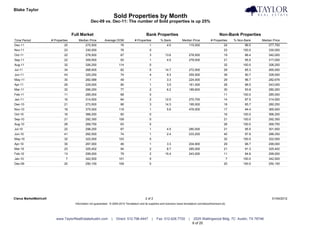

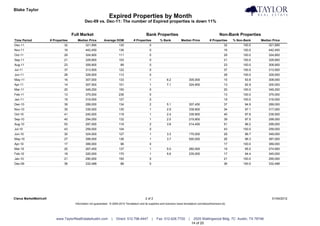


- The median sold price of homes increased 10% from December 2009 to December 2011, rising from $250,100 to $275,500. - The median price of for-sale properties decreased 1% over the same period, while the median price of sold properties rose 10%. - The number of sold homes increased 25% from December 2009 to December 2011, with 20 homes sold in 2009 and 25 sold in 2011.


