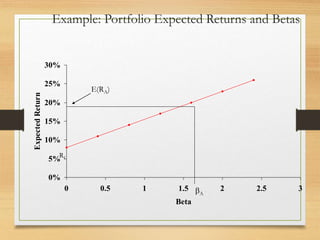
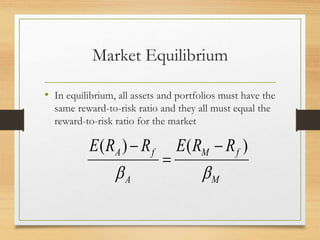
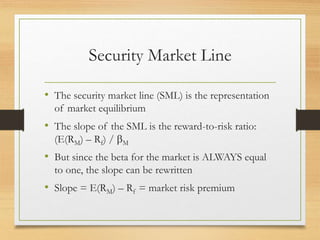
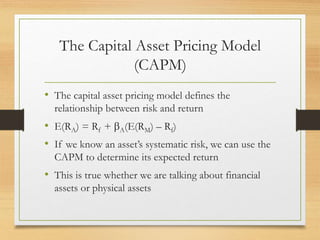
Chapter 3 – Risk and
Return I
Outline
• Portfolios
• Announcements, Surprises, and Expected
Returns
• Risk: Systematic and Unsystematic
• Diversification and Portfolio Risk
• Systematic Risk and Beta
• The Security Market Line
Portfolios
• A portfolio is a collection of assets
• An asset’s risk and return is important in how it
affects the risk and return of the portfolio
• The risk-return trade-off for a portfolio is measured
by the portfolio expected return and standard
deviation, just as with individual assets
Expected versus Unexpected
Returns
• Realized returns are generally not equal to expected
returns
• There is the expected component and the
unexpected component
• At any point in time, the unexpected return can be either
positive or negative
• Over time, the average of the unexpected component is
zero
Announcements and News
• Announcements and news contain both an expected
component and a surprise component
• It is the surprise component that affects a stock’s
price and therefore its return
• This is very obvious when we watch how stock prices
move when an unexpected announcement is made or
earnings are different than anticipated
Efficient Markets
• Efficient markets are a result of investors trading on
the unexpected portion of announcements
• The easier it is to trade on surprises, the more
efficient markets should be
• Efficient markets involve random price changes
because we cannot predict surprises
Systematic Risk
• Risk factors that affect a large number of assets
• Also known as non-diversifiable risk or market risk
• Includes such things as changes in GDP, inflation,
interest rates, etc.
Unsystematic Risk
• Risk factors that affect a limited number of assets
• Also known as unique risk and asset-specific risk
• Includes such things as labor strikes, part shortages,
etc.
Diversification
• Portfolio diversification is the investment in several
different asset classes or sectors
• Diversification is not just holding a lot of assets
• Diversification can reduce the variability of returns
without a reduction in expected returns
• This reduction in risk arises if worse than expected returns
from one asset are offset by better than expected returns from
another
• The risk that cannot be diversified away is called
systematic risk
Diversifiable Risk
• The risk that can be eliminated by combining assets
into a portfolio
• Often considered the same as unsystematic, unique
or asset-specific risk
• If we hold only one asset, or assets in the same
industry, then we are exposing ourselves to risk that
we could diversify away
Systematic Risk Principle
• There is a reward for bearing risk
• There is not a reward for bearing risk unnecessarily
• The expected return on a risky asset depends only on
that asset’s systematic risk since unsystematic risk can
be diversified away
Measuring Systematic Risk
• We use the beta coefficient to measure systematic
risk
• What does beta tell us?
• A beta of 1 implies the asset has the same systematic risk
as the overall market
• A beta < 1 implies the asset has less systematic risk than
the overall market
• A beta > 1 implies the asset has more systematic risk than
the overall market
Total versus Systematic Risk
• Consider the following information:
Standard Deviation Beta
• Security C 20% 1.25
• Security K 30% 0.95
• Which security has more total risk?
• Which security has more systematic risk?
• Which security should have the higher expected
return?
Example: Portfolio Betas
• Consider the following example
• Security Weight Beta
• DCLK .133 3.69
• KO .2 0.64
• INTC .167 1.64
• KEI .4 1.79
• What is the portfolio beta?
• .133(3.69) + .2(.64) + .167(1.64) + .4(1.79) = 1.61
Beta and the Risk Premium
• Remember that the risk premium = expected return
– risk-free rate
• The higher the beta, the greater the risk premium
should be
• Can we define the relationship between the risk
premium and beta so that we can estimate the
expected return?
• YES!
Example: Portfolio Expected Returns and Betas
0%
5%
10%
15%
20%
25%
30%
0 0.5 1 1.5 2 2.5 3
Beta
Expected
Return
Rf
E(RA)
A
Reward-to-Risk Ratio: Definition and Example
• The reward-to-risk ratio is the slope of the line
illustrated in the previous example
• Slope = (E(RA) – Rf) / (A – 0)
• Reward-to-risk ratio for previous example =
(20 – 8) / (1.6 – 0) = 7.5
• What if an asset has a reward-to-risk ratio of 8
(implying that the asset plots above the line)?
• What if an asset has a reward-to-risk ratio of 7
(implying that the asset plots below the line)?
Market Equilibrium
• In equilibrium, all assets and portfolios must have the
same reward-to-risk ratio and they all must equal the
reward-to-risk ratio for the market
M
f
M
A
f
A R
R
E
R
R
E


)
(
)
( 


Security Market Line
• The security market line (SML) is the representation
of market equilibrium
• The slope of the SML is the reward-to-risk ratio:
(E(RM) – Rf) / M
• But since the beta for the market is ALWAYS equal
to one, the slope can be rewritten
• Slope = E(RM) – Rf = market risk premium
The Capital Asset Pricing Model
(CAPM)
• The capital asset pricing model defines the
relationship between risk and return
• E(RA) = Rf + A(E(RM) – Rf)
• If we know an asset’s systematic risk, we can use the
CAPM to determine its expected return
• This is true whether we are talking about financial
assets or physical assets
Factors Affecting Expected Return
• Pure time value of money – measured by the risk-
free rate
• Reward for bearing systematic risk – measured by the
market risk premium
• Amount of systematic risk – measured by beta

RISK+AND+RETURN+I.ppt

  • 1.
    Chapter 3 –Risk and Return I
  • 2.
    Outline • Portfolios • Announcements,Surprises, and Expected Returns • Risk: Systematic and Unsystematic • Diversification and Portfolio Risk • Systematic Risk and Beta • The Security Market Line
  • 3.
    Portfolios • A portfoliois a collection of assets • An asset’s risk and return is important in how it affects the risk and return of the portfolio • The risk-return trade-off for a portfolio is measured by the portfolio expected return and standard deviation, just as with individual assets
  • 4.
    Expected versus Unexpected Returns •Realized returns are generally not equal to expected returns • There is the expected component and the unexpected component • At any point in time, the unexpected return can be either positive or negative • Over time, the average of the unexpected component is zero
  • 5.
    Announcements and News •Announcements and news contain both an expected component and a surprise component • It is the surprise component that affects a stock’s price and therefore its return • This is very obvious when we watch how stock prices move when an unexpected announcement is made or earnings are different than anticipated
  • 6.
    Efficient Markets • Efficientmarkets are a result of investors trading on the unexpected portion of announcements • The easier it is to trade on surprises, the more efficient markets should be • Efficient markets involve random price changes because we cannot predict surprises
  • 7.
    Systematic Risk • Riskfactors that affect a large number of assets • Also known as non-diversifiable risk or market risk • Includes such things as changes in GDP, inflation, interest rates, etc.
  • 8.
    Unsystematic Risk • Riskfactors that affect a limited number of assets • Also known as unique risk and asset-specific risk • Includes such things as labor strikes, part shortages, etc.
  • 9.
    Diversification • Portfolio diversificationis the investment in several different asset classes or sectors • Diversification is not just holding a lot of assets • Diversification can reduce the variability of returns without a reduction in expected returns • This reduction in risk arises if worse than expected returns from one asset are offset by better than expected returns from another • The risk that cannot be diversified away is called systematic risk
  • 10.
    Diversifiable Risk • Therisk that can be eliminated by combining assets into a portfolio • Often considered the same as unsystematic, unique or asset-specific risk • If we hold only one asset, or assets in the same industry, then we are exposing ourselves to risk that we could diversify away
  • 11.
    Systematic Risk Principle •There is a reward for bearing risk • There is not a reward for bearing risk unnecessarily • The expected return on a risky asset depends only on that asset’s systematic risk since unsystematic risk can be diversified away
  • 12.
    Measuring Systematic Risk •We use the beta coefficient to measure systematic risk • What does beta tell us? • A beta of 1 implies the asset has the same systematic risk as the overall market • A beta < 1 implies the asset has less systematic risk than the overall market • A beta > 1 implies the asset has more systematic risk than the overall market
  • 13.
    Total versus SystematicRisk • Consider the following information: Standard Deviation Beta • Security C 20% 1.25 • Security K 30% 0.95 • Which security has more total risk? • Which security has more systematic risk? • Which security should have the higher expected return?
  • 14.
    Example: Portfolio Betas •Consider the following example • Security Weight Beta • DCLK .133 3.69 • KO .2 0.64 • INTC .167 1.64 • KEI .4 1.79 • What is the portfolio beta? • .133(3.69) + .2(.64) + .167(1.64) + .4(1.79) = 1.61
  • 15.
    Beta and theRisk Premium • Remember that the risk premium = expected return – risk-free rate • The higher the beta, the greater the risk premium should be • Can we define the relationship between the risk premium and beta so that we can estimate the expected return? • YES!
  • 16.
    Example: Portfolio ExpectedReturns and Betas 0% 5% 10% 15% 20% 25% 30% 0 0.5 1 1.5 2 2.5 3 Beta Expected Return Rf E(RA) A
  • 17.
    Reward-to-Risk Ratio: Definitionand Example • The reward-to-risk ratio is the slope of the line illustrated in the previous example • Slope = (E(RA) – Rf) / (A – 0) • Reward-to-risk ratio for previous example = (20 – 8) / (1.6 – 0) = 7.5 • What if an asset has a reward-to-risk ratio of 8 (implying that the asset plots above the line)? • What if an asset has a reward-to-risk ratio of 7 (implying that the asset plots below the line)?
  • 18.
    Market Equilibrium • Inequilibrium, all assets and portfolios must have the same reward-to-risk ratio and they all must equal the reward-to-risk ratio for the market M f M A f A R R E R R E   ) ( ) (   
  • 19.
    Security Market Line •The security market line (SML) is the representation of market equilibrium • The slope of the SML is the reward-to-risk ratio: (E(RM) – Rf) / M • But since the beta for the market is ALWAYS equal to one, the slope can be rewritten • Slope = E(RM) – Rf = market risk premium
  • 20.
    The Capital AssetPricing Model (CAPM) • The capital asset pricing model defines the relationship between risk and return • E(RA) = Rf + A(E(RM) – Rf) • If we know an asset’s systematic risk, we can use the CAPM to determine its expected return • This is true whether we are talking about financial assets or physical assets
  • 21.
    Factors Affecting ExpectedReturn • Pure time value of money – measured by the risk- free rate • Reward for bearing systematic risk – measured by the market risk premium • Amount of systematic risk – measured by beta