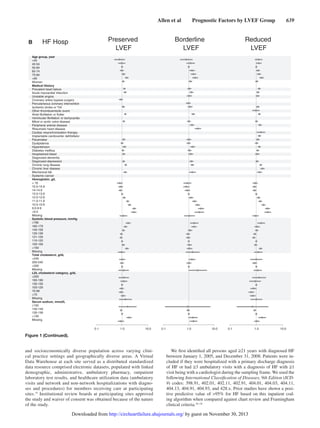
This study analyzed data from over 30,000 patients with heart failure (HF) to identify predictors of adverse outcomes based on left ventricular ejection fraction (LVEF). Patients were categorized as having preserved LVEF (≥50%), borderline LVEF (41-49%), or reduced LVEF (≤40%). Over a median follow up of 1.8 years, 26.8% of patients died, 26.9% were hospitalized for HF, and 67.4% were hospitalized for any reason. Multivariable models found that nearly all tested predictors, such as demographics, medical history, and comorbidities, performed similarly for predicting death and hospitalization across the different LVEF
Effects of aspirin for primary prevention in persons with Diabetes mellitusShadab Ahmad
The ASCEND(A Study od Cardiovascular Events in Diabetes) randomized trial was performed to assess the efficacy and safety of enteric-coated aspirin at a dose of 100 mg daily, as compared with placebo, in person who had diabetes without manifest cardiovascular disease.
Serum Uric Acid and Outcome after Acute Ischemic Stroke: PREMIER StudyErwin Chiquete, MD, PhD
Background: Current evidence shows that uric acid is a potent
antioxidant whose serum concentration increases rapidly
after acute ischemic stroke (AIS). Nevertheless, the relationship
between serum uric acid (SUA) levels and AIS
outcome remains debatable. We aimed to describe the
prognostic significance of SUA in AIS. Methods: We studied
463 patients (52% men, mean age 68 years, 13% with glomerular
filtration rate <60 />2) at 30 days, or with
any outcome measure at 3, 6 or 12 months poststroke. After
adjustment for age, gender, stroke type and severity (NIHSS
<9),><24 h. Conclusions: A low SUA
concentration is modestly associated with a very good
short-term outcome. Our findings support the hypothesis
that SUA is more a marker of the magnitude of the cerebral
infarction than an independent predictor of stroke outcome.
Exercise stress echocardiography in patients with aortic stenosis: impact of baseline diastolic dysfunction and functional capacity on mortality and aortic valve replacement
Authors: Andrew N. Rassi, Wael AlJaroudi, Sahar Naderi, M Chadi Alraies, Venu Menon, Leonardo Rodriguez, Richard Grimm, Brian Griffin, Wael A. Jaber
http://www.thecdt.org/article/view/2855
Coronary heart disease is best addressed by a comprehensive approach aimed at halting atherosclerotic disease and reducing the risk of thrombosis. Unfortunately, our success in optimal risk factor modification in patients with stable CHD remains poor: only 41% of patients achieved all basic goals in the recent ISCHEMIA trial, with success rates likely even lower outside the rigorous clinical trial context. A greater focus on achieving prevention goals in patients with CHD will have a substantial impact on patient outcome and rates of hospitalization and more resources and incentives should be allocated for improved secondary prevention.
The ISCHEMIA trial suggests that even selected, high-risk patients with extensive ischemic burden do not benefit from revascularization barring unacceptable angina despite OMT. As ISCHEMIA excluded patients with unacceptable angina, advanced heart failure, and those with unprotected left main disease, our evaluation may be geared to identify such patients for consideration of revascularization alongside an initial strategy of OMT.
Atherosclerosis is a systemic disease of the arterial circulation, with focal areas of more severe manifestation. From an imaging standpoint, the paradigm of ischemia testing may have come to an end. Recent evidence from COURAGE, PROMISE, SCOT-HEART, and ISCHEMIA has demonstrated that functional testing for inducible myocardial ischemia is inferior to anatomic assessment for risk stratifying and managing patients with suspected or known CHD. Consistent with a large body of evidence, risk from CHD is mediated by the extent of atherosclerotic disease burden and not by the extent of inducible ischemia. Given that 55% of patients had nonobstructive CHD by CT in PROMISE, which was associated with 77% of cardiovascular deaths and myocardial infarctions at follow-up, there is immense opportunity to impact the disease at an earlier stage in a very large population of patients with occult CHD.
Respond on two different days who selected different alterations andmickietanger
Respond on two different days who selected different alterations and factors than you, in one or more of the following ways:
Share insights on how the factor you selected impacts the cardiovascular alteration your colleague selected.
Offer and support an alternative perspective using readings from the classroom or from your own research in the Walden Library.
Validate an idea with your own experience and additional research.
Main Post
The purpose of this paper is to explore coronary artery disease (CAD), the roles of hypertension and dyslipidemia affect CAD, and exploring if genetics is a factor in CAD. The progression of CAD can lead to myocardial ischemia, infarction, and even death if left untreated. Heart disease remains the number one cause of death in the United States, and understanding these factors plays a continued role in developing strategies, both preventive and treatment efforts.
Coronary Artery Disease
CAD is normally the result of atherosclerosis, the build-up of plaque due to damaged endothelium that allows fat to accumulate and decrease the diameter of the vessel. The decrease in vessel size allows for blockage and decreased blood flow to the coronary vessel; this leads to ischemia, where the cells are deprived of blood and begin the process of dying if left untreated. Persistent ischemia or the complete occlusion of a coronary artery causes the acute coronary syndromes, including infarction, or irreversible myocardial damage (Huether & McCance, 2017). Also, known as a heart attack or myocardial infarction (MI). Fortunately, the incidence and mortality statistics for CAD have been decreasing over the past 15 years because of more aggressive recognition, prevention, and treatment (Huether & McCance, 2017).
Hypertension’s Role in Coronary Artery Disease
Hypertension is a consistent elevation of systemic arterial blood pressure (Huether & McCance, 2017). Fortunately, hypertension a key factor in CAD is modifiable and can be monitored closely to prevent further disease progression. Hypertension is common; it ranks as the number one primary diagnosis in America. Pathophysiological mechanisms of blood pressure as a risk factor for CAD are complex and include the influence of blood pressure as a physical force on the development of the atherosclerotic plaque, and the relationship between pulsatile hemodynamics/arterial stiffness and coronary perfusion (Weber et al., 2016). The presence of hypertension further increases the risk of CAD and may explain why some individuals are more predisposed than others to developing coronary events (Rosendorff et al., 2015). Pathophysiological mechanisms of blood pressure as a risk factor for CAD are complex and include the influence of blood pressure as a physical force on the development of the atherosclerotic plaque, and the relationship between pulsatile hemodynamics/arterial stiffness and coronary perfus ...
Copyright 2016 American Medical Association. All rights reserv.docxmelvinjrobinson2199
Copyright 2016 American Medical Association. All rights reserved.
Intensive vs Standard Blood Pressure Control
and Cardiovascular Disease Outcomes in Adults Aged ≥75 Years
A Randomized Clinical Trial
Jeff D. Williamson, MD, MHS; Mark A. Supiano, MD; William B. Applegate, MD, MPH; Dan R. Berlowitz, MD; Ruth C. Campbell, MD, MSPH;
Glenn M. Chertow, MD; Larry J. Fine, MD; William E. Haley, MD; Amret T. Hawfield, MD; Joachim H. Ix, MD, MAS; Dalane W. Kitzman, MD;
John B. Kostis, MD; Marie A. Krousel-Wood, MD; Lenore J. Launer, PhD; Suzanne Oparil, MD; Carlos J. Rodriguez, MD, MPH;
Christianne L. Roumie, MD, MPH; Ronald I. Shorr, MD, MS; Kaycee M. Sink, MD, MAS; Virginia G. Wadley, PhD; Paul K. Whelton, MD;
Jeffrey Whittle, MD; Nancy F. Woolard; Jackson T. Wright Jr, MD, PhD; Nicholas M. Pajewski, PhD; for the SPRINT Research Group
IMPORTANCE The appropriate treatment target for systolic blood pressure (SBP) in older
patients with hypertension remains uncertain.
OBJECTIVE To evaluate the effects of intensive (<120 mm Hg) compared with standard
(<140 mm Hg) SBP targets in persons aged 75 years or older with hypertension
but without diabetes.
DESIGN, SETTING, AND PARTICIPANTS A multicenter, randomized clinical trial of patients aged
75 years or older who participated in the Systolic Blood Pressure Intervention Trial (SPRINT).
Recruitment began on October 20, 2010, and follow-up ended on August 20, 2015.
INTERVENTIONS Participants were randomized to an SBP target of less than 120 mm Hg
(intensive treatment group, n = 1317) or an SBP target of less than 140 mm Hg (standard
treatment group, n = 1319).
MAIN OUTCOMES AND MEASURES The primary cardiovascular disease outcome was a
composite of nonfatal myocardial infarction, acute coronary syndrome not resulting in a
myocardial infarction, nonfatal stroke, nonfatal acute decompensated heart failure, and death
from cardiovascular causes. All-cause mortality was a secondary outcome.
RESULTS Among 2636 participants (mean age, 79.9 years; 37.9% women), 2510 (95.2%)
provided complete follow-up data. At a median follow-up of 3.14 years, there was a
significantly lower rate of the primary composite outcome (102 events in the intensive
treatment group vs 148 events in the standard treatment group; hazard ratio [HR], 0.66
[95% CI, 0.51-0.85]) and all-cause mortality (73 deaths vs 107 deaths, respectively; HR, 0.67
[95% CI, 0.49-0.91]). The overall rate of serious adverse events was not different between
treatment groups (48.4% in the intensive treatment group vs 48.3% in the standard
treatment group; HR, 0.99 [95% CI, 0.89-1.11]). Absolute rates of hypotension were 2.4% in
the intensive treatment group vs 1.4% in the standard treatment group (HR, 1.71 [95% CI,
0.97-3.09]), 3.0% vs 2.4%, respectively, for syncope (HR, 1.23 [95% CI, 0.76-2.00]), 4.0% vs
2.7% for electrolyte abnormalities (HR, 1.51 [95% CI, 0.99-2.33]), 5.5% vs 4.0% for acute
kidney injury (HR, 1.41 [95% CI, 0.98-2.04]), and 4.9% vs 5.5% for inj.
Copyright 2016 American Medical Association. All rights reserv.docxbobbywlane695641
Copyright 2016 American Medical Association. All rights reserved.
Intensive vs Standard Blood Pressure Control
and Cardiovascular Disease Outcomes in Adults Aged ≥75 Years
A Randomized Clinical Trial
Jeff D. Williamson, MD, MHS; Mark A. Supiano, MD; William B. Applegate, MD, MPH; Dan R. Berlowitz, MD; Ruth C. Campbell, MD, MSPH;
Glenn M. Chertow, MD; Larry J. Fine, MD; William E. Haley, MD; Amret T. Hawfield, MD; Joachim H. Ix, MD, MAS; Dalane W. Kitzman, MD;
John B. Kostis, MD; Marie A. Krousel-Wood, MD; Lenore J. Launer, PhD; Suzanne Oparil, MD; Carlos J. Rodriguez, MD, MPH;
Christianne L. Roumie, MD, MPH; Ronald I. Shorr, MD, MS; Kaycee M. Sink, MD, MAS; Virginia G. Wadley, PhD; Paul K. Whelton, MD;
Jeffrey Whittle, MD; Nancy F. Woolard; Jackson T. Wright Jr, MD, PhD; Nicholas M. Pajewski, PhD; for the SPRINT Research Group
IMPORTANCE The appropriate treatment target for systolic blood pressure (SBP) in older
patients with hypertension remains uncertain.
OBJECTIVE To evaluate the effects of intensive (<120 mm Hg) compared with standard
(<140 mm Hg) SBP targets in persons aged 75 years or older with hypertension
but without diabetes.
DESIGN, SETTING, AND PARTICIPANTS A multicenter, randomized clinical trial of patients aged
75 years or older who participated in the Systolic Blood Pressure Intervention Trial (SPRINT).
Recruitment began on October 20, 2010, and follow-up ended on August 20, 2015.
INTERVENTIONS Participants were randomized to an SBP target of less than 120 mm Hg
(intensive treatment group, n = 1317) or an SBP target of less than 140 mm Hg (standard
treatment group, n = 1319).
MAIN OUTCOMES AND MEASURES The primary cardiovascular disease outcome was a
composite of nonfatal myocardial infarction, acute coronary syndrome not resulting in a
myocardial infarction, nonfatal stroke, nonfatal acute decompensated heart failure, and death
from cardiovascular causes. All-cause mortality was a secondary outcome.
RESULTS Among 2636 participants (mean age, 79.9 years; 37.9% women), 2510 (95.2%)
provided complete follow-up data. At a median follow-up of 3.14 years, there was a
significantly lower rate of the primary composite outcome (102 events in the intensive
treatment group vs 148 events in the standard treatment group; hazard ratio [HR], 0.66
[95% CI, 0.51-0.85]) and all-cause mortality (73 deaths vs 107 deaths, respectively; HR, 0.67
[95% CI, 0.49-0.91]). The overall rate of serious adverse events was not different between
treatment groups (48.4% in the intensive treatment group vs 48.3% in the standard
treatment group; HR, 0.99 [95% CI, 0.89-1.11]). Absolute rates of hypotension were 2.4% in
the intensive treatment group vs 1.4% in the standard treatment group (HR, 1.71 [95% CI,
0.97-3.09]), 3.0% vs 2.4%, respectively, for syncope (HR, 1.23 [95% CI, 0.76-2.00]), 4.0% vs
2.7% for electrolyte abnormalities (HR, 1.51 [95% CI, 0.99-2.33]), 5.5% vs 4.0% for acute
kidney injury (HR, 1.41 [95% CI, 0.98-2.04]), and 4.9% vs 5.5% for inj.
Managing CV risk in Inflammatory Arthritis (Focusing on Gout)Sidney Erwin Manahan
Presentation made during the 1st Inter-Hospital Rheumatology Fellows' Case Discussion on 9 June 2018 at the Speaker Feliciano Belmonte Auditorium, 7/F East Avenue Medical Center. Presentation highlights the needs to recognize gout as one of the rheumatic conditions that put patients at risk for developing CV disease.
Antibiotic Stewardship by Anushri Srivastava.pptxAnushriSrivastav
Stewardship is the act of taking good care of something.
Antimicrobial stewardship is a coordinated program that promotes the appropriate use of antimicrobials (including antibiotics), improves patient outcomes, reduces microbial resistance, and decreases the spread of infections caused by multidrug-resistant organisms.
WHO launched the Global Antimicrobial Resistance and Use Surveillance System (GLASS) in 2015 to fill knowledge gaps and inform strategies at all levels.
ACCORDING TO apic.org,
Antimicrobial stewardship is a coordinated program that promotes the appropriate use of antimicrobials (including antibiotics), improves patient outcomes, reduces microbial resistance, and decreases the spread of infections caused by multidrug-resistant organisms.
ACCORDING TO pewtrusts.org,
Antibiotic stewardship refers to efforts in doctors’ offices, hospitals, long term care facilities, and other health care settings to ensure that antibiotics are used only when necessary and appropriate
According to WHO,
Antimicrobial stewardship is a systematic approach to educate and support health care professionals to follow evidence-based guidelines for prescribing and administering antimicrobials
In 1996, John McGowan and Dale Gerding first applied the term antimicrobial stewardship, where they suggested a causal association between antimicrobial agent use and resistance. They also focused on the urgency of large-scale controlled trials of antimicrobial-use regulation employing sophisticated epidemiologic methods, molecular typing, and precise resistance mechanism analysis.
Antimicrobial Stewardship(AMS) refers to the optimal selection, dosing, and duration of antimicrobial treatment resulting in the best clinical outcome with minimal side effects to the patients and minimal impact on subsequent resistance.
According to the 2019 report, in the US, more than 2.8 million antibiotic-resistant infections occur each year, and more than 35000 people die. In addition to this, it also mentioned that 223,900 cases of Clostridoides difficile occurred in 2017, of which 12800 people died. The report did not include viruses or parasites
VISION
Being proactive
Supporting optimal animal and human health
Exploring ways to reduce overall use of antimicrobials
Using the drugs that prevent and treat disease by killing microscopic organisms in a responsible way
GOAL
to prevent the generation and spread of antimicrobial resistance (AMR). Doing so will preserve the effectiveness of these drugs in animals and humans for years to come.
being to preserve human and animal health and the effectiveness of antimicrobial medications.
to implement a multidisciplinary approach in assembling a stewardship team to include an infectious disease physician, a clinical pharmacist with infectious diseases training, infection preventionist, and a close collaboration with the staff in the clinical microbiology laboratory
to prevent antimicrobial overuse, misuse and abuse.
to minimize the developme
Struggling with intense fears that disrupt your life? At Renew Life Hypnosis, we offer specialized hypnosis to overcome fear. Phobias are exaggerated fears, often stemming from past traumas or learned behaviors. Hypnotherapy addresses these deep-seated fears by accessing the subconscious mind, helping you change your reactions to phobic triggers. Our expert therapists guide you into a state of deep relaxation, allowing you to transform your responses and reduce anxiety. Experience increased confidence and freedom from phobias with our personalized approach. Ready to live a fear-free life? Visit us at Renew Life Hypnosis..
How many patients does case series should have In comparison to case reports.pdfpubrica101
Pubrica’s team of researchers and writers create scientific and medical research articles, which may be important resources for authors and practitioners. Pubrica medical writers assist you in creating and revising the introduction by alerting the reader to gaps in the chosen study subject. Our professionals understand the order in which the hypothesis topic is followed by the broad subject, the issue, and the backdrop.
https://pubrica.com/academy/case-study-or-series/how-many-patients-does-case-series-should-have-in-comparison-to-case-reports/
Welcome to Secret Tantric, London’s finest VIP Massage agency. Since we first opened our doors, we have provided the ultimate erotic massage experience to innumerable clients, each one searching for the very best sensual massage in London. We come by this reputation honestly with a dynamic team of the city’s most beautiful masseuses.
R3 Stem Cells and Kidney Repair A New Horizon in Nephrology.pptxR3 Stem Cell
R3 Stem Cells and Kidney Repair: A New Horizon in Nephrology" explores groundbreaking advancements in the use of R3 stem cells for kidney disease treatment. This insightful piece delves into the potential of these cells to regenerate damaged kidney tissue, offering new hope for patients and reshaping the future of nephrology.
The dimensions of healthcare quality refer to various attributes or aspects that define the standard of healthcare services. These dimensions are used to evaluate, measure, and improve the quality of care provided to patients. A comprehensive understanding of these dimensions ensures that healthcare systems can address various aspects of patient care effectively and holistically. Dimensions of Healthcare Quality and Performance of care include the following; Appropriateness, Availability, Competence, Continuity, Effectiveness, Efficiency, Efficacy, Prevention, Respect and Care, Safety as well as Timeliness.
Navigating Challenges: Mental Health, Legislation, and the Prison System in B...Guillermo Rivera
This conference will delve into the intricate intersections between mental health, legal frameworks, and the prison system in Bolivia. It aims to provide a comprehensive overview of the current challenges faced by mental health professionals working within the legislative and correctional landscapes. Topics of discussion will include the prevalence and impact of mental health issues among the incarcerated population, the effectiveness of existing mental health policies and legislation, and potential reforms to enhance the mental health support system within prisons.
4. Allen et al Prognostic Factors by LVEF Group 637
preserved nor frankly reduced LVEF (ie, borderline or mildly
reduced LVEF [HF-BREF]). As such, it is unclear under
what circumstances and to what extent we can and should be
grouping HF patients together with varying level of LVEF for
risk assessment, versus considering risk uniquely in different
HF patient populations.
Understanding the relative importance of common predic-
tor variables for important clinical outcomes among different
Table 1. Continued
Characteristics
Overall Cohort
(N=30 094)
Preserved LVEF
(n=14 907)
Borderline LVEF
(n=4862)
Reduced LVEF
(n=10 325)
D Values Reduced
vs Preserved
D Values Reduced
vs Borderline
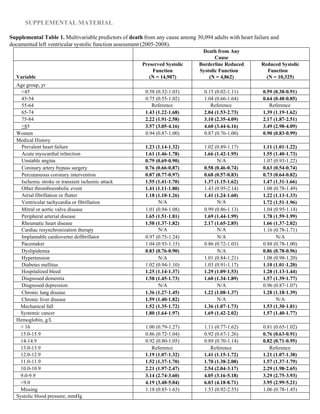
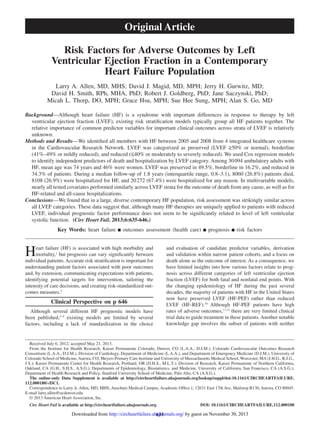
Missing 1861 (6.2) 622 (4.2) 289 (5.9) 950 (9.2)
Systolic blood pressure, mm Hg; mean (SD) 131.1 (19.4) 133.4 (19.9) 131.2 (19.1) 127.7 (18.2)
Systolic blood pressure category, mm Hg; n (%) 0.28 0.19
≥180 689 (2.3) 433 (2.9) 109 (2.2) 147 (1.4)
160–179 1832 (6.1) 1124 (7.5) 291 (6.0) 417 (4.0)
140–159 5217 (17.3) 2906 (19.5) 866 (17.8) 1445 (14.0)
130–139 5646 (18.8) 2943 (19.7) 914 (18.8) 1789 (17.3)
121–129 4496 (14.9) 2238 (15.0) 729 (15.0) 1529 (14.8)
110–120 8275 (27.5) 3564 (23.9) 1363 (28.0) 3348 (32.4)
100–109 1571 (5.2) 679 (4.6) 235 (4.8) 657 (6.4)
<100 904 (3.0) 345 (2.3) 142 (2.9) 417 (4.0)
Missing 1464 (4.9) 675 (4.5) 213 (4.4) 576 (5.6)
HDL cholesterol, g/dL; mean (SD) 47.4 (14.7)
HDL cholesterol category, g/dL; n (%) 0.16 0.05
≥60 4736 (15.7) 2669 (17.9) 691 (14.2) 1376 (13.3)
50–50.9 5153 (17.1) 2676 (18.0) 789 (16.2) 1688 (16.4)
40–49.9 8188 (27.2) 4056 (27.2) 1348 (27.7) 2784 (27.0)
35–39.9 4134 (13.7) 1969 (13.2) 702 (14.4) 1463 (14.2)
<35 4728 (15.7) 2105 (14.1) 873 (18.0) 1750 (17.0)
Missing 3155 (10.5) 1432 (9.6) 459 (9.4) 1264 (12.2)
LDL cholesterol, g/dL; mean (SD) 96.5 (34.2)
LDL cholesterol category, g/dL; n (%) 0.02 0.03
≥200 262 (0.9) 108 (0.7) 50 (1.0) 104 (1.0)
160–199.9 1011 (3.4) 477 (3.2) 165 (3.4) 369 (3.6)
130–159.9 2820 (9.4) 1357 (9.1) 462 (9.5) 1001 (9.7)
100–129.9 6442 (21.4) 3304 (22.2) 1011 (20.8) 2127 (20.6)
70–99.9 10 617 (35.3) 5355 (35.9) 1725 (35.5) 3537 (34.3)
<70 5539 (18.4) 2763 (18.5) 956 (19.7) 1820 (17.6)
Missing 3403 (11.3) 1543 (10.4) 493 (10.1) 1367 (13.2)
Total cholesterol, g/dL; mean (SD) 173.4 (44.2) 173.8 (43.2) 172.5 (45.8) 173.2 (44.9)
Total cholesterol category, g/dL; n (%) 0.04 0.05
>240 1817 (6.0) 876 (5.9) 313 (6.4) 628 (6.1)
200–240 4667 (15.5) 2367 (15.9) 730 (15.0) 1570 (15.2)
<200 20 764 (69.0) 10 378 (69.6) 3418 (70.3) 6968 (67.5)
Missing 2846 (9.5) 1286 (8.6) 401 (8.2) 1159 (11.2)
Serum sodium, mmol/L; mean (SD) 139.7 (3.5) 139.6 (3.6) 139.8 (3.7) 139.7 (3.3)
Serum sodium category, mmol/L; n (%) 0.15 0.07
≥150 16 (0.1) 9 (0.1) 3 (0.1) 4 (0.0)
140–149 15503 (51.5) 7854 (52.7) 2506 (51.5) 5143 (49.8)
130–139 11299 (37.5) 5751 (38.6) 1796 (36.9) 3752 (36.3)
<130 310 (1.0) 195 (1.3) 41 (0.8) 74 (0.7)
Missing 2966 (9.9) 1098 (7.4) 516 (10.6) 1352 (13.1)
HDL indicates high-density lipoprotein; LDL, low-density lipoprotein; and LVEF, left ventricular ejection fraction.
by guest on November 30, 2013http://circheartfailure.ahajournals.org/Downloaded from
5. 638 Circ Heart Fail July 2013
groups of left ventricular systolic function should provide
needed clarity to the field of HF risk prediction. Therefore,
the objective of this study was to model a common set of
demographic and clinical characteristics across categories
of LVEF for predicting death and hospitalization in a large,
multicenter, community-based, contemporary cohort of
adults with HF.
Methods
Patients
The Cardiovascular Research Network served as the source pop-
ulation.13
Participating sites for the current analysis were Kaiser
Permanente Northern California, Kaiser Permanente Colorado,
Kaiser Permanente Northwest, and the Fallon Community
Health Plan.14
Participating sites provide care to an ethnically
DeathA Preserved
LVEF
Borderline
LVEF
Reduced
LVEF
Age group, year
<45
40-54
55-64
65-74
75-84
>85
Women
Medical History
Prevalent heart failure
Acute myocardial infarction
Unstable angina
Coronary artery bypass surgery
Percutaneous coronary intervention
Ischemic stroke or TIA
Other thromboembolic event
Atrial fibrillation or flutter
Ventricular fibrillation or tachycardia
Mitral or aortic valve disease
Peripheral arterial disease
Rheumatic heart disease
Cardiac resynchronization therapy
Implantable cardioverter defribillator
Pacemaker
Dyslipidemia
Hypertension
Diabetes mellitus
Hospitalized bleed
Diagnosed dementia
Diagnosed depression
Chronic lung disease
Chronic liver disease
Mechanical fall
Systemic cancer
Hemoglobin, g/L
> 16
15.0-15.9
14-14.9
13.0-13.9
12.0-12.9
11.0-11.9
10.0-10.9
9.0-9.9
<9.0
Missing
Systolic blood pressure, mmHg
≥180
160-179
140-159
130-139
121-129
110-120
100-109
<100
Missing
Total cholesterol, g/dL
>240
200-240
<200
Missing
LDL cholesterol category, g/dL
>200
160-199
130-159
100-129
70-99
<70
Missing
Serum sodium, mmol/L
≥150
140-149
130-139
<130
Missing
0.1 1.0 10.0 0.1 1.0 10.0 0.1 1.0 10.0
Figure 1. Multivariable predictors of various clinical outcomes among 30 056 adults with heart failure and documented left ventricular
systolic function assessment (2005–2008). A, Death from any cause across left ventricular ejection fraction (LVEF) strata; (B) hospitaliza-
tion for heart failure across LVEF strata; and (C) hospitalization for any cause across LVEF strata. High-density lipoprotein included in
modeling, but not shown in Forest plots; see Material in the online-only Data supplement for full model details. HF indicates heart failure;
LDL, low-density lipoprotein; and TIA, transient ischemic attack.
by guest on November 30, 2013http://circheartfailure.ahajournals.org/Downloaded from
6. Allen et al Prognostic Factors by LVEF Group 639
and socioeconomically diverse population across varying clini-
cal practice settings and geographically diverse areas. A Virtual
Data Warehouse at each site served as a distributed standardized
data resource comprised electronic datasets, populated with linked
demographic, administrative, ambulatory pharmacy, outpatient
laboratory test results, and healthcare utilization data (ambulatory
visits and network and non-network hospitalizations with diagno-
ses and procedures) for members receiving care at participating
sites.15
Institutional review boards at participating sites approved
the study and waiver of consent was obtained because of the nature
of the study.
We first identified all persons aged ≥21 years with diagnosed HF
between January 1, 2005, and December 31, 2008. Patients were in-
cluded if they were hospitalized with a primary discharge diagnosis
of HF or had ≥3 ambulatory visits with a diagnosis of HF with ≥1
visit being with a cardiologist during the sampling frame. We used the
following International Classification of Diseases, 9th Edition (ICD-
9) codes: 398.91, 402.01, 402.11, 402.91, 404.01, 404.03, 404.11,
404.13, 404.91, 404.93, and 428.x. Prior studies have shown a posi-
tive predictive value of >95% for HF based on this inpatient cod-
ing algorithm when compared against chart review and Framingham
clinical criteria.16–18
HF HospB Preserved
LVEF
Borderline
LVEF
Reduced
LVEF
Age group, year
<45
40-54
55-64
65-74
75-84
>85
Women
Medical History
Prevalent heart failure
Acute myocardial infarction
Unstable angina
Coronary artery bypass surgery
Percutaneous coronary intervention
Ischemic stroke or TIA
Other thromboembolic event
Atrial fibrillation or flutter
Ventricular fibrillation or tachycardia
Mitral or aortic valve disease
Peripheral arterial disease
Rheumatic heart disease
Cardiac resynchronization therapy
Implantable cardioverter defribillator
Pacemaker
Dyslipidemia
Hypertension
Diabetes mellitus
Hospitalized bleed
Diagnosed dementia
Diagnosed depression
Chronic lung disease
Chronic liver disease
Mechanical fall
Systemic cancer
Hemoglobin, g/L
> 16
15.0-15.9
14-14.9
13.0-13.9
12.0-12.9
11.0-11.9
10.0-10.9
9.0-9.9
<9.0
Missing
Systolic blood pressure, mmHg
≥180
160-179
140-159
130-139
121-129
110-120
100-109
<100
Missing
Total cholesterol, g/dL
>240
200-240
<200
Missing
LDL cholesterol category, g/dL
>200
160-199
130-159
100-129
70-99
<70
Missing
Serum sodium, mmol/L
≥150
140-149
130-139
<130
Missing
0.1 1.0 10.00.1 1.0 10.0 0.1 1.0 10.0
Figure 1 (Continued).
by guest on November 30, 2013http://circheartfailure.ahajournals.org/Downloaded from
7. 640 Circ Heart Fail July 2013
Covariates
Assessments of left ventricular systolic function were ascertained for
each HF patient from echocardiograms, radionuclide scintigraphy,
other nuclear imaging modalities, and left ventriculography test re-
sults available from site-specific databases complemented by manual
chart review. We defined 3 categories of left ventricular systolic func-
tion: preserved (HF-PEF) as a reported quantitative LVEF ≥50% or
a physician’s qualitative assessment of preserved or normal LVEF;
borderline reduced (HF-BREF) as LVEF 41% to 49% or mildly de-
creased; and reduced (HF-REF) as LVEF ≤40% or moderately or
severely reduced.19
If the quantitative and qualitative assessments
disagreed, the summary qualitative measure was used. The measure
obtained closest to but after the index date of study entry was used.
Patients without a documented LVEF measurement were excluded
from the cohort (n=6998; 18.9%).
Variables included in the respective models were chosen a priori on
the basis of previously published HF prognostic models3–9
and avail-
ability within the virtual data warehouse (VDW). We determined the
presence of coexisting illnesses on the basis of diagnoses or proce-
dures using relevant ICD-9 codes, laboratory results, or filled outpa-
tient prescriptions from health plan databases, as well as site-specific
All-Cause HospC Preserved
LVEF
Borderline
LVEF
Reduced
LVEF
Age group, year
<45
40-54
55-64
65-74
75-84
>85
Women
Medical History
Prevalent heart failure
Acute myocardial infarction
Unstable angina
Coronary artery bypass surgery
Percutaneous coronary intervention
Ischemic stroke or TIA
Other thromboembolic event
Atrial fibrillation or flutter
Ventricular fibrillation or tachycardia
Mitral or aortic valve disease
Peripheral arterial disease
Rheumatic heart disease
Cardiac resynchronization therapy
Implantable cardioverter defribillator
Pacemaker
Dyslipidemia
Hypertension
Diabetes mellitus
Hospitalized bleed
Diagnosed dementia
Diagnosed depression
Chronic lung disease
Chronic liver disease
Mechanical fall
Systemic cancer
Hemoglobin, g/L
> 16
15.0-15.9
14-14.9
13.0-13.9
12.0-12.9
11.0-11.9
10.0-10.9
9.0-9.9
<9.0
Missing
Systolic blood pressure, mmHg
≥180
160-179
140-159
130-139
121-129
110-120
100-109
<100
Missing
Total cholesterol, g/dL
>240
200-240
<200
Missing
LDL cholesterol category, g/dL
>200
160-199
130-159
100-129
70-99
<70
Missing
Serum sodium, mmol/L
≥150
140-149
130-139
<130
Missing
0.1 1.0 10.0 0.1 1.0 10.0 0.1 1.0 10.0
Figure 1 (Continued).
by guest on November 30, 2013http://circheartfailure.ahajournals.org/Downloaded from
8. Allen et al Prognostic Factors by LVEF Group 641
Table 2. Baseline Multivariable Interactions Between Predictors and Documented Left Ventricular Systolic Function Assessment
for Death From Any Cause, Hospitalization For Heart Failure, and Hospitalization for Any Reason Among 30 094 Adults With Heart
Failure (2005–2008)
Variable
Death From Any Cause
Adjusted Hazard Ratio
(95% Confidence Interval);
Reference=Reduced LVEF
Heart Failure Hospitalization
Adjusted Hazard Ratio
(95% Confidence Interval);
Reference=Reduced LVEF
Hospitalization for Any Cause
Adjusted Hazard Ratio
(95% Confidence Interval);
Reference=Reduced LVEF
Preserved
vs Reduced
(n=14 907)
Borderline
vs Reduced
(n=4862)
Preserved
vs Reduced
(n=14 907)
Borderline
vs Reduced
(n=4862)
Preserved
vs Reduced
(n=14 907)
Borderline vs
Reduced (n=4862)
Age group, y P=0.77 P=0.10 P=0.35 P=0.003 P=0.35 P=0.003
<65 1.10 (0.94–1.29) 1.45 (1.16–1.80) 1.29 (1.15–1.44) 1.48 (1.27–1.72) 1.29 (1.16–1.45) 1.48 (1.27–1.72)
>65 1.13 (1.07–1.19) 1.19 (1.11–1.28) 1.21 (1.15–1.28) 1.14 (1.06–1.23) 1.22 (1.15–1.29) 1.14 (1.06–1.23)
Sex P=0.44 P=0.65 P=0.02 P=0.08 P=0.01 P=0.05
Men 1.15 (1.07–1.23) 1.23 (1.13–1.35) 1.30 (1.21–1.39) 1.26 (1.16–1.38) 1.31 (1.22–1.40) 1.27 (1.16–1.38)
Women 1.10 (1.02–1.19) 1.19 (1.07–1.33) 1.15 (1.06–1.24) 1.12 (1.01–1.24) 1.15 (1.07–1.24) 1.11 (1.00–1.23)
Prevalent heart failure P=0.81 P=0.05 P=0.21 P=0.52 P=0.24 P=0.58
Not present at baseline 1.11 (1.01–1.23) 1.09 (0.95–1.24) 1.29 (1.18–1.41) 1.16 (1.03–1.31) 1.29 (1.18–1.41) 1.17 (1.04–1.32)
Present at baseline 1.13 (1.06–1.20) 1.27 (1.17–1.37) 1.20 (1.13–1.28) 1.22 (1.13–1.32) 1.21 (1.14–1.29) 1.22 (1.13–1.32)
Acute myocardial infarction P=0.84 P=0.61 P=0.51 P=0.85 P=0.62 P=0.82
Not present at baseline 1.12 (1.06–1.19) 1.21 (1.12–1.30) 1.24 (1.17–1.31) 1.21 (1.12–1.30) 1.24 (1.17–1.31) 1.21 (1.12–1.30)
Present at baseline 1.14 (1.01–1.29) 1.26 (1.08–1.47) 1.18 (1.04–1.34) 1.19 (1.02–1.38) 1.20 (1.05–1.36) 1.18 (1.02–1.38)
Unstable angina P=0.01 P=0.44 P=0.11 P=0.23 P=0.04 P=0.24
Not present at baseline 1.11 (1.05–1.17) 1.21 (1.12–1.30) 1.21 (1.15–1.28) 1.19 (1.11–1.27) 1.21 (1.15–1.28) 1.19 (1.11–1.27)
Present at baseline 1.44 (1.19–1.74) 1.33 (1.05–1.68) 1.41 (1.18–1.67) 1.37 (1.10–1.70) 1.47 (1.23–1.74) 1.36 (1.10–1.69)
Coronary artery bypass P=0.21 P=0.04 P=0.66 N/A N/A N/A
Not present at baseline 1.12 (1.06–1.18) 1.20 (1.11–1.28) 1.22 (1.16–1.29) N/A N/A N/A
Present at baseline 1.29 (1.03–1.61) 1.65 (1.23–2.22) 1.28 (1.05–1.56) N/A N/A N/A
Percutaneous coronary intervention P=0.88 P=0.41 N/A P=0.50 P=0.89 P=0.50
Not present at baseline 1.13 (1.07–1.19) 1.21 (1.12–1.30) N/A 1.19 (1.11–1.28) 1.23 (1.17–1.30) 1.19 (1.11–1.28)
Present at baseline 1.11 (0.94–1.31) 1.32 (1.07–1.63) N/A 1.28 (1.06–1.53) 1.22 (1.05–1.42) 1.28 (1.06–1.53)
Ischemic stroke or transient ischemic attack P=0.49 P=0.44 P=0.05 P=0.42 P=0.05 P=0.38
Not present at baseline 1.13 (1.07–1.20) 1.23 (1.14–1.32) 1.25 (1.18–1.32) 1.21 (1.13–1.30) 1.25 (1.19–1.32) 1.21 (1.13–1.30)
Present at baseline 1.07 (0.92–1.24) 1.13 (0.92–1.38) 1.05 (0.89–1.24) 1.11 (0.89–1.37) 1.06 (0.90–1.24) 1.10 (0.89–1.36)
Other thromboembolic event P=0.84 P=0.98 P=0.52 P=0.59 P=0.53 P=0.58
Not present at baseline 1.12 (1.07–1.19) 1.22 (1.14–1.31) 1.23 (1.16–1.29) 1.20 (1.12–1.28) 1.23 (1.17–1.30) 1.20 (1.12–1.28)
Present at baseline 1.18 (0.74–1.88) 1.23 (0.67–2.25) 1.45 (0.88–2.38) 1.44 (0.75–2.76) 1.45 (0.88–2.39) 1.45 (0.75–2.77)
Atrial fibrillation or flutter P=0.49 P=0.91 P=0.11 P=0.11 P=0.10 P=0.11
Not present at baseline 1.11 (1.04–1.19) 1.22 (1.12–1.34) 1.27 (1.19–1.35) 1.26 (1.15–1.37) 1.27 (1.19–1.36) 1.25 (1.15–1.36)
Present at baseline 1.15 (1.06–1.24) 1.21 (1.09–1.35) 1.17 (1.08–1.26) 1.12 (1.01–1.25) 1.17 (1.08–1.27) 1.12 (1.01–1.25)
Ventricular tachycardia or fibrillation P=0.43 P=0.83 N/A N/A P=0.96 P=0.79
Not present at baseline 1.12 (1.06–1.18) 1.22 (1.13–1.30) N/A N/A 1.23 (1.17–1.30) 1.21 (1.13–1.29)
Present at baseline 1.26 (0.95–1.68) 1.26 (0.90–1.77) N/A N/A 1.24 (0.92–1.68) 1.15 (0.83–1.59)
Mitral or aortic valve disease P=0.60 P=0.95 P=0.83 P=0.50 P=0.84 P=0.46
Not present at baseline 1.12 (1.05–1.19) 1.22 (1.13–1.32) 1.23 (1.16–1.31) 1.22 (1.13–1.32) 1.24 (1.17–1.31) 1.22 (1.13–1.32)
Present at baseline 1.15 (1.05–1.27) 1.21 (1.07–1.38) 1.22 (1.10–1.34) 1.16 (1.02–1.32) 1.22 (1.11–1.35) 1.15 (1.01–1.31)
Peripheral arterial disease P=0.86 P=0.83 P=0.57 P=0.53 P=0.50 P=0.50
Not present at baseline 1.12 (1.06–1.19) 1.22 (1.13–1.32) 1.22 (1.16–1.29) 1.21 (1.13–1.30) 1.23 (1.16–1.29) 1.21 (1.13–1.30)
Present at baseline 1.14 (0.99–1.31) 1.20 (0.99–1.44) 1.28 (1.10–1.49) 1.14 (0.94–1.38) 1.30 (1.11–1.51) 1.13 (0.93–1.37)
Rheumatic heart disease P=0.35 P=0.08 N/A P=0.05 N/A N/A
Not present at baseline 1.12 (1.06–1.18) 1.23 (1.15–1.32) N/A 1.22 (1.14–1.30) N/A N/A
Present at baseline 1.27 (0.98–1.65) 0.88 (0.62–1.27) N/A 0.78 (0.50–1.20) N/A N/A
(Continued )
by guest on November 30, 2013http://circheartfailure.ahajournals.org/Downloaded from
9. 642 Circ Heart Fail July 2013
Table 2. Continued
Variable
Death From Any Cause
Adjusted Hazard Ratio
(95% Confidence Interval);
Reference=Reduced LVEF
Heart Failure Hospitalization
Adjusted Hazard Ratio
(95% Confidence Interval);
Reference=Reduced LVEF
Hospitalization for Any Cause
Adjusted Hazard Ratio
(95% Confidence Interval);
Reference=Reduced LVEF
Preserved
vs Reduced
(n=14 907)
Borderline
vs Reduced
(n=4862)
Preserved
vs Reduced
(n=14 907)
Borderline
vs Reduced
(n=4862)
Preserved
vs Reduced
(n=14 907)
Borderline vs
Reduced (n=4862)
Cardiac resynchronization therapy P=0.17 P=0.59 P=0.13 P=0.26 P=0.15 P=0.27
Not present at baseline 1.12 (1.07–1.18) 1.22 (1.14–1.30) 1.23 (1.16–1.29) 1.20 (1.12–1.28) 1.23 (1.17–1.30) 1.20 (1.12–1.28)
Present at baseline 2.69 (0.78–9.32) 1.54 (0.65–3.65) 3.88 (0.89–16.90) 2.02 (0.83–4.93) 3.68 (0.84–16.04) 1.98 (0.81–4.84)
Implantable cardioverter defibrillator P=0.19 N/A P=0.38 P=0.38 P=0.31 P=0.39
Not present at baseline 1.12 (1.06–1.18) N/A 1.22 (1.16–1.29) 1.20 (1.12–1.28) 1.23 (1.17–1.29) 1.20 (1.12–1.28)
Present at baseline 1.42 (1.00–2.02) N/A 1.43 (1.01–2.04) 1.41 (0.99–2.00) 1.48 (1.04–2.10) 1.40 (0.99–2.00)
Pacemaker P=0.92 P=0.53 P=0.77 P=0.65 P=0.83 P=0.62
Not present at baseline 1.12 (1.07–1.19) 1.21 (1.13–1.30) 1.22 (1.16–1.29) 1.21 (1.13–1.30) 1.23 (1.17–1.30) 1.21 (1.13–1.30)
Present at baseline 1.13 (0.96–1.34) 1.30 (1.04–1.63) 1.26 (1.06–1.50) 1.15 (0.92–1.43) 1.26 (1.05–1.50) 1.14 (0.92–1.42)
Dyslipidemia P=0.005 P=0.13 P=0.50 P=0.47 P=0.44 P=0.42
Not present at baseline 1.02 (0.93–1.11) 1.12 (0.99–1.27) 1.20 (1.09–1.31) 1.16 (1.02–1.31) 1.20 (1.09–1.31) 1.15 (1.01–1.31)
Present at baseline 1.18 (1.11–1.26) 1.26 (1.16–1.37) 1.24 (1.17–1.32) 1.22 (1.13–1.32) 1.25 (1.17–1.33) 1.22 (1.13–1.32)
Hypertension P <0.001 P=0.66 P=0.99 P=0.67 P=0.95 P=0.67
Not present at baseline 0.92 (0.83–1.03) 1.18 (1.00–1.38) 1.23 (1.09–1.38) 1.24 (1.06–1.45) 1.23 (1.09–1.38) 1.24 (1.06–1.45)
Present at baseline 1.18 (1.12–1.25) 1.23 (1.14–1.32) 1.23 (1.16–1.30) 1.20 (1.11–1.29) 1.23 (1.17–1.31) 1.20 (1.11–1.29)
Diabetes mellitus P=0.22 P=0.57 P=0.16 P=0.13 P=0.19 P=0.11
Not present at baseline 1.11 (1.04–1.17) 1.20 (1.11–1.30) 1.20 (1.13–1.28) 1.17 (1.08–1.26) 1.21 (1.14–1.28) 1.17 (1.08–1.26)
Present at baseline 1.18 (1.07–1.30) 1.26 (1.10–1.43) 1.30 (1.18–1.43) 1.31 (1.15–1.48) 1.30 (1.18–1.43) 1.31 (1.16–1.49)
Hospitalized bleed P=0.40 P=0.59 P=0.62 P=0.87 P=0.78 P=0.85
Not present at baseline 1.13 (1.07–1.20) 1.23 (1.14–1.32) 1.23 (1.17–1.30) 1.21 (1.13–1.29) 1.24 (1.17–1.30) 1.21 (1.13–1.29)
Present at baseline 1.05 (0.90–1.24) 1.15 (0.92–1.43) 1.18 (0.99–1.40) 1.18 (0.94–1.49) 1.20 (1.01–1.44) 1.18 (0.93–1.49)
Diagnosed dementia P=0.50 P=0.67 N/A N/A N/A P=0.24
Not present at baseline 1.12 (1.06–1.18) 1.22 (1.14–1.32) N/A N/A N/A 1.22 (1.14–1.30)
Present at baseline 1.18 (1.02–1.36) 1.17 (0.96–1.43) N/A N/A N/A 1.04 (0.81–1.34)
Diagnosed depression P=0.048 P=0.48 P=0.81 P=0.28 P=0.64 P=0.33
Not present at baseline 1.10 (1.04–1.16) 1.20 (1.12–1.30) 1.22 (1.16–1.30) 1.23 (1.14–1.32) 1.23 (1.16–1.30) 1.22 (1.14–1.32)
Present at baseline 1.25 (1.11–1.40) 1.28 (1.09–1.50) 1.24 (1.11–1.39) 1.12 (0.97–1.30) 1.26 (1.13–1.41) 1.13 (0.98–1.30)
Chronic lung disease P=0.13 P=0.42 P=0.54 P=0.31 P=0.58 P=0.31
Not present at baseline 1.16 (1.09–1.25) 1.19 (1.09–1.30) 1.24 (1.16–1.33) 1.17 (1.07–1.28) 1.25 (1.17–1.33) 1.17 (1.07–1.27)
Not present at baseline 1.08 (1.00–1.16) 1.26 (1.13–1.40) 1.21 (1.12–1.30) 1.25 (1.13–1.39) 1.21 (1.13–1.31) 1.25 (1.13–1.39)
Chronic liver disease P=0.83 N/A P=0.84 P=0.12 N/A N/A
Not present at baseline 1.13 (1.07–1.19) N/A 1.23 (1.16–1.29) 1.19 (1.11–1.27) N/A N/A
Present at baseline 1.10 (0.87–1.39) N/A 1.26 (0.99–1.59) 1.56 (1.12–2.18) N/A N/A
Mechanical fall P=0.455 P=0.99 P=0.19 P=0.21 P=0.21 P=0.17
Not present at baseline 1.13 (1.07–1.19) 1.22 (1.13–1.31) 1.23 (1.17–1.30) 1.21 (1.14–1.30) 1.24 (1.18–1.31) 1.21 (1.14–1.30)
Present at baseline 1.04 (0.85–1.28) 1.22 (0.92–1.62) 1.04 (0.80–1.34) 0.98 (0.71–1.36) 1.05 (0.81–1.35) 0.96 (0.70–1.34)
Systemic cancer P=0.10 P=0.34 N/A N/A N/A P=0.50
Not present at baseline 1.14 (1.08–1.21) 1.23 (1.15–1.32) N/A N/A N/A 1.20 (1.12–1.28)
Present at baseline 0.99 (0.85–1.16) 1.10 (0.89–1.37) N/A N/A N/A 1.30 (1.03–1.65)
Hemoglobin, g/L P=0.04 P=0.55 P=0.03 P=0.003 P=0.04 P=0.002
<13.0 1.18 (1.10–1.26) 1.24 (1.13–1.36) 1.16 (1.08–1.25) 1.09 (0.99–1.19) 1.17 (1.08–1.26) 1.08 (0.98–1.19)
>13.0 or missing 1.07 (0.99–1.15) 1.19 (1.08–1.32) 1.29 (1.20–1.38) 1.32 (1.20–1.45) 1.29 (1.21–1.39) 1.32 (1.21–1.45)
Systolic blood pressure, mm Hg P=0.39 P=0.31 P=0.003 P=0.18 P=0.002 P=0.19
(Continued )
by guest on November 30, 2013http://circheartfailure.ahajournals.org/Downloaded from
10. Allen et al Prognostic Factors by LVEF Group 643
diabetes mellitus and cancer registries. We collected baseline and fol-
low-up data on diagnoses and procedures on the basis of previously
described ICD-9 codes and current procedural terminology procedure
codes.20
We ascertained available ambulatory results for blood pres-
sure, cholesterol measurements, and hemoglobin level on or before
the index hospitalization and during follow-up from health plan am-
bulatory visit and laboratory databases. Some potentially available
factors known to correspond with risk were, nonetheless, excluded
because of technical issues. Covariates notably missing from model
construction included medication use, serum natriuretic peptide lev-
els, and measures of renal function.
Outcomes
Deaths were identified from hospital and billing claims databases,
administrative health plan databases, state death certificate registries,
and Social Security Administration files as available at each site.
These approaches have yielded >97% vital status information in prior
studies.14,17
Hospitalizations were determined from each site’s VDW.
Hospitalizations for HF were identified from each site’s VDW on the
basis of a primary discharge diagnosis for HF using the same inclu-
sion criteria ICD-9 codes described previously.
Statistical Analysis
All analyses were conducted using SAS statistical software, version
9.1 (Cary, NC). We characterized baseline patient demographic and
clinical characteristics stratified by LVEF categories. Continuous
variables were categorized using cut points chosen based on clinical-
ly meaningful values. Missing covariate data for continuous variables
were treated as a separate category. Because of large sample size, in
addition to P values, we also calculated D values from the standard-
ized difference between mean values across LVEF strata to compare
the magnitude of difference between groups. We considered a value
of D>0.1 to signify a meaningful difference.
We constructed multivariable extended Cox regression models
for each outcome stratified by LVEF category. All variables listed in
Table 1 were considered for model inclusion and those with a P value
of ≤0.2 at baseline comparison for each outcome within each LVEF
strata were included in the final regression model. Subjects were cen-
sored at the time they disenrolled from the health plan or reached the
end of study follow-up on December 31, 2008; patients were also
censored at the time of death for hospitalization models. We applied
a robust sandwich estimator to account for clustering of multiple ob-
servations within the same subject and explored whether additional
adjustment for clustering at the site level was necessary.
To assess whether the association of a potential predictor variable dif-
fered based on LVEF category, we calculated interaction model results
for HF-PEF versus HF-REF and separately for HF-BREF versus HF-
REF for each of the 3 outcomes. To maintain simplicity for interpre-
tation, we dichotomized categorical variables at the median value. We
calculated P values and hazard ratios associated with each interaction
(eg, sex×LVEF category) for the outcome of interest. Because of the
systematic nature of the analysis thereby creating multiple comparisons,
we chose to highlight only those interactions with a P value of <0.01
(recognizing that a highly conservative Bonferroni correction for ≈150
tests of interaction would use a P value of 0.0003 for significance).
Results
We identified 30 094 adults with HF. Their mean age was 74
years, and 46% were women (Table 1). Overall, 49.5% of
patients had HF-PEF, 16.2% had HF-BREF, and the remain-
ing 34.3% had HF-REF. There was a high burden of comor-
bidity across all LVEF categories. Median follow-up was 1.8
years (interquartile range, 0.8–3.1). During follow-up, 8060
(26.8%) patients died, 8108 (26.9%) were hospitalized for
HF, and 20 272 (67.4%) were hospitalized for any reason. In
comparison with the study cohort, patients excluded because
of absence of an LVEF measure were older (mean age, 75.6
versus 73.7 years; P<0.001), more often white (78.9% versus
Table 2. Continued
Variable
Death From Any Cause
Adjusted Hazard Ratio
(95% Confidence Interval);
Reference=Reduced LVEF
Heart Failure Hospitalization
Adjusted Hazard Ratio
(95% Confidence Interval);
Reference=Reduced LVEF
Hospitalization for Any Cause
Adjusted Hazard Ratio
(95% Confidence Interval);
Reference=Reduced LVEF
Preserved
vs Reduced
(n=14 907)
Borderline
vs Reduced
(n=4862)
Preserved
vs Reduced
(n=14 907)
Borderline
vs Reduced
(n=4862)
Preserved
vs Reduced
(n=14 907)
Borderline vs
Reduced (n=4862)
≤120 or missing 1.15 (1.07–1.24) 1.27 (1.14–1.40) 1.35 (1.24–1.46) 1.27 (1.15–1.40) 1.35 (1.25–1.46) 1.27 (1.15–1.40)
>120 1.10 (1.03–1.18) 1.18 (1.07–1.29) 1.15 (1.08–1.23) 1.16 (1.06–1.26) 1.16 (1.08–1.24) 1.16 (1.06–1.26)
HDL cholesterol, g/dL P=0.89 P=0.17 P=0.09 P=0.86 P=0.08 P=0.89
<40 or missing 1.12 (1.04–1.21) 1.16 (1.04–1.28) 1.29 (1.19–1.40) 1.21 (1.10–1.34) 1.30 (1.20–1.40) 1.21 (1.10–1.34)
≥40 1.13 (1.06–1.21) 1.27 (1.16–1.40) 1.19 (1.11–1.27) 1.20 (1.10–1.31) 1.19 (1.11–1.27) 1.20 (1.10–1.31)
LDL cholesterol, g/dL P=0.998 P=0.003 P=0.38 P=0.31 P=0.37 P=0.30
<140 or missing 1.13 (1.06–1.19) 1.18 (1.09–1.26) 1.22 (1.15–1.29) 1.19 (1.11–1.28) 1.22 (1.16–1.29) 1.19 (1.11–1.27)
≥140 1.12 (0.97–1.30) 1.67 (1.34–2.09) 1.30 (1.13–1.48) 1.31 (1.10–1.57) 1.31 (1.14–1.49) 1.31 (1.10–1.57)
Total cholesterol, g/dL P=0.68 P=0.15 P=0.73 P=0.42 P=0.66 P=0.45
<200 or missing 1.13 (1.07–1.20) 1.19 (1.11–1.28) 1.22 (1.15–1.29) 1.19 (1.10–1.28) 1.23 (1.16–1.30) 1.19 (1.10–1.28)
≥200 1.10 (0.98–1.24) 1.37 (1.15–1.62) 1.25 (1.12–1.39) 1.27 (1.10–1.47) 1.26 (1.13–1.40) 1.27 (1.09–1.46)
Serum sodium, mmol/L P=0.52 P=0.29 P=0.96 P=0.16 P=0.96 P=0.20
<140 or missing 1.11 (1.03–1.19) 1.26 (1.15–1.39) 1.23 (1.14–1.32) 1.26 (1.15–1.39) 1.23 (1.15–1.33) 1.26 (1.14–1.38)
≥140 1.14 (1.07–1.23) 1.17 (1.07–1.29) 1.23 (1.14–1.31) 1.15 (1.05–1.26) 1.23 (1.15–1.32) 1.16 (1.05–1.27)
Variables were not included if baseline comparison P value was >0.2. HDL indicates high-density lipoprotein; LDL, low-density lipoprotein; LVEF, left ventricular
ejection fraction; and N/A, a variable was not adjusted for in the model.
by guest on November 30, 2013http://circheartfailure.ahajournals.org/Downloaded from
11. 644 Circ Heart Fail July 2013
75.3%; P<0.001), trended toward more often women (47.3%
versus 46.0%; P=0.06), had more prevalent HF (73.0% versus
60.1%; P<0.001), had less myocardial infarction (12.3 versus
13.9%), and generally had more comorbidity, including cere-
brovascular disease (23.0% versus 21.1%; P<0.001), diabetes
mellitus (26.2% versus 24.0%; P<0.001), dementia (10.0%
versus 7.3%; P<0.001), and chronic lung disease (43.3%
versus 41.1%); during follow-up there was no significant dif-
ference between death (27.8% for those without a measure
of LVEF; P=0.08) but had lower rates of HF hospitaliza-
tion (22.6%; P<0.001) and all-cause hospitalization (63.4%;
P<0.001).
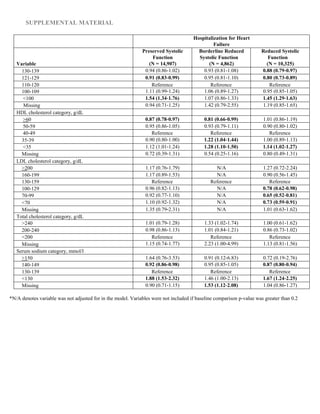
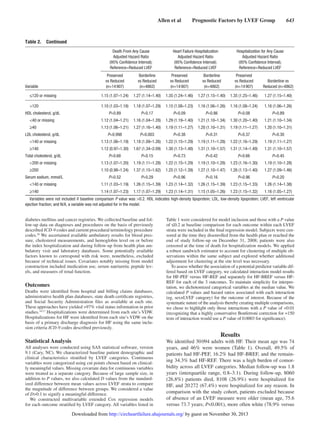
In multivariable Cox models for all-cause death (Figure
[A]), advanced age and severe anemia showed the strongest
association with the outcome across all strata of LVEF (rec-
ognizing that models did not include a measure of renal func-
tion). Only systolic blood pressures <100 mm Hg showed
significant association with increased mortality. Past medical
history factors were either neutral or weakly associated with
death, except for prior coronary revascularization, which was
associated with survival.
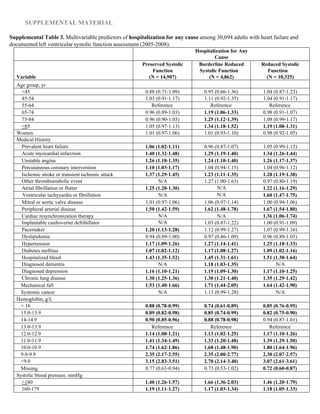
In multivariable models for hospitalization from HF (Figure
[B]), advanced age and anemia continued to be strong predic-
tors of the outcome across all strata of LVEF. Only patients
aged >85 years seemed to have a significantly increased risk
of HF hospitalization. Hypertension, more than hypotension,
was predictive of HF hospitalization. A variety of medical his-
tory carried small increased risk of HF hospitalization; nota-
bly prior coronary revascularization was not associated with
hospitalization from HF.
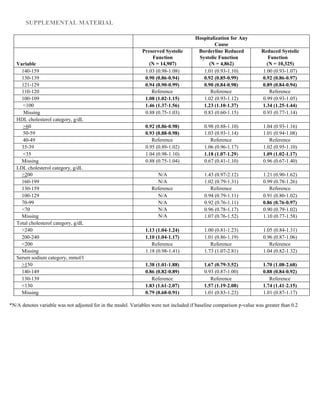
Multivariable models for all-cause hospitalization (Figure
[C]) were quite similar to those for HF hospitalization, despite
the majority of all-cause admissions having a non-HF primary
discharge diagnosis code. Anemia continued to show the
largest adjusted hazards ratios for the outcome. Progressive
hypertension was increasingly predictive of all-cause hospi-
talization; systolic blood pressure <100 mm Hg was also asso-
ciated with an increase in all-cause hospitalization, creating
a U-shaped association for systolic blood pressure overall.
Advanced age was not predictive of all-cause hospitalization,
except for mild associations in the HF-BREF group and at age
≥85 years in the HF-REF group.
We found that multivariable models for each of the 3 out-
comes were highly consistent across HF-PEF, HF-BREF, and
HF-REF patients (Figure 1; complete data included as tables
in the online-only Data Supplement). In simplified interaction
models (Table 2), very few of the risk factors had a signifi-
cant interaction with LVEF for any of the 3 outcomes (using
P value <0.01). For the outcome of all-cause mortality, only a
baseline history of dyslipidemia and hypertension performed
differently by HF-PEF versus HF-REF and only low-density
lipoprotein differed by HF-BREF versus HF-REF. For the
outcome of heart failure hospitalization, only systolic blood
pressure differed by HF-PEF versus HF-REF and only age
differed by HF-BREF versus HF-REF. For the outcome of all-
cause hospitalization, only systolic blood pressure differed by
HF-PEF versus HF-REF and only age and hemoglobin dif-
fered by HF-BREF versus HF-REF.
Discussion
Within a large, contemporary, multicenter cohort of patients
with HF, we found that commonly available risk factors car-
ried surprisingly similar prognostic information for a variety
of outcomes across all LVEF categories. Despite the existence
of a variety of published HF risk models, this systematic
assessment of relative risk factor performance across 3 LVEF
strata for death, HF-related hospitalization, and all-cause hos-
pitalization within a diverse, representative HF population
provides novel HF risk information. For example, the popu-
larized Seattle Heart Failure Model4
was derived and validated
in randomized trial populations of patients with HF-REF. Its
performance has subsequently been tested in a variety of other
cohorts, including patients with a range of LVEF,21,22
but this
piece-meal approach makes comparisons of individual risk
factor performance across different LVEF categories more dif-
ficult. Others have begun to look at the comparative prognostic
performance of single risk factors by LVEF categories, such
as a recent analysis showing that for a given serum B-type
natriuretic peptide level the prognosis is essentially the same
for patients with HF-PEF as those with HF-REF.23
Here, the
analytic approach was specifically designed to provide infor-
mation on comparative risk factor performance across a wide
range of covariates by LVEF categories. We essentially found
that none of the risk factors consistently interacted with LVEF.
Although LVEF dictates responsiveness to certain HF ther-
apies,24
our data demonstrate that common risk factors have
quite similar prognostic performance across major strata of
LVEF. The number of statistically significant differences in
risk factor performance across LVEF strata in our models
was not much different than would have been predicted by
chance alone. We conclude that a parsimonious approach to
HF risk modeling is appropriate in most circumstances, at
least for discrimination among singular end points. This may
have important practical implications for HF risk stratifica-
tion efforts, particularly because LVEF has been difficult to
automatically extract from most electronic medical records
without manual chart review.
Our findings extend those of previous HF risk studies,
particularly into the population of patients with HF-PEF and
HF-BREF. Our results are consistent with several smaller
studies of hospitalized patients with HF-PEF, which have
observed higher risks of hospitalization in patients with diabe-
tes mellitus, depressive symptoms, and anemia.25–27
Potential Limitations
Because of the large sample size, some associations within
individual risk models may be statistically significant but not
clinically meaningful. More important, even with the relative
power of this sample size, we found strikingly few statistically
and even fewer clinically significant differences between risk
models, strengthening the primary conclusion that risk factor
and overall model performance was quite similar within LVEF
strata. Second, insured populations in our participating health
plans may not be fully representative of the general popula-
tion. Nevertheless, the breadth of geographic and demographic
diversity represented across 4 geographically diverse health
plans, as well as the community-based nature of healthcare
by guest on November 30, 2013http://circheartfailure.ahajournals.org/Downloaded from
12. Allen et al Prognostic Factors by LVEF Group 645
delivery, suggests that findings from our cohort are likely to
be highly generalizable to HF patients with any level of LVEF
in real-world practice settings. This is in stark contrast to pre-
viously reported studies focused on highly selected patient
samples enrolled into clinical trials or referral-based tertiary
care academic medical centers. Finally, model construction
did not include an exhaustive list of all previously known risk
factors for adverse outcomes in HF. For example, measures
of renal function, natriuretic peptide levels, and medication
use were absent from the list of independent variables. Unlike
the construction of risk models for clinical use where the goal
is to optimize prognostic performance, the purpose of this
analysis was to compare the relative performance of a variety
of predictor variables across clinically important LVEF cat-
egories for common clinical end points. Although inclusion
of additional predictor variables may have led to quantitative
adjustments in the reported adjusted hazards ratios (eg, degree
of association of anemia in a model with and without a mea-
sure of kidney dysfunction), meaningful relative comparisons
across LVEF strata and clinical outcomes should qualitatively
not be contingent on a single variable. In addition, both natri-
uretic peptide levels and measures of renal function have been
shown to be strongly predictive in both HF-PEF and HF-REF
populations such that their addition to the current analysis
would not be expected to disrupt the overall symmetry seen
with the current list of covariates.23
Conclusion
This study systematically assessed predictor covariate per-
formance across clinically important LVEF strata for relevant
clinical outcomes. We found that in a large contemporary
HF population, despite important therapeutic distinctions
currently dictated by LVEF, risk assessment was strikingly
similar regardless of LVEF. These data suggest that HF risk
models using traditional risk markers can be applied to broad
HF populations.
Acknowledgments
We thank all of the project managers, data programmers, and analysts
for their critical technical contributions and support that made this
study possible.
Sources of Funding
This study was conducted within the Cardiovascular Research
Network sponsored by the National Heart, Lung, and Blood Institute
(NHLBI; U19HL91179-01) and the American Recovery and
Reinvestment Act of 2009 (NHLBI 1RC1HL099395).
Disclosures
Dr Allen is supported by funding from the National Heart, Lung,
and Blood Institute (NHLBI; 1K23HL105896). Dr Saczynski was
supported in part by funding from the National Institute on Aging
(K01AG33643) and the NHLBI (U01HL105268). The other authors
have no conflict to report.
References
1. Go AS, Mozaffarian D, Roger VL, Benjamin EJ, Berry JD, Borden WB,
Bravata DM, Dai S, Ford ES, Fox CS, Franco S, Fullerton HJ, Gillespie
C, Hailpern SM, Heit JA, Howard VJ, Huffman MD, Kissela BM, Kittner
SJ, Lackland DT, Lichtman JH, Lisabeth LD, Magid D, Marcus GM,
Marelli A, Matchar DB, McGuire DK, Mohler ER, Moy CS, Mussolino
ME, Nichol G, Paynter NP, Schreiner PJ, Sorlie PD, Stein J, Turan TN,
Virani SS, Wong ND, Woo D, Turner MB; American Heart Association
Statistics Committee and Stroke Statistics Subcommittee. Heart disease
and stroke statistics–2013 update: a report from the American Heart
Association. Circulation. 2013;127:e6–e245.
2. Hlatky MA, Greenland P,Arnett DK, Ballantyne CM, Criqui MH, Elkind
MS, Go AS, Harrell FE Jr, Hong Y, Howard BV, Howard VJ, Hsue PY,
Kramer CM, McConnell JP, Normand SL, O’Donnell CJ, Smith SC Jr,
Wilson PW; American Heart Association Expert Panel on Subclinical
Atherosclerotic Diseases and Emerging Risk Factors and the Stroke
Council. Criteria for evaluation of novel markers of cardiovascular risk:
a scientific statement from the American Heart Association. Circulation.
2009;119:2408–2416.
3. Lee DS, Austin PC, Rouleau JL, Liu PP, Naimark D, Tu JV. Predicting
mortality among patients hospitalized for heart failure: derivation and
validation of a clinical model. JAMA. 2003;290:2581–2587.
4. Levy WC, Mozaffarian D, Linker DT, Sutradhar SC, Anker SD, Cropp
AB, Anand I, Maggioni A, Burton P, Sullivan MD, Pitt B, Poole-Wilson
PA, Mann DL, Packer M. The Seattle Heart Failure Model: prediction of
survival in heart failure. Circulation. 2006;113:1424–1433.
5. Aaronson KD, Schwartz JS, Chen TM, Wong KL, Goin JE, Mancini
DM. Development and prospective validation of a clinical index to pre-
dict survival in ambulatory patients referred for cardiac transplant evalu-
ation. Circulation. 1997;95:2660–2667.
6. Fonarow GC, Adams KF Jr, Abraham WT, Yancy CW, Boscardin
WJ; ADHERE Scientific Advisory Committee, Study Group, and
Investigators. Risk stratification for in-hospital mortality in acutely de-
compensated heart failure: classification and regression tree analysis.
JAMA. 2005;293:572–580.
7. O’Connor CM, Hasselblad V, Mehta RH, Tasissa G, Califf RM, Fiuzat
M, Rogers JG, Leier CV, Stevenson LW. Triage after hospitalization with
advanced heart failure: the ESCAPE (Evaluation Study of Congestive
Heart Failure and Pulmonary Artery Catheterization Effectiveness) risk
model and discharge score. J Am Coll Cardiol. 2010;55:872–878.
8. Pocock SJ, Wang D, Pfeffer MA, Yusuf S, McMurray JJ, Swedberg KB,
Ostergren J, Michelson EL, Pieper KS, Granger CB. Predictors of mor-
tality and morbidity in patients with chronic heart failure. Eur Heart J.
2006;27:65–75.
9. Komajda M, Carson PE, Hetzel S, McKelvie R, McMurray J, Ptaszynska
A, Zile MR, Demets D, Massie BM. Factors associated with outcome in
heart failure with preserved ejection fraction: findings from the Irbesartan
in Heart Failure with Preserved Ejection Fraction Study (I-PRESERVE).
Circ Heart Fail. 2011;4:27–35.
10. Steinberg BA, Zhao X, Heidenreich PA, Peterson ED, Bhatt DL, Cannon
CP, Hernandez AF, Fonarow GC; Get With the Guidelines Scientific
Advisory Committee and Investigators. Trends in patients hospitalized
with heart failure and preserved left ventricular ejection fraction: preva-
lence, therapies, and outcomes. Circulation. 2012;126:65–75.
11. Owan TE, Hodge DO, Herges RM, Jacobsen SJ, Roger VL, Redfield
MM. Trends in prevalence and outcome of heart failure with preserved
ejection fraction. N Engl J Med. 2006;355:251–259.
12. Bhatia RS, Tu JV, Lee DS, Austin PC, Fang J, Haouzi A, GongY, Liu PP.
Outcome of heart failure with preserved ejection fraction in a population-
based study. N Engl J Med. 2006;355:260–269.
13. GoAS, Magid DJ, Wells B, Sung SH, Cassidy-BushrowAE, Greenlee RT,
Langer RD, Lieu TA, Margolis KL, Masoudi FA, McNeal CJ, Murata GH,
Newton KM, Novotny R, Reynolds K, Roblin DW, Smith DH, Vupputuri
S, White RE, Olson J, Rumsfeld JS, Gurwitz JH. The Cardiovascular
Research Network: a new paradigm for cardiovascular quality and out-
comes research. Circ Cardiovasc Qual Outcomes. 2008;1:138–147.
14. Go AS, Yang J, Gurwitz JH, Hsu J, Lane K, Platt R. Comparative ef-
fectiveness of different beta-adrenergic antagonists on mortality
among adults with heart failure in clinical practice. Arch Intern Med.
2008;168:2415–2421.
15. Magid DJ, Gurwitz JH, Rumsfeld JS, Go AS. Creating a research data
network for cardiovascular disease: the CVRN. Expert Rev Cardiovasc
Ther. 2008;6:1043–1045.
16. Go AS, Lee WY, Yang J, Lo JC, Gurwitz JH. Statin therapy and
risks for death and hospitalization in chronic heart failure. JAMA.
2006;296:2105–2111.
17. GoAS,Yang J,Ackerson LM, Lepper K, Robbins S, Massie BM, Shlipak
MG. Hemoglobin level, chronic kidney disease, and the risks of death
by guest on November 30, 2013http://circheartfailure.ahajournals.org/Downloaded from
13. 646 Circ Heart Fail July 2013
and hospitalization in adults with chronic heart failure: the Anemia in
Chronic Heart Failure: Outcomes and Resource Utilization (ANCHOR)
Study. Circulation. 2006;113:2713–2723.
18. McKee PA, Castelli WP, McNamara PM, Kannel WB. The natural his-
tory of congestive heart failure: the Framingham study. N Engl J Med.
1971;285:1441–1446.
19. Hendel RC, Budoff MJ, Cardella JF, Chambers CE, Dent JM, Fitzgerald
DM, Hodgson JM, Klodas E, Kramer CM, Stillman AE, Tilkemeier PL,
Ward RP, Weigold WG, White RD, Woodard PK; American College of
Cardiology (ACC); American Heart Association (AHA). ACC/AHA/
ACR/ASE/ASNC/HRS/NASCI/RSNA/SAIP/SCAI/SCCT/SCMR/SIR
2008 Key. Data Elements and Definitions for Cardiac Imaging A Report
of the American College of Cardiology/American Heart Association
Task Force on Clinical Data Standards (Writing Committee to Develop
Clinical Data Standards for Cardiac Imaging). J Am Coll Cardiol.
2009;53:91–124.
20. Go AS, Chertow GM, Fan D, McCulloch CE, Hsu CY. Chronic kidney
disease and the risks of death, cardiovascular events, and hospitalization.
N Engl J Med. 2004;351:1296–1305.
21. Kalogeropoulos AP, Georgiopoulou VV, Giamouzis G, Smith AL, Agha
SA, Waheed S, Laskar S, Puskas J, Dunbar S, Vega D, Levy WC, Butler
J. Utility of the Seattle Heart Failure Model in patients with advanced
heart failure. J Am Coll Cardiol. 2009;53:334–342.
22. Gorodeski EZ, Chu EC, Chow CH, Levy WC, Hsich E, Starling RC.
Application of the Seattle Heart Failure Model in ambulatory patients
presented to an advanced heart failure therapeutics committee. Circ
Heart Fail. 2010;3:706–714.
23. van Veldhuisen DJ, Linssen GC, Jaarsma T, van Gilst WH, Hoes AW,
Tijssen JG, Paulus WJ, Voors AA, Hillege HL. B-type natriuretic peptide
and prognosis in heart failure patients with preserved and reduced ejec-
tion fraction. J Am Coll Cardiol. 2013;61:1498–1506.
24. Hunt SA, Abraham WT, Chin MH, Feldman AM, Francis GS, Ganiats
TG, Jessup M, Konstam MA, Mancini DM, Michl K, Oates JA, Rahko
PS, Silver MA, Stevenson LW, Yancy CW. 2009 focused update in-
corporated into the ACC/AHA 2005 Guidelines for the Diagnosis
and Management of Heart Failure in Adults: a report of the American
College of Cardiology Foundation/American Heart Association Task
Force on Practice Guidelines: developed in collaboration with the
International Society for Heart and Lung Transplantation. Circulation.
2009;119:e391–e479.
25. Felker GM, Shaw LK, Stough WG, O’Connor CM.Anemia in patients with
heartfailureandpreservedsystolicfunction.AmHeartJ.2006;151:457–462.
26. Maréchaux S, Six-Carpentier MM, Bouabdallaoui N, Montaigne
D, Bauchart JJ, Mouquet F, Auffray JL, Le Tourneau T, Asseman P,
LeJemtel TH, Ennezat PV. Prognostic importance of comorbidities in
heart failure with preserved left ventricular ejection fraction. Heart
Vessels. 2011;26:313–320.
27. Song EK, Lennie TA, Moser DK. Depressive symptoms increase risk of
rehospitalisation in heart failure patients with preserved systolic func-
tion. J Clin Nurs. 2009;18:1871–1877.
CLINICAL PERSPECTIVE
Heart failure (HF) is generally associated with high morbidity and mortality, but prognosis can vary significantly between
patients. A variety of risk models exist to help risk stratify patients, thereby refining patients’ and families’ expectations for
the future, guiding decisions around aggressiveness of care, and enabling for case mix adjustment in institutional outcome
measures. Although HF is a syndrome with important differences in response to therapy by left ventricular ejection fraction
(LVEF), existing models are typically derived and validated without careful consideration of potential differences in risk
factor performance by LVEF. Therefore, we systematically assessed the relative performance of risk factors across clinically
important LVEF strata for the relevant clinical outcomes of death and hospitalization. We found that in a large contemporary
HF population, risk assessment was strikingly similar regardless of LVEF; we identified no clinically important interactions
between LVEF and a wide range of predictor variables. These data suggest that it is unlikely for LVEF-specific HF risk
models to provide markedly better prognostic information than general HF risk models; a parsimonious approach of HF risk
modeling using traditional risk markers derived from broad HF populations seems reasonable.
by guest on November 30, 2013http://circheartfailure.ahajournals.org/Downloaded from