As IT decision-makerscontinue to navigate new data & analytics solutions,
learn more about their plans in Foundry’s 2022 Data & Analytics Study.
Source: Foundry Data & Analytics Research, 2022
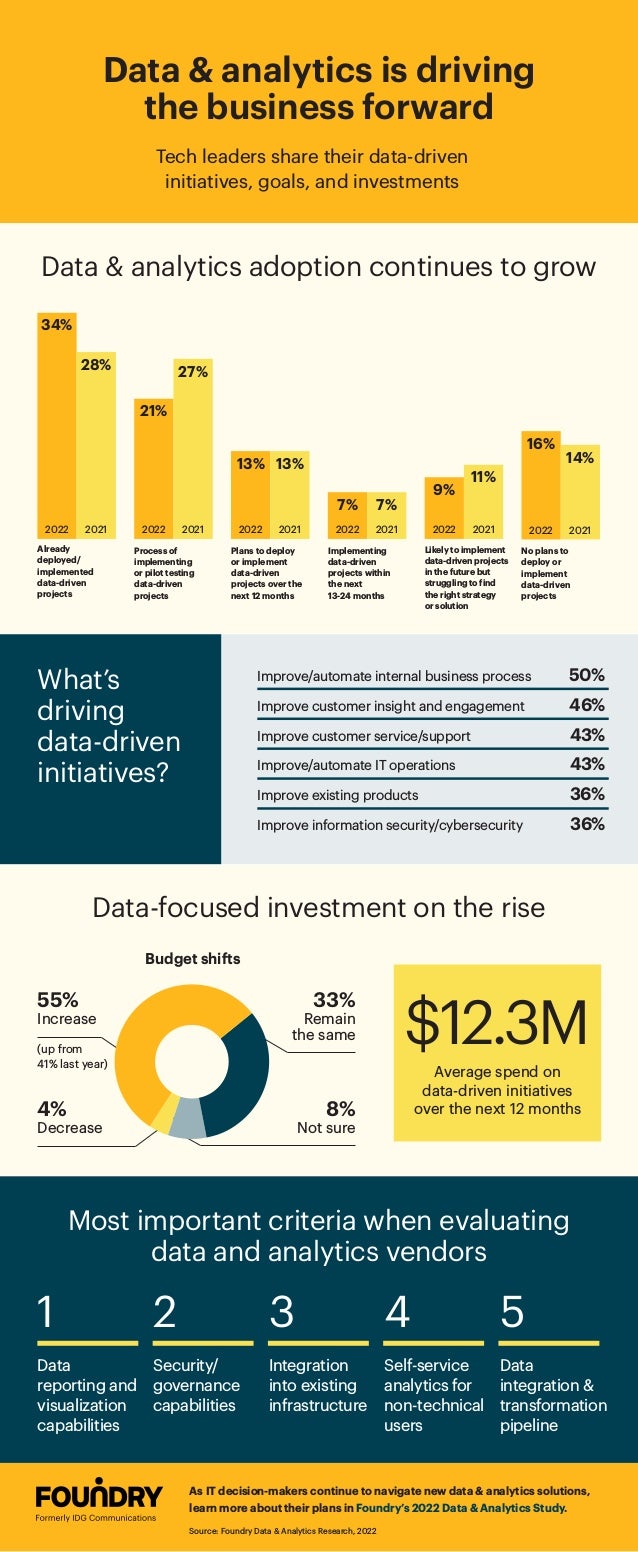
Most important criteria when evaluating
data and analytics vendors
Data
reporting and
visualization
capabilities
1
Self-service
analytics for
non-technical
users
Security/
governance
capabilities
Integration
into existing
infrastructure
Data
integration &
transformation
pipeline
2 3 4 5
Average spend on
data-driven initiatives
over the next 12 months
$12.3M
Data-focused investment on the rise
Budget shifts
55%
Increase
33%
Remain
the same
4%
Decrease
8%
Not sure
(up from
41% last year)
What’s
driving
data-driven
initiatives?
Improve/automate internal business process 50%
Improve customer insight and engagement 46%
Improve customer service/support 43%
Improve/automate IT operations 43%
Improve existing products 36%
Improve information security/cybersecurity 36%
Data & analytics adoption continues to grow
Already
deployed/
implemented
data-driven
projects
34%
28%
2022 2021
Process of
implementing
or pilot testing
data-driven
projects
21%
27%
2022 2021
Plans to deploy
or implement
data-driven
projects over the
next 12 months
13% 13%
2022 2021
Implementing
data-driven
projects within
the next
13-24 months
7% 7%
2022 2021
Likely to implement
data-driven projects
in the future but
struggling to find
the right strategy
or solution
9%
11%
2022 2021
No plans to
deploy or
implement
data-driven
projects
16%
14%
2022 2021
Data & analytics is driving
the business forward
Tech leaders share their data-driven
initiatives, goals, and investments