Download as PDF, PPTX

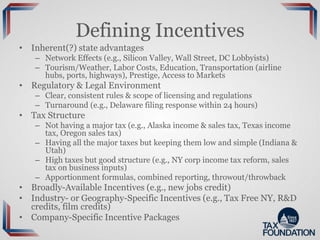
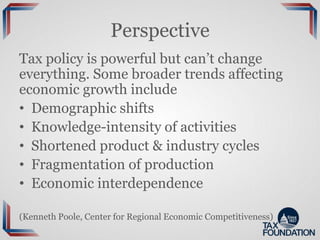
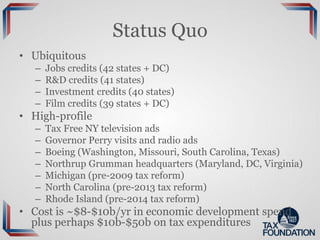


The document discusses various aspects of tax incentives provided by states and their impact on economic growth, emphasizing the importance of clear and consistent tax policies. It outlines the different types of incentives available, their economic implications, and the challenges in measuring their effectiveness. Additionally, it highlights the need for proper evaluation of these incentives to ensure they serve their intended purpose efficiently.


