This document summarizes the results of Carleton College's 2014/2015 Real Food Calculator audit. The Real Food Calculator, developed by the Real Food Challenge, defines "real food" as ecologically sound, humanely raised, community based, or fair. The audit analyzed Bon Appetit's invoices from two months and found that on average, Carleton buys 31% real food. The summary identifies opportunities to increase the real food percentage by switching to cage-free eggs, buying more humane and local meat, and sourcing more chicken from real food suppliers. It concludes by providing contact information for more details on the audit findings.
Summary of the Briefing Note on 'Pesticide Use in Lao PDR: Health and Environmental Impacts', for presentation at Meeting of the Sector Working Group for Agriculture and Rural Development, Vientiane, 28 March 2018
A poster on Carleton's Real Food Calculator Task Force created for the 2015 Association for the Advancement of Sustainability in Higher Education Conference, created by Claire Kelloway
As part of the IFPRI Egypt Seminar in partnership with the National Nutrition Committee: "the 100 million healthy lives initiative: Food availability, access and consumption patterns in Egypt"
School Food Service Budgeting Basics and Direct Certification Reporting Webin...Nevada Agriculture
School Food Service Budgeting Basics and Direct Certification Reporting Webinar by Rose Wolterbeek and Catrina Peters. Budget webinar covers the financial process for National School Lunch Programs. Direct Certification Reporting covers requirements for SY 2014-2015.
Sample DRM for Health Dossier: JasmaniaHFG Project
The Health Finance and Governance (HFG) Project organized a multi-country workshop to support policymakers from public health and finance agencies in developing concrete action plans for mobilizing domestic resources for health. This presentation on a DRM for health dossier demonstrates how countries might utilize available data to hold more productive discussions concerning domestic resource mobilization for health.
Growth rates for organic packaged food have struggled to return to their pre-recession heights and there are those in the industry that in are search of another label that represents natural, healthy and sustainable food. Could national or even regional branding replace the need for an organic label? We look at what the term organic means for consumers around the world and what its potential replacements are.
This presentation on effectiveness of post-harvest loss reduction interventions and trade-offs on GHG emissions. The research also focuses on food loss and waste hotspots. The lead researchers from Wageningen University and Research, who prepared this presentation, are making it available via the Consortium for Innovation in Post-Harvest Loss and Food Waste Reduction slideshare account. Wageningen University and Research is a member of the Consortium.
Hub or not to hub - Alison Blay-Palmer & Philip MountLocal Food
This session will help organizations and communities better understand the Ontario food hub sector as a whole, and the preparation work that is required to plan and implement a successful food hub. For the first time, a survey of food hubs in Ontario has been completed, and results of that survey will be presented. Then, hear a practical example about one hub’s journey from the feasibility stage to the opportunities and challenges in the first two years of operation. The session will conclude with an overview of best practices for planning food hub projects and resources available to support that stage.
Driven by a strengthening economy, restaurant industry sales a.docxjacksnathalie
Driven by a strengthening economy, restaurant industry sales are expected to hit a record high in 2015. According
to the National Restaurant Association’s 2015
Restaurant Industry Forecast, restaurant-and-
foodservice sales are projected to top $709
billion, up 3.8 percent from 2014.
In inflation-adjusted terms, industry sales
are projected to increase 1.5 percent in 2015.
Although 2015 will represent the sixth
consecutive year of real growth in restaurant
sales, the gains remain below what would be
expected during a normal post-recession
period.
The restaurant industry employs 14 million
individuals in one million locations, and
remains the nation’s second largest private
sector employer. The restaurant industry will
outpace total U.S. job growth for the 16th
consecutive year in 2015, keeping the industry
among the economy’s leaders in job creation. In
the next decade, restaurants will add 1.7 million
new positions.
For details, visit Restaurant.org/Forecast.
2015 Restaurant Industry Forecast
EXECUTIVE SUMMARY
SALES & ECONOMIC FORECAST
Adding It All Up: $709.2 billion
Projected restaurant industry sales in 2015
*Eating places include tableservice restaurants
and quickservice restaurants, cafeterias and
buffets, social caterers, and snack and
nonalcoholic beverage bars.
Eating Places*: $471.1 billion
Bars and Taverns: $20.6 billion
Managed Services: $49.5 billion
Lodging Places: $36.7 billion
Retail, Vending, Recreation, Mobile: $70.2 billion
Commercial Restaurant Services $648.0 billion
Noncommercial Restaurant Services $58.5 billion
Military Restaurant Services $2.7 billion
Present
Restaurant Industry’s
Share of the Food Dollar
25%
47%
1955
Restaurant Industry Sales
(In Billions of Current Dollars)
*projected
$709.2
$42.8
$119.6
$239.3
$379.0
$586.7
2015
1970
1980
1990
2000
2010
*
*projected
RESTAURANT INDUSTRY
EMPLOYMENT
2005
2015*
2025*
12.2
million
14.0
million
15.7
million
TABLESERVICE TRENDS
WORKFORCE OUTLOOK & TRENDS
1 Arizona 23.8%
2 Florida 22.4%
3 Texas 22.0%
4 Georgia 21.1%
5 Utah 21.0%
6 North Carolina 20.5%
7 South Carolina 18.6%
8 Alaska 16.1%
9 Colorado 15.7%
10 Alabama 15.3%
11 Arkansas 14.7%
12 Oregon 14.7%
Source: National Restaurant Association
Tableservice Restaurant Segment Sales Growth
Nominal Sales Growth Real (Inflation-adjusted) Sales Growth
Source: National Restaurant Association; *projected
2012 2015*2013 2014
3.4%
0.7%
2.4%
0.1%
2.8%
0.4%
2.9%
0.6%
Tableservice Operators’ Outlook
for Sales and Profitability in 2015
Better Than 2014
About the Same as 2014
Down From 2014
Source: National Restaurant Association, Restaurant
Trends Survey, 2014
Tableservice Sales in 2015
Family Dining Fine DiningCasual Dining
56%
36%
7%
58% 61%
35%
4%
36%
1%
Tableservice Profitability in 2015
Family Dining Fine DiningCasual Dining
48%
39%
12%
46% 45%
56%
7%
33%
10%
Significant
challenge
...
n April 2016, Singapore hosted the first ever Food Vision Asia event. Food Vision Asia focused exclusively on this high growth market and the challenges it faces as increased consumer buying power drives its consumer’s appetite for a diet predicated on ‘world food’ choice and variety.
This seminar was held in partnership with WFP under the title of "Utilizing evidence-based research to inform policy: The Case of School Feeding Programs"
2015 IFIC Food and Health Survey Health Professional Webcast Food Insight
On Wednesday, June 3, from 2 - 3 pm ET, we held the 2015 Food & Health Survey Webcast for Health and Wellness Professionals. Here, you can review all the slides and data we covered. A few of our key questions were:
Do Americans perceptions of their own health match up with reality?
What motivates Americans to lose or maintain weight?
What kind of guidance do Americans want on what to eat?
You can get more information on our consumer research; this survey on food, health, and nutrition; and educational materials at www.foodinsight.org/2015-fhs
The 13th OECD Rural Development Conference was held in Cavan, Ireland on 28-30 September 2022 under the theme "Building Sustainable, Resilient and Thriving
Rural Places".
These are the presentations from the Pre-conference session "Exploring the Opportunities for Rural Development when taking a FoodSystem view on Agricultural Policy".
For more information visit https://www.oecd.org/rural/rural-development-conference/.
Keynote presentation by Delia Grace at the online Food and Agriculture Organization of the United Nations Regional Food Safety Conference for Asia and the Pacific on ‘Communicating food safety in the era of COVID-19: Earning consumers’ trust’, 19 November 2020.
Natural and Organic Foods and Beverages in the U.S., 4th EditionMarketResearch.com
An outline of the Natural and Organic Foods and Beverages in the U.S., 4th Edition report which examines sales and growth potential, identifying key issues and trends that will affect the marketplace through 2019. The report also analyzes and profiles major marketers and retailers, examines marketing and new product trends, and tabulates consumer attitudes and behaviors toward natural/organic foods and beverages and the corresponding retail shopping patterns. Numerous tables, charts, graphs, and illustrations highlight and reinforce key points.
Livestock production and climate change: towards sustainable production with ...ExternalEvents
the Produção Integrada de Sistemas Agropecuários (PISA) System in Brazil, by Paulo César F Carvalho, Professor at Federal University of Rio Grande do Sul
"www.fao.org/about/meetings/sustainable-food-systems-nutrition-symposium
The International Symposium on Sustainable Food Systems for Healthy Diets and Improved Nutrition was jointly held by FAO and WHO in December 2016 to explore policies and programme options for shaping the food systems in ways that deliver foods for a healthy diet, focusing on concrete country experiences and challenges. This Symposium waas the first large-scale contribution under the UN Decade of Action for Nutrition 2016-2025. This presentation was part of Parallel session 1.1: Sustainable agriculture production and diversification for healthy diets"
Livestock production and climate change: towards sustainable production with ...
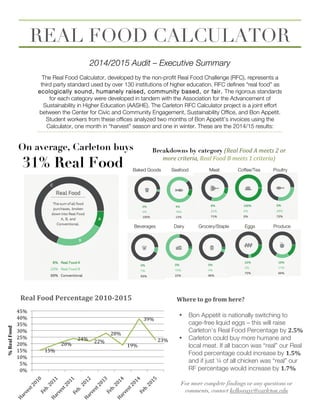
Carleton Real Food Calculator
1. Baked Goods Seafood Meat Coffee/Tea Poultry
Beverages Dairy Grocery/Staple Eggs Produce
15%
20%
24%
22%
28%
19%
39%
23%
0%
5%
10%
15%
20%
25%
30%
35%
40%
45%
%
Real
Food
Real
Food
Percentage
2010-2015
2014/2015 Audit – Executive Summary
The Real Food Calculator, developed by the non-profit Real Food Challenge (RFC), represents a
third party standard used by over 130 institutions of higher education. RFC defines “real food” as
ecologically sound, humanely raised, community based, or fair. The rigorous standards
for each category were developed in tandem with the Association for the Advancement of
Sustainability in Higher Education (AASHE). The Carleton RFC Calculator project is a joint effort
between the Center for Civic and Community Engagement, Sustainability Office, and Bon Appetit.
Student workers from these offices analyzed two months of Bon Appetit’s invoices using the
Calculator, one month in “harvest” season and one in winter. These are the 2014/15 results:
Breakdowns by category
(Real
Food
A
meets
2
or
more
criteria,
Real
Food
B
meets
1
criteria)
On average, Carleton buys
31% Real Food
REAL FOOD CALCULATOR
Where
to
go
from
here?
• Bon Appetit is nationally switching to
cage-free liquid eggs – this will raise
Carleton’s Real Food Percentage by 2.5%
• Carleton could buy more humane and
local meat. If all bacon was “real” our Real
Food percentage could increase by 1.5%
and if just ¼ of all chicken was “real” our
RF percentage would increase by 1.7%
For more complete findings or any questions or
comments, contact kellowayc@carleton.edu