Resume 2016 disney
•
1 like•705 views

Vincent Chan has extensive experience and skills in data science, analytics, finance, and business management. He holds a Master's degree in Chemical Engineering and has worked in engineering, operations management, and business analysis roles for Hewlett Packard and Sulzer Chemtech. Currently he is the Business Planning & Operations Manager for Hewlett Packard Enterprise, where he uses data visualization and modeling to support strategic decision making.

Recommended
More Related Content
Similar to Resume 2016 disney
Similar to Resume 2016 disney (20)
More from Vincent Chan Yuen Mun
Recently uploaded
Recently uploaded (20)
Resume 2016 disney
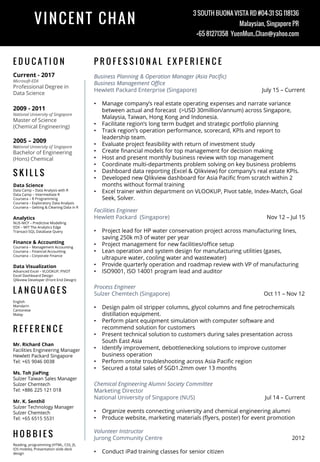
- 1. VINCENT CHAN E D U C A T I O N Current - 2017 Microsoft-EDX Professional Degree in Data Science 2009 - 2011 National University of Singapore Master of Science (Chemical Engineering) 2005 – 2009 National University of Singapore Bachelor of Engineering (Hons) Chemical Data Science Data Camp – Data Analysis with R Data Camp – Intermediate R Coursera – R Programming Coursera – Exploratory Data Analysis Coursera – Getting & Cleaning Data in R Analytics NUS-NICF – Predictive Modelling EDX – MIT The Analytics Edge Transact-SQL Database Query Finance & Accounting Coursera – Management Accounting Coursera – Financial Accounting Coursera – Corporate Finance Data Visualization Advanced Excel – VLOOKUP, PIVOT Excel Dashboard Design Qlikview Developer (Front End Design) 3 SOUTH BUONA VISTA RD #04-31 SG 118136 Malaysian, Singapore PR +65 81271358 YuenMun_Chan@yahoo.com S K I L L S P R O F E S S I O N A L E X P E R I E N C E L A N G U A G E S English Mandarin Cantonese Malay R E F E R E N C E Mr. Richard Chan Facilities Engineering Manager Hewlett Packard Singapore Tel: +65 9046 0038 Ms. Toh JiaPing Sulzer Taiwan Sales Manager Sulzer Chemtech Tel: +886 225 121 018 Mr. K. Senthil Sulzer Technology Manager Sulzer Chemtech Tel: +65 6515 5531 Business Planning & Operation Manager (Asia Pacific) Business Management Office Hewlett Packard Enterprise (Singapore) July 15 – Current • Manage company’s real estate operating expenses and narrate variance between actual and forecast (>USD 30million/annum) across Singapore, Malaysia, Taiwan, Hong Kong and Indonesia. • Facilitate region’s long term budget and strategic portfolio planning • Track region’s operation performance, scorecard, KPIs and report to leadership team. • Evaluate project feasibility with return of investment study • Create financial models for top management for decision making • Host and present monthly business review with top management • Coordinate multi-departments problem solving on key business problems • Dashboard data reporting (Excel & Qlikview) for company’s real estate KPIs. • Developed new Qlikview dashboard for Asia Pacific from scratch within 2 months without formal training • Excel trainer within department on VLOOKUP, Pivot table, Index-Match, Goal Seek, Solver. Facilities Engineer Hewlett Packard (Singapore) Nov 12 – Jul 15 • Project lead for HP water conservation project across manufacturing lines, saving 250k m3 of water per year • Project management for new facilities/office setup • Lean operation and system design for manufacturing utilities (gases, ultrapure water, cooling water and wastewater) • Provide quarterly operation and roadmap review with VP of manufacturing • ISO9001, ISO 14001 program lead and auditor Process Engineer Sulzer Chemtech (Singapore) Oct 11 – Nov 12 • Design palm oil stripper columns, glycol columns and fine petrochemicals distillation equipment. • Perform plant equipment simulation with computer software and recommend solution for customers • Present technical solution to customers during sales presentation across South East Asia • Identify improvement, debottlenecking solutions to improve customer business operation • Perform onsite troubleshooting across Asia Pacific region • Secured a total sales of SGD1.2mm over 13 months Chemical Engineering Alumni Society Committee Marketing Director National University of Singapore (NUS) Jul 14 – Current • Organize events connecting university and chemical engineering alumni • Produce website, marketing materials (flyers, poster) for event promotion Volunteer Instructor Jurong Community Centre 2012 • Conduct iPad training classes for senior citizen H O B B I E S Reading, programming (HTML, CSS, JS, iOS mobile), Presentation slide deck design
- 3. 44% 31% 14% 9% 2% REVENUE BY SEGMENT Media Networks Parks and Resorts Studio Entertainment Consumer Products Interactives UNDERSTANDING THE BUSINESS Parks and Resorts Media Networks Sales from Resorts and Disneyland Admission Tickets Affiliate fees from TV networks Ad Sales VOD (Netflix, Hulu, Amazon)
- 4. 44% 31% 14% 9% 2% REVENUE BY SEGMENT Media Networks Parks and Resorts Studio Entertainment Consumer Products Interactives UNDERSTANDING THE BUSINESS Interactives Consumer Products Studio Entertainment Multi Platform Games Live action and animated motion pictures Live stage play Licensing fee Children books Merchandise
- 5. 44% 31% 14% 9% 2% REVENUE BY SEGMENT Media Networks Parks and Resorts Studio Entertainment Consumer Products Interactives UNDERSTANDING THE BUSINESS While Media Networks account for almost half of company’s revenue, the following areas are to be considered 1. Operating Margin of each segment 2. Segment’s risk 3. Potential room for growth in each segment The Walt Disney Company is not selling products/services. They are selling experience and memories.
- 6. -10% 0% 10% 20% 30% 40% 50% 2013 2014 2015 Operating Margin WHO IS MORE PROFITABLE? Consumer Products Media Network Studio Entertainment Parks & Resorts Interactives While media network brings in the highest revenue, the operating margin will remain relatively constant due to contract lockdown with TV networks. This margin may not continue should the company programming contracts with TV networks are not renewed on favourable terms. Consumer product segment remains lucrative. However the success of this segment is highly dependent on other segments. Media network + Studio entertainment provide exposure for Disney’s characters, which in return drives consumer products sales. Park & resorts create marketplace for the sales as well.
- 7. EXAMPLES OF RISK FACTORS Segment Risk Factors Media Networks Changes in public and consumer tastes may reduce demand for entertainment offering Changes in technology and in consumer consumption patterns. Eg. Digital distribution like Netflix Risk of TV network not renewing contracts at favourable terms Parks & Resorts Recession or economic downturn may reduce discretionary income available for vacation/park visits Studio Entertainment Changes in public and consumer tastes may reduce demand for entertainment offering Consumer Products Intellectual property rights not enforced in certain countries/region Interactives Stiff competition with all forms of entertainments available Difficulties to create smash hits in platform games market The Walt Disney Company Annual Report 2015
- 8. EACH SEGMENT REINFOCES Media Networks Parks and Resorts Studio Entertainment Consumer Products Interactives Opportunity to monetize Disney’s Characters Provides characters to be used in future movies Create desire to interact with Disney’s Characters Create Additional Sales Outlets New movies provide fresh new ideas for park experience New movies/animations accompanied by platform games Interactive consumer products Popular movie’s character to have own’s TV series
- 9. DISNEY’S DIGITAL STRATEGY Improve Customer Experience with Analytics Enhance Operation Efficiency with Data- Driven Approach Interactivity using Digital Tools Across Channels Personalizing Using Connected Products • Forecast waiting time for Disneyland’s attractions • Understand individual guest’s past preferences to determine vacation packages • Manage labor resources with analytics • MyMagic+ Initiatives to customize visitor’s experience at Disneyland • In-store application for guests to customize their shopping experience in Disney store. Capgemini Consulting Report: Disney Making Magic Through Digital Innovation
- 10. WHAT’S AHEAD? Augmented / Virtual Reality The push for immersive virtual experience with Disney from anywhere. Data Analytics To customize personal experience for each individual with targeted advertising. Physical – Virtual Platform Games Virtual games that involves interacting with the physical world. Data-Driven Decision Making Using data to forecast demand, reduce cost and optimize operations efficiencies. Data is the new asset and source of competitive advantage to create new experience