Download to read offline


![The effect of size and effectiveness of
government on potential GDP
7
GDP convergence model like Barro (2015)
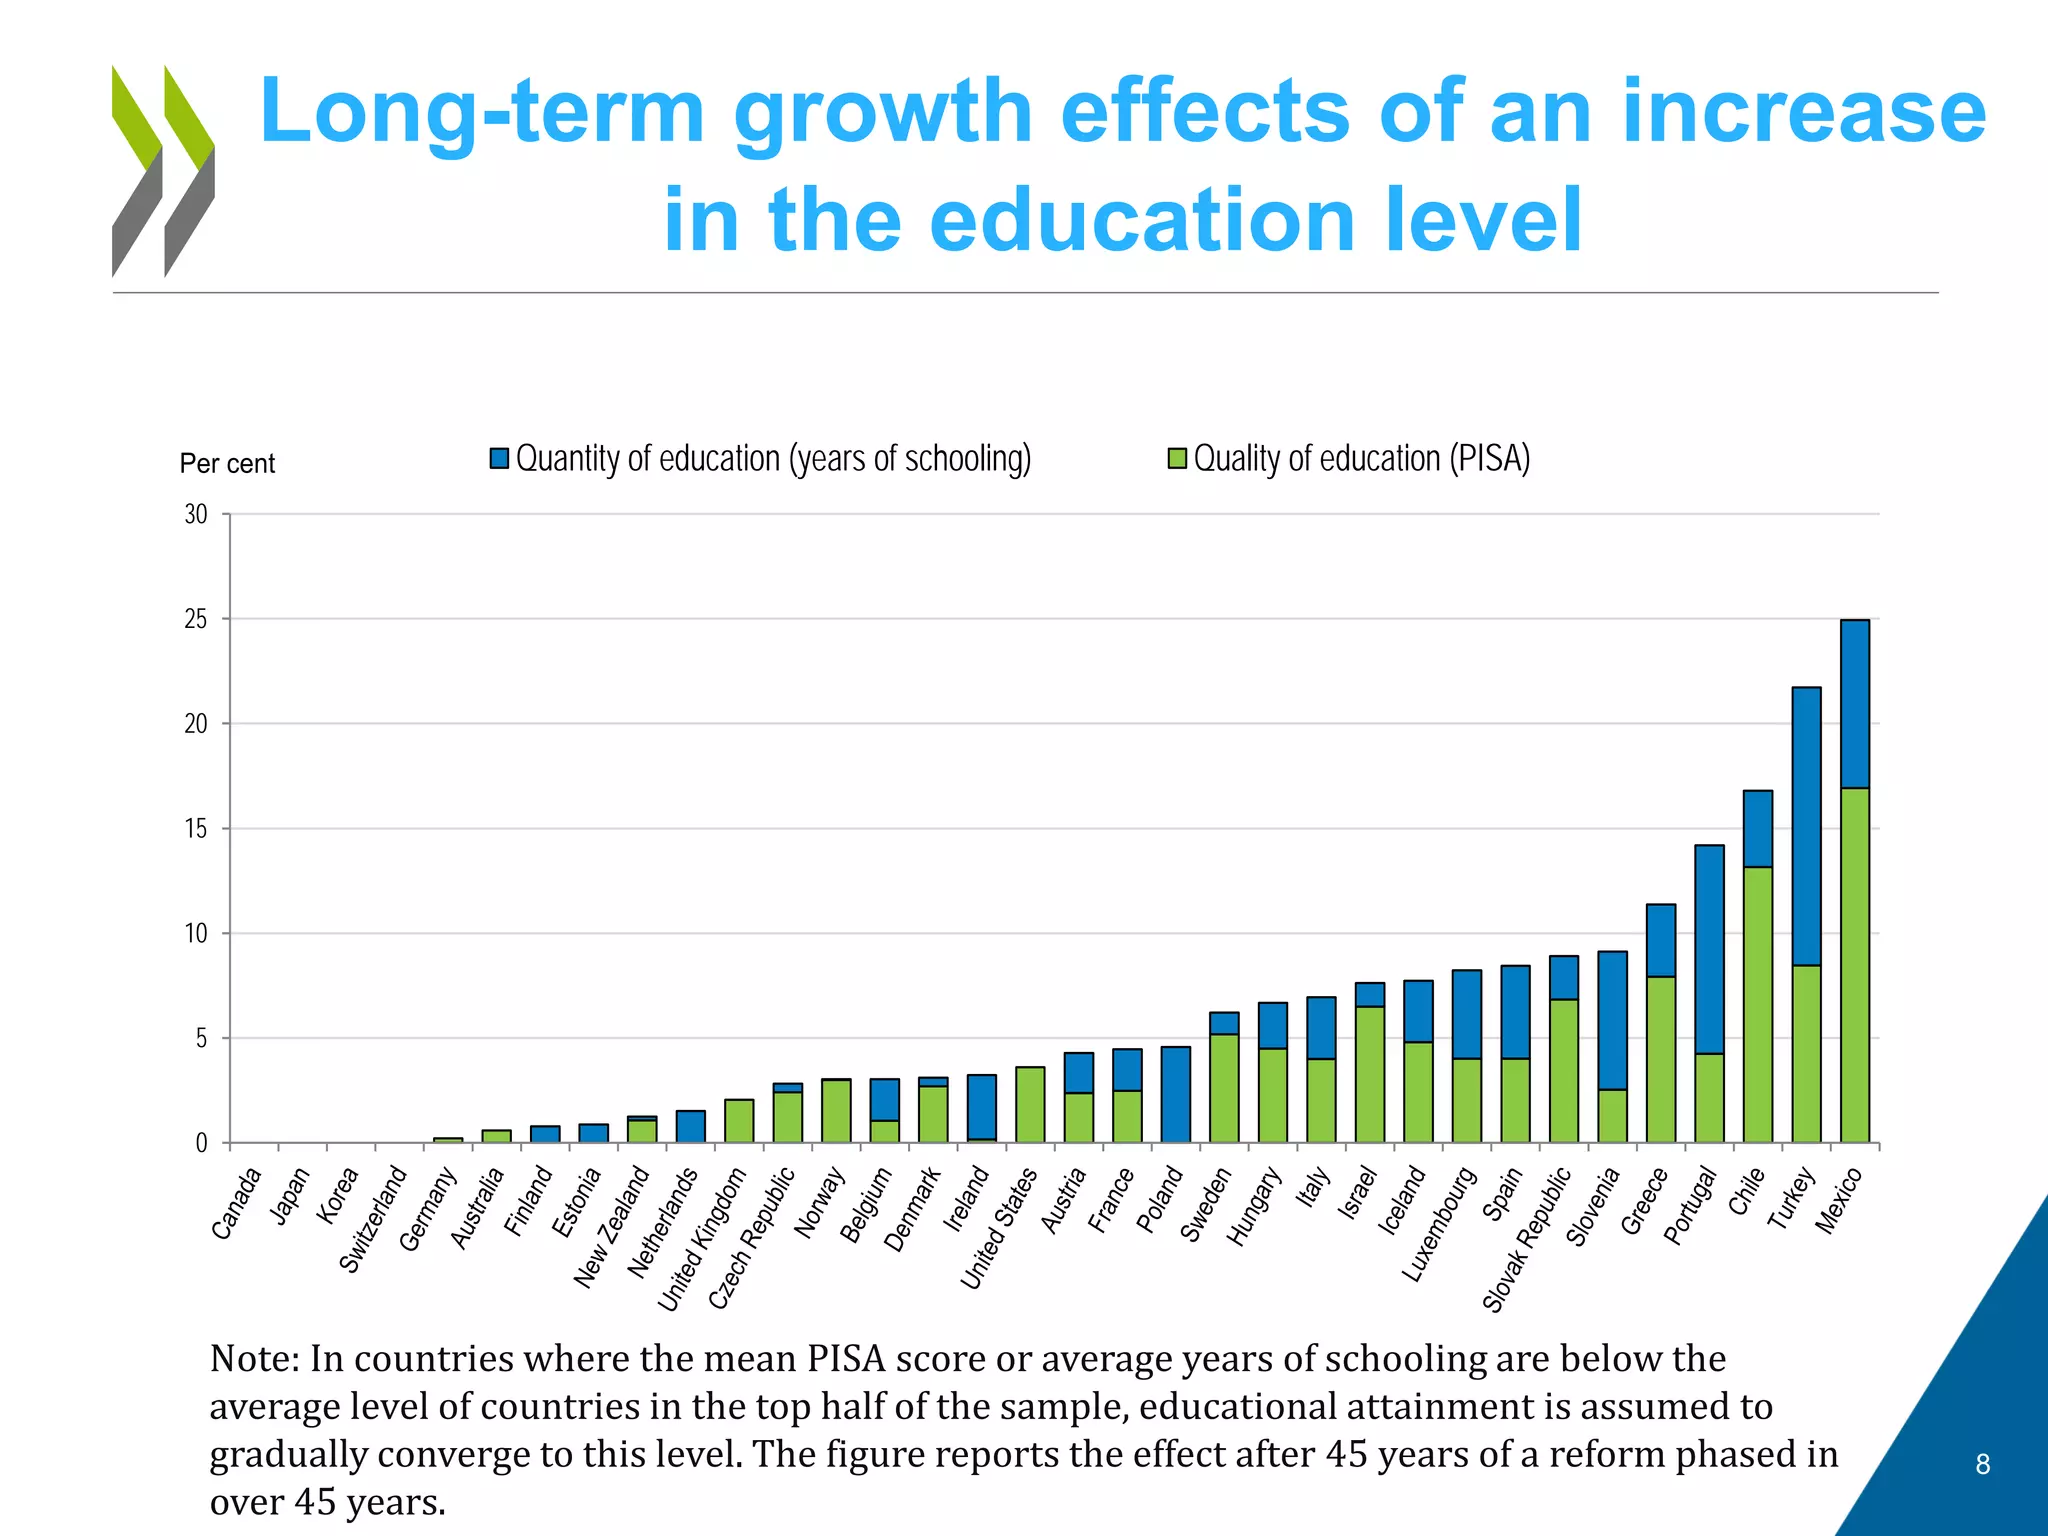
• Mankiw et al. (1992) Solow model with human capital : in the steady state, GDP
per capita depends on the stock of human capital and on the saving rate
(investment here).
• Barro (2015) on convergence equations with small time dimension: the omitted
variable bias may be smaller than the Hurwicz (1950)-type bias linked with
country fixed effects.
• Implementation of Barro (2015) approach with a large set of controls to
mitigate the risk of omitted variable bias.
The effect of public spending on growth
• The convergence model is augmented with public finance variable to estimate
the effect of public spending size, effectiveness and mix on growth:
tittitiitititi
tititiitititititi
vYIbPISAschoolingbSaGa
XaYIaPISAschoolingaPOPYaPOPY
,,,2,11,51,4
1,31,1,21,11,1,,,
)/ln()*ln(]...
...)/ln()*ln()/[ln()/ln(
ε
φ
++∆+∆+−
−−−−−=∆
−−
−−−−−−
Source: Fournier, J-M. and A. Johansson (2016), “The effect of the size and mix of public
spending on growth and inequality”, OECD Economics Department Working Papers, No. 1344.](https://image.slidesharecdn.com/d1-pm-session2-jean-marcfournieroecd-180108103343/75/Restructuring-public-spending-for-efficiency-Jean-Marc-FOURNIER-OECD-7-2048.jpg)
![The effect of size and effectiveness of
government on potential GDP
9
The effect of public spending size on growth
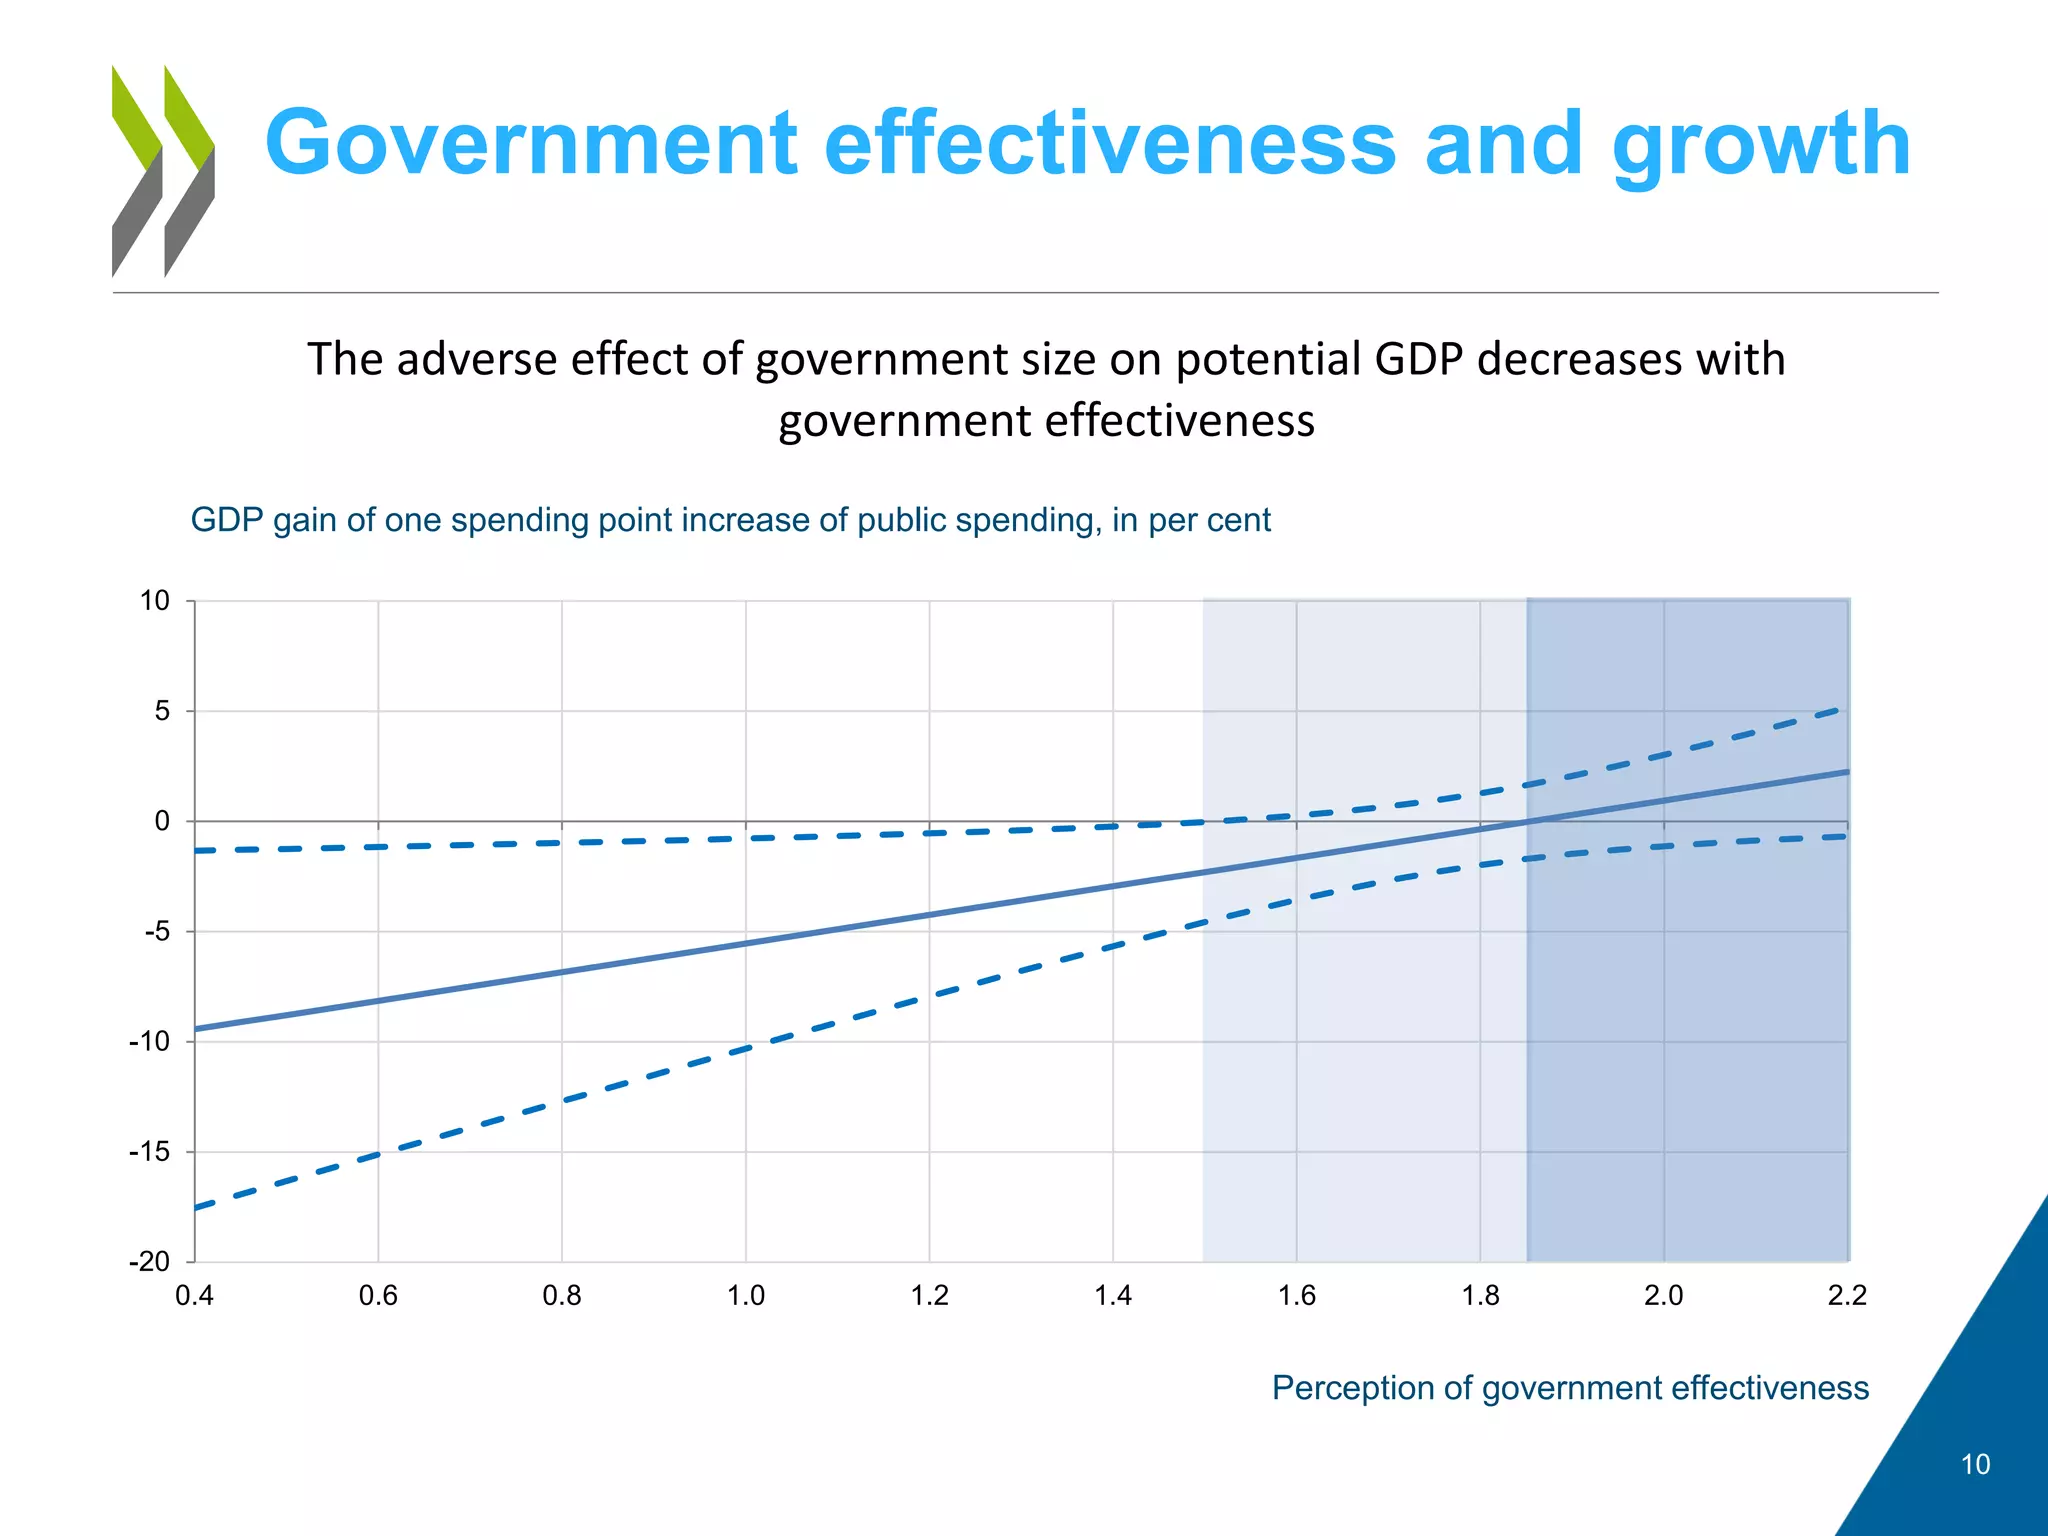
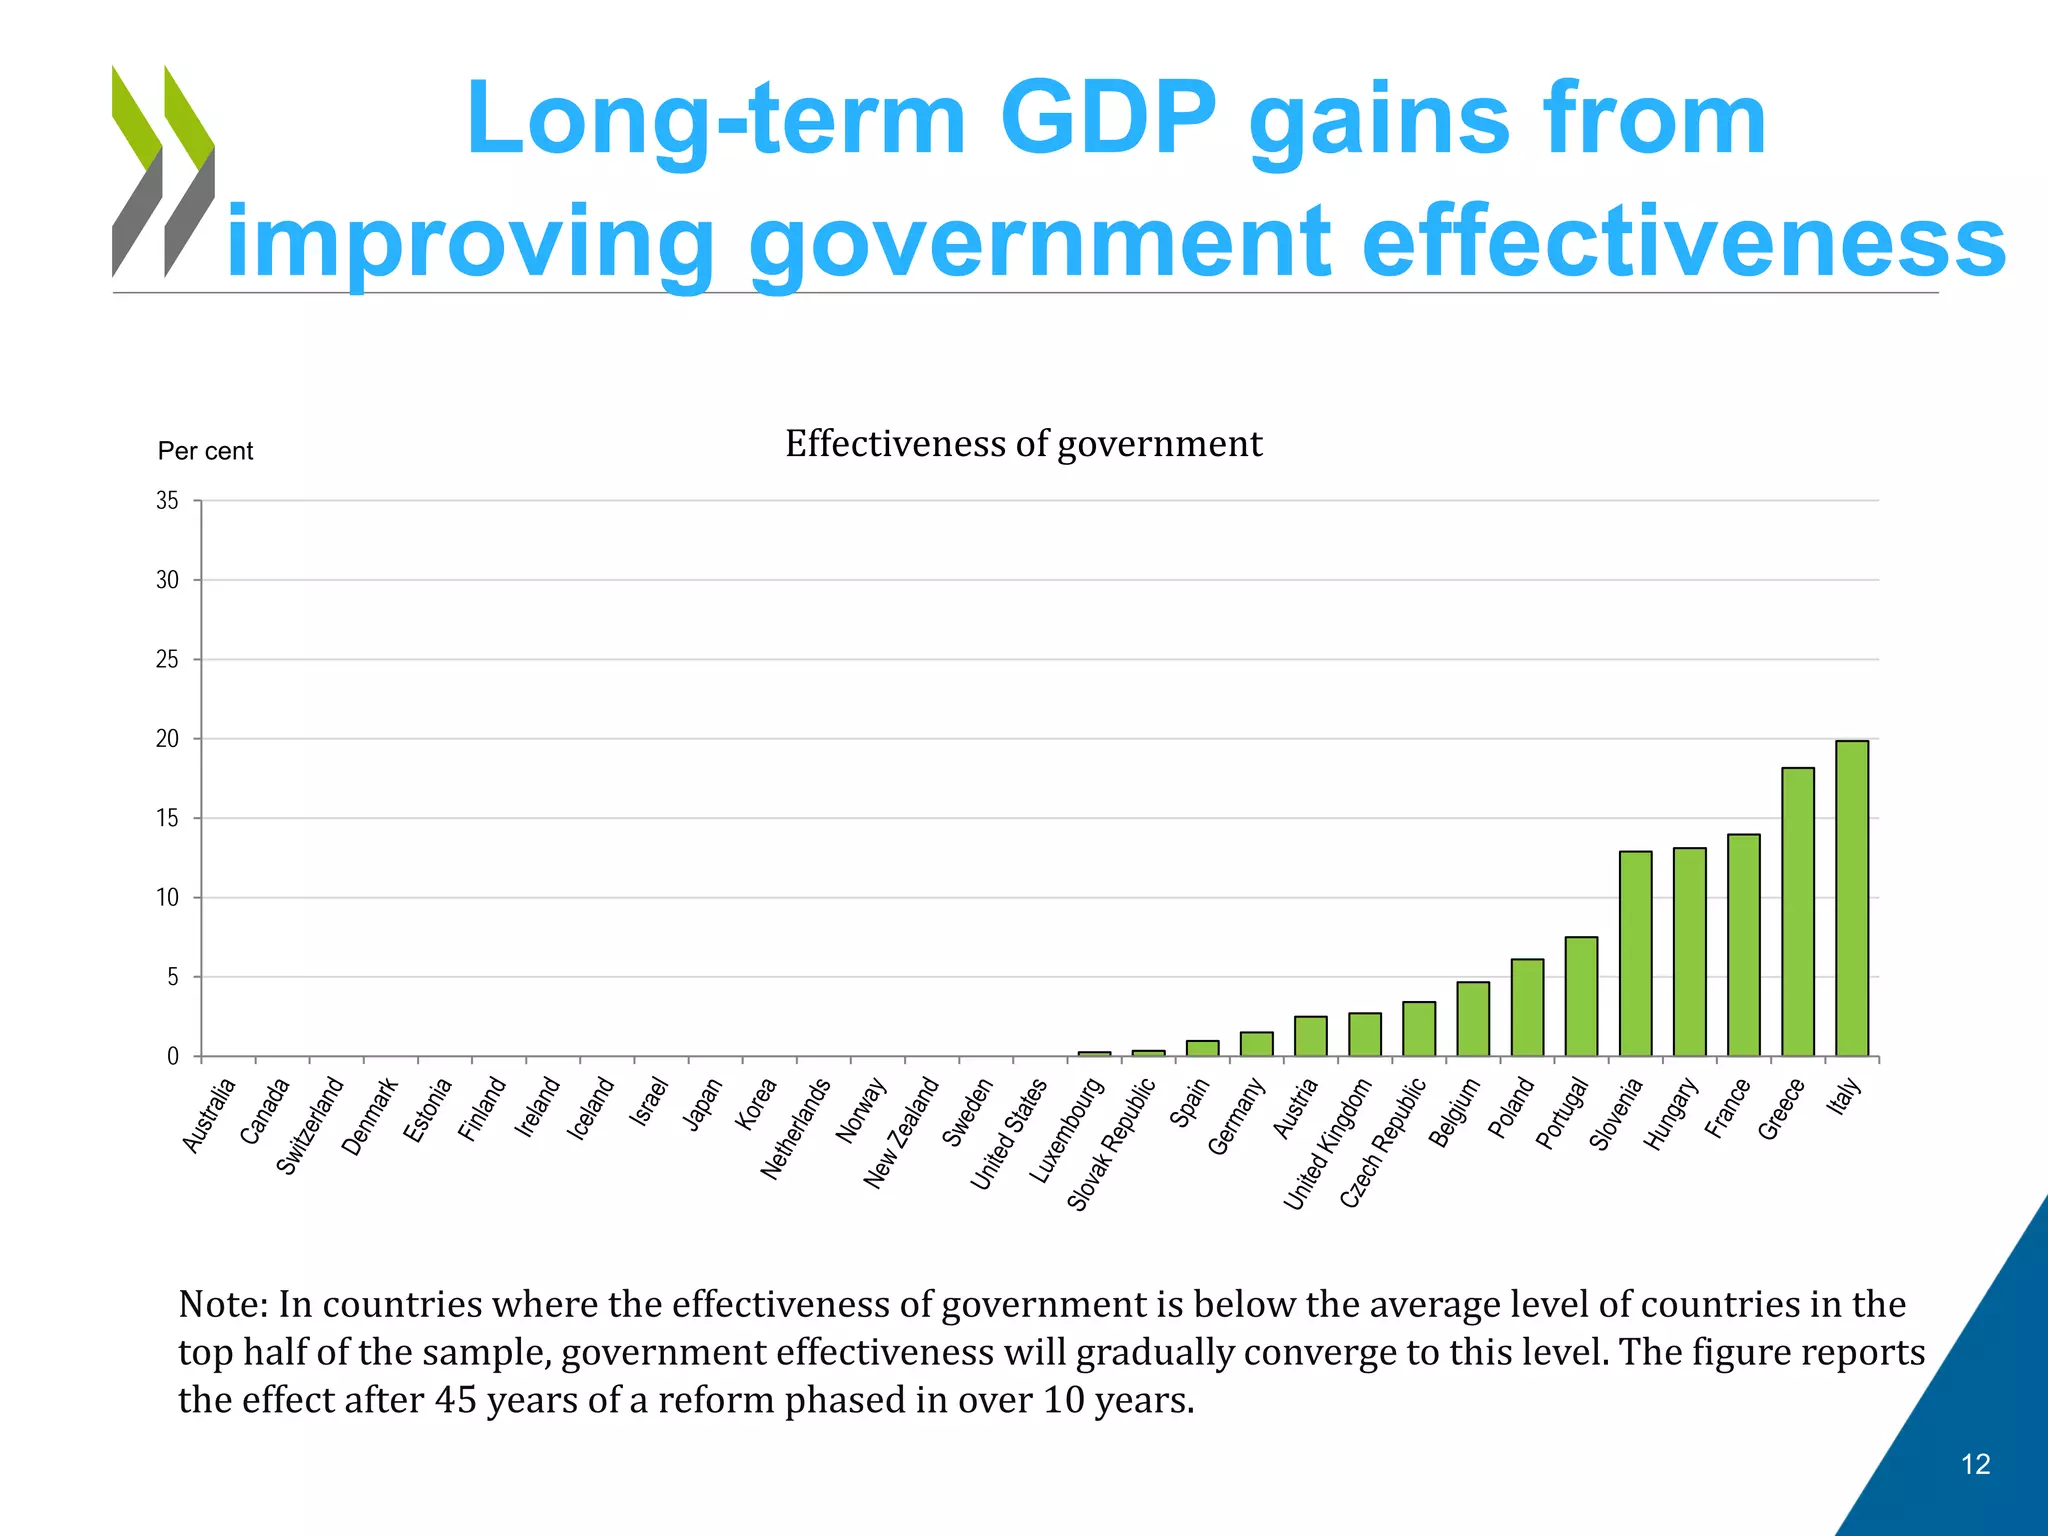
• Large governments may reduce growth (e.g. associated with more
distortive taxation), see for instance Barro (1991), or Bergh and Henrekson
(2011) for a recent overview.
• Freeman (1995) «welfare-state- as-system» hypothesis: high level of
effectiveness and trust in public institutions may have offset the adverse
growth effect.
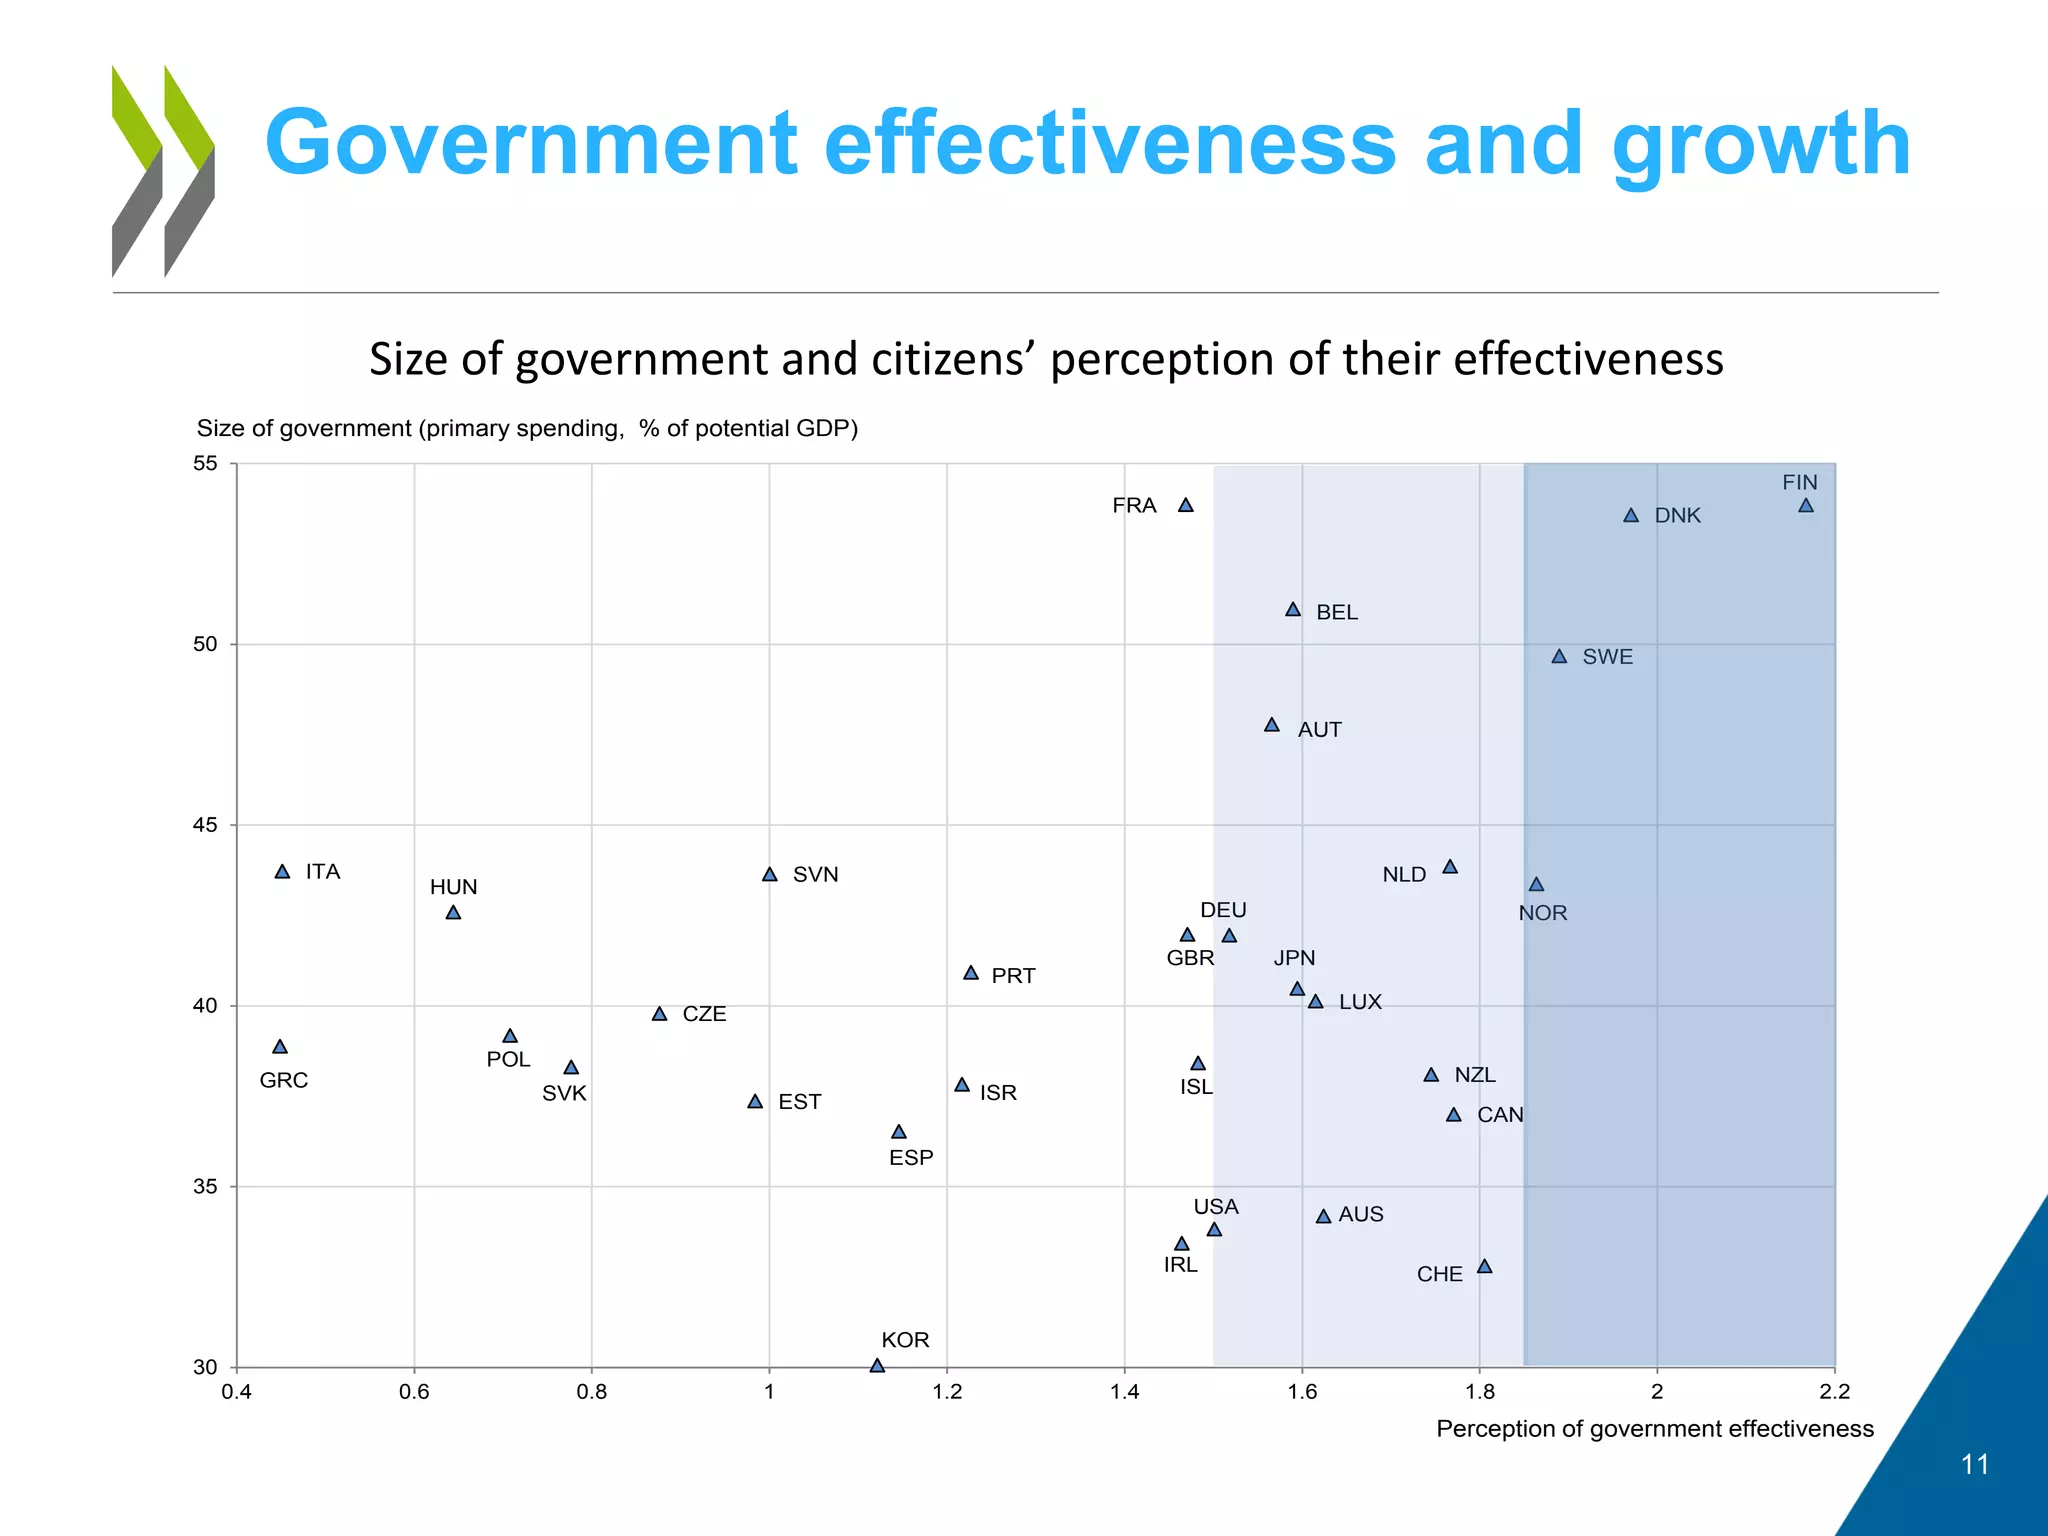
• The model interacts public spending to GDP with perceived government
effectiveness:
tittitiitititititi
tititiitititititi
vYIbPISAschoolingbGEGaGEaGa
XaYIaPISAschoolingaPOPYaPOPY
,,,2,11,1,61,51,4
1,31,1,21,11,1,,,
)/ln()*ln(]...
...)/ln()*ln()/[ln()/ln(
ε
φ
++∆+∆+−−
−−−−−=∆
−−−−
−−−−−−
Source: Fournier, J-M. and A. Johansson (2016), “The effect of the size and mix of public
spending on growth and inequality”, OECD Economics Department Working Papers, No. 1344.](https://image.slidesharecdn.com/d1-pm-session2-jean-marcfournieroecd-180108103343/75/Restructuring-public-spending-for-efficiency-Jean-Marc-FOURNIER-OECD-9-2048.jpg)

![Combining growth and inequality:
Effects on the income distribution
17
The effect of public spending size and mix on inequality.
• The estimated equation follows Hermansen et al. (2016), with :
• where is an income level indicator that captures a part of the distribution of income
(e.g. decile)
The overall effect on the distribution of disposable income is the
sum of the direct effect on disposable income and the indirect
growth effect
• Effect of growth on income is not significantly different from one
Source: Fournier, J-M. and A. Johansson (2016), “The effect of the size and mix of public
spending on growth and inequality”, OECD Economics Department Working Papers, No. 1344.
]lnln)([lnln*))(ln( ,,1,41,31,21,11,,2,,1, tititititititititi SGNEGDPxGDPx ηγϕϕϕϕζββζ αα −−−−−−−∆= −−−−−
tix ,)(ζ](https://image.slidesharecdn.com/d1-pm-session2-jean-marcfournieroecd-180108103343/75/Restructuring-public-spending-for-efficiency-Jean-Marc-FOURNIER-OECD-17-2048.jpg)


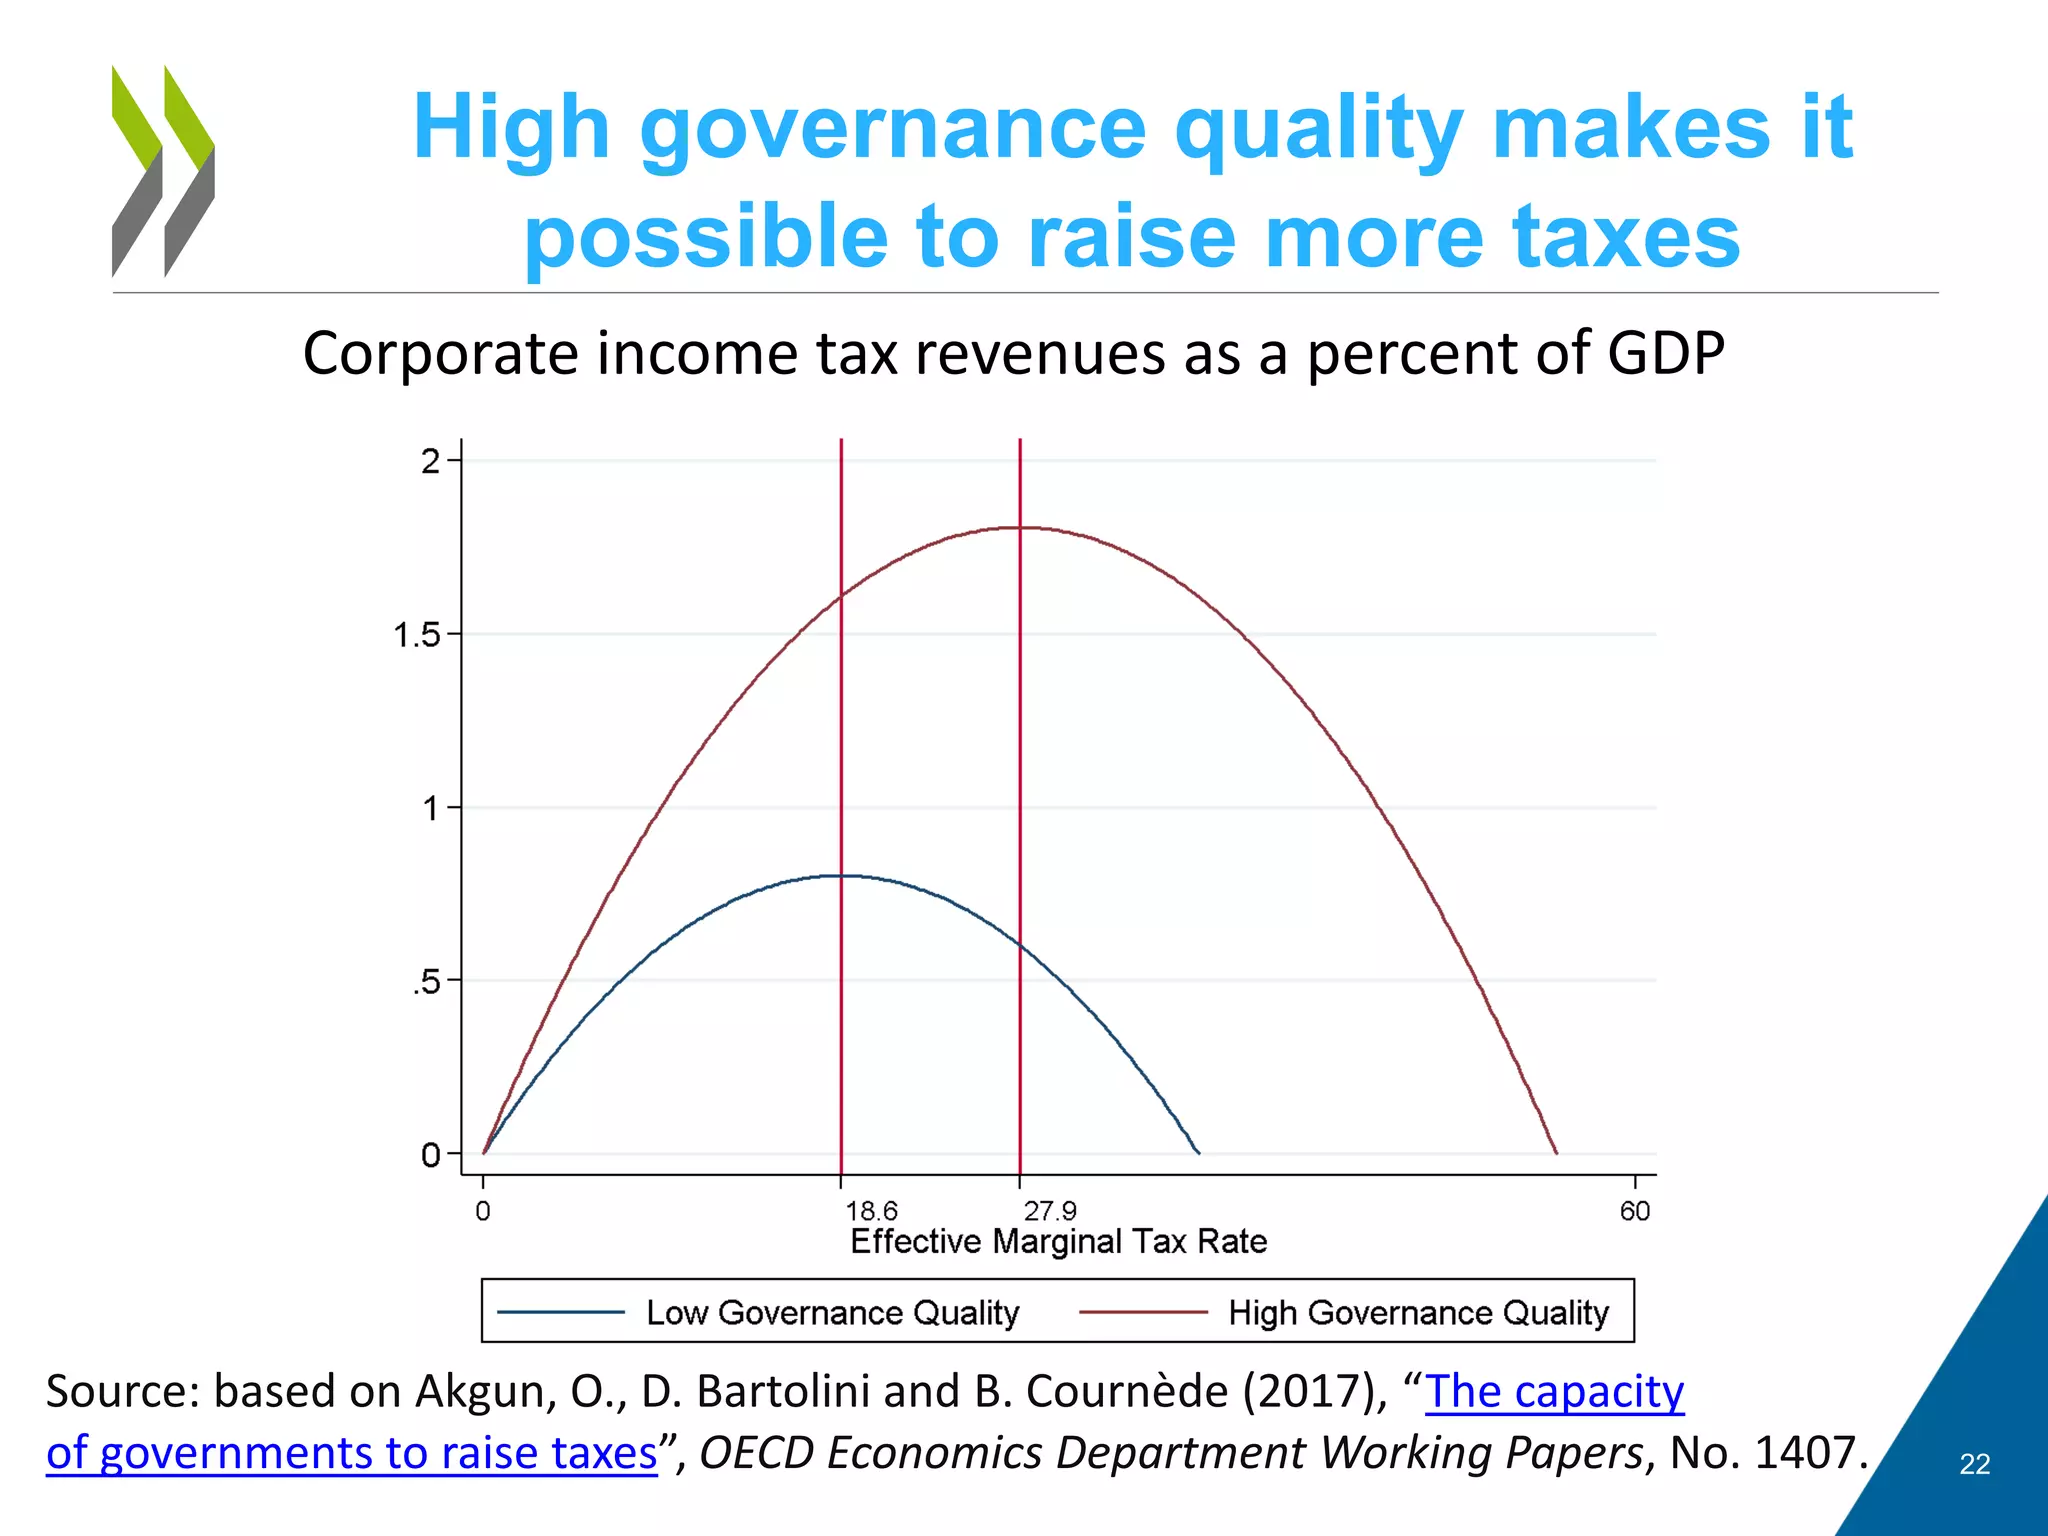
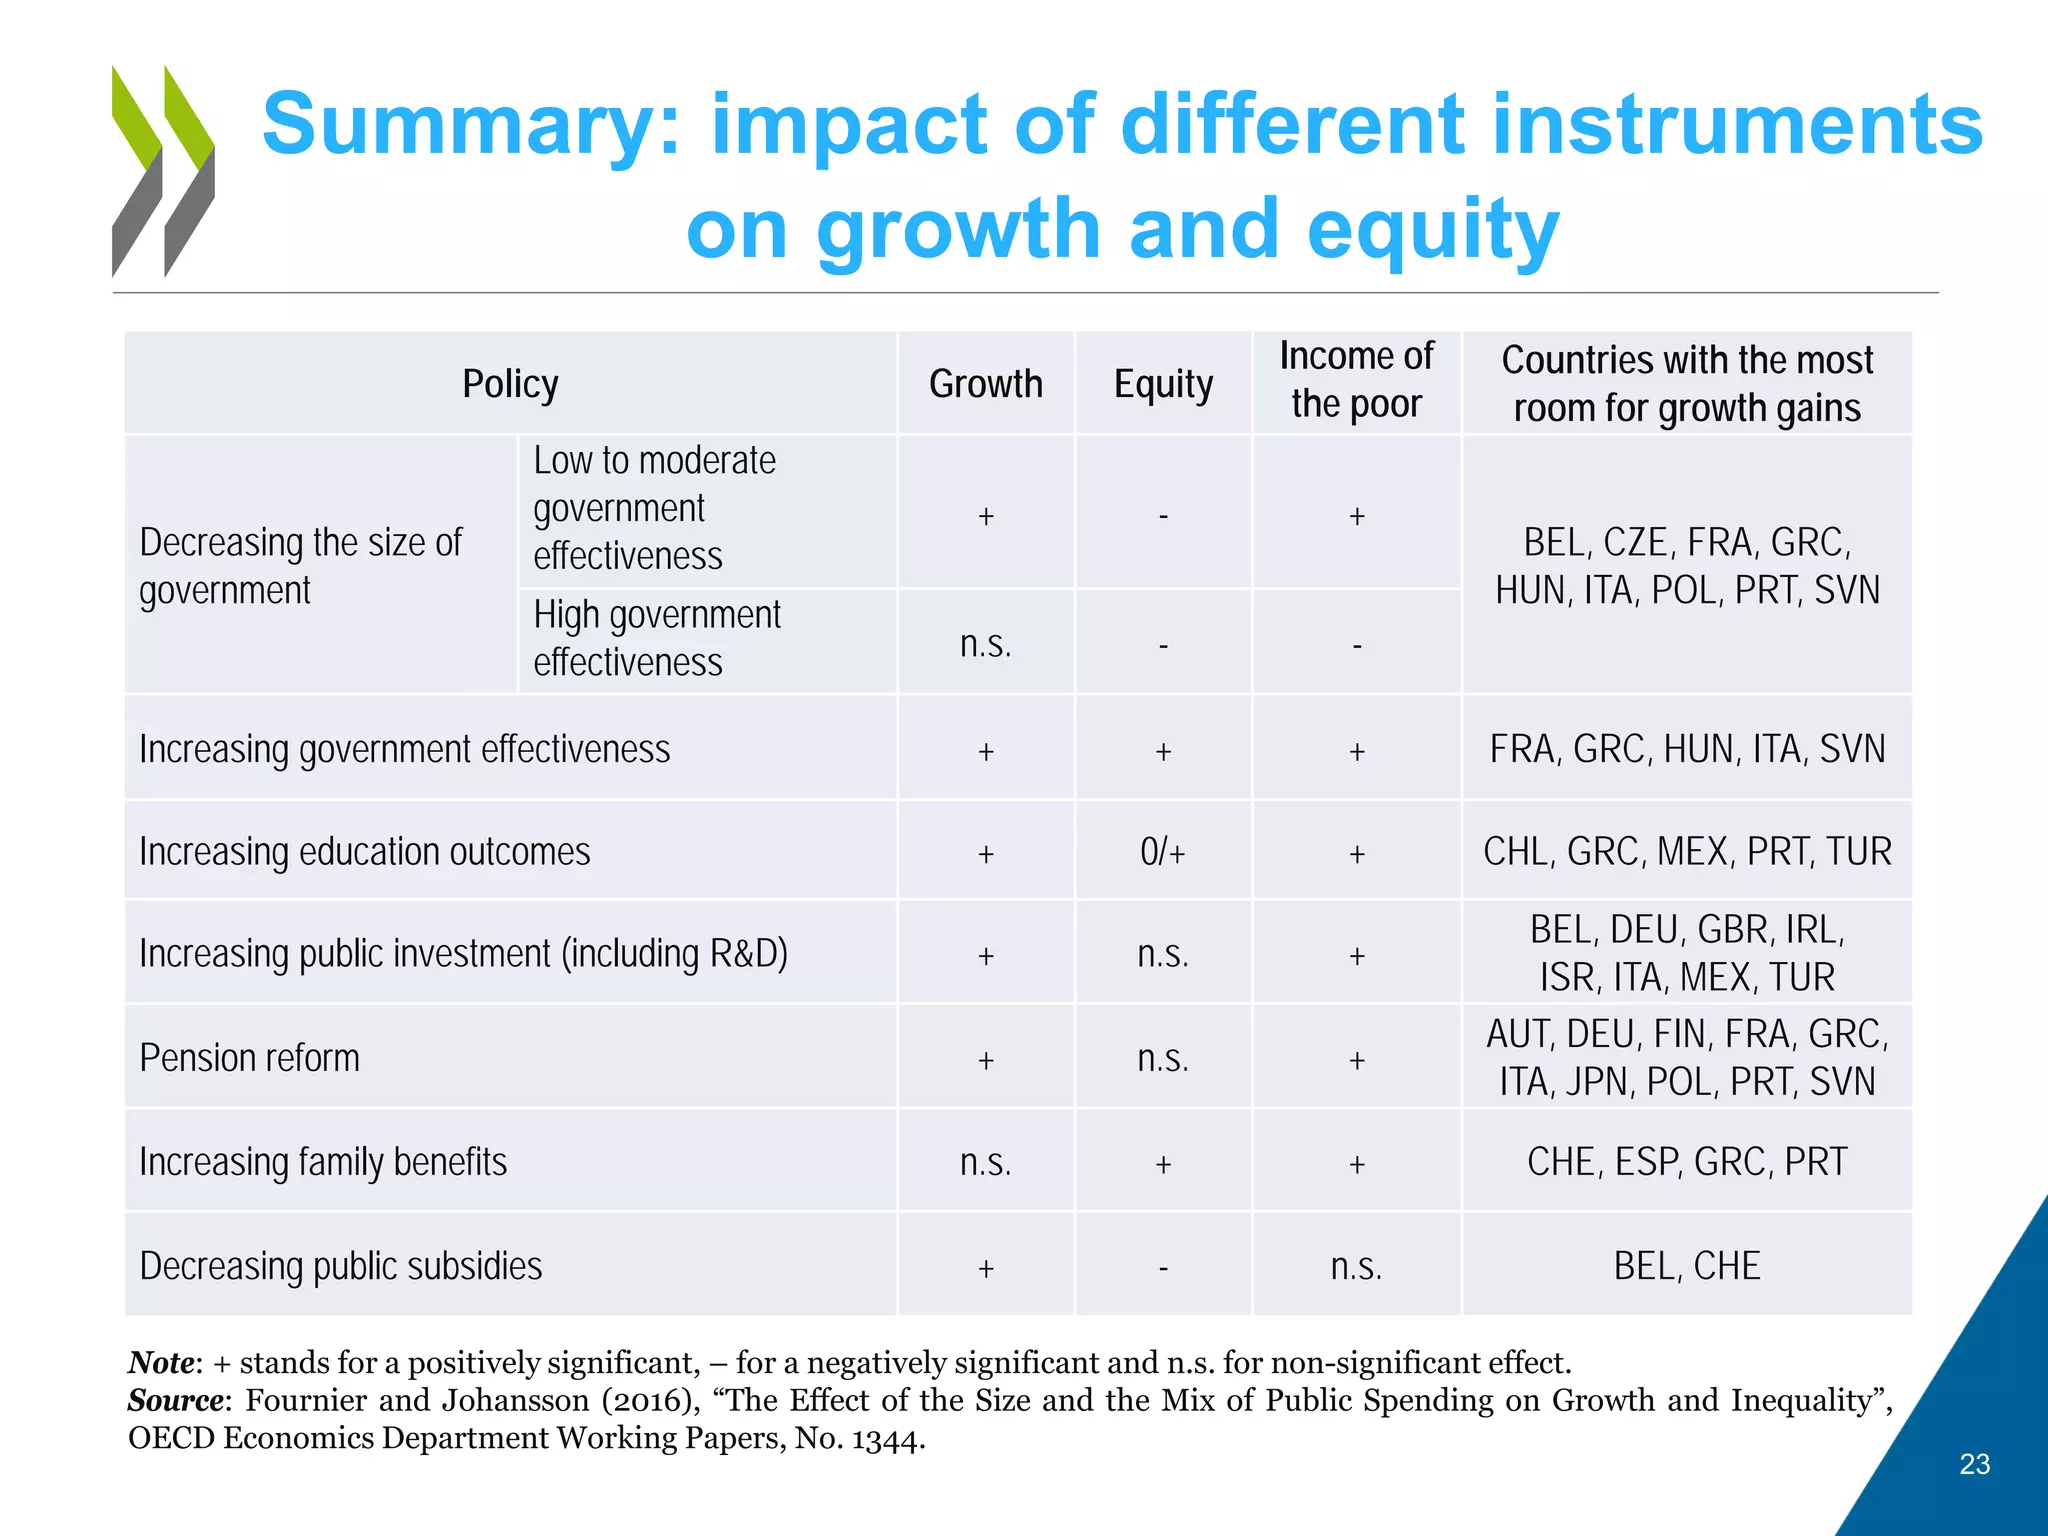


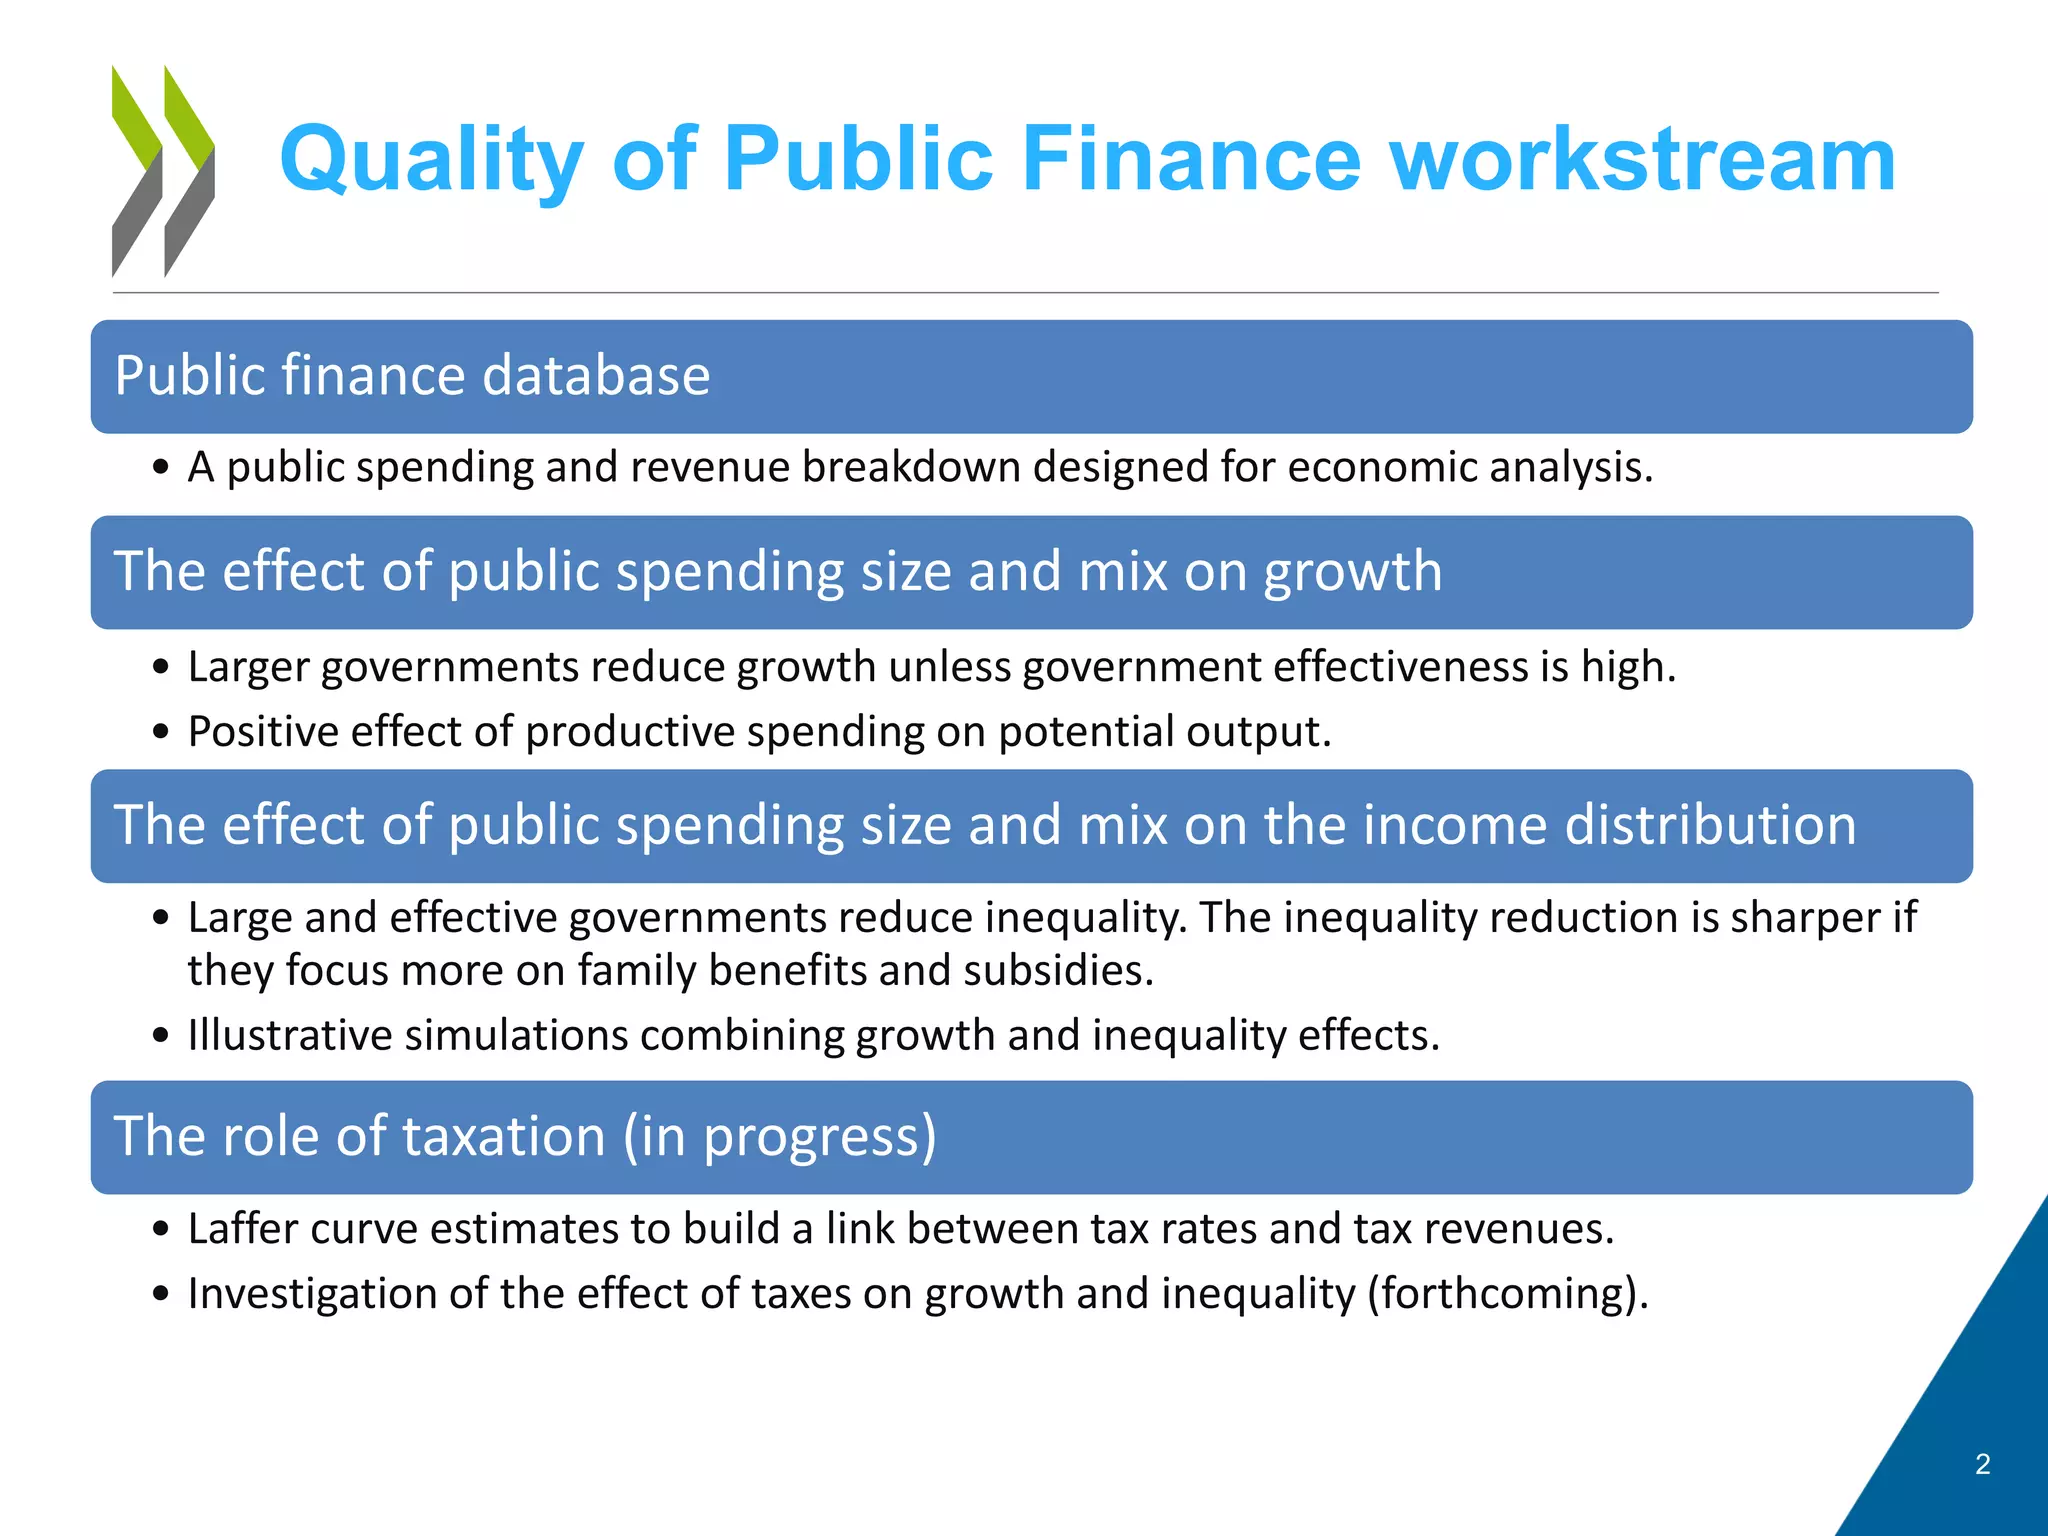
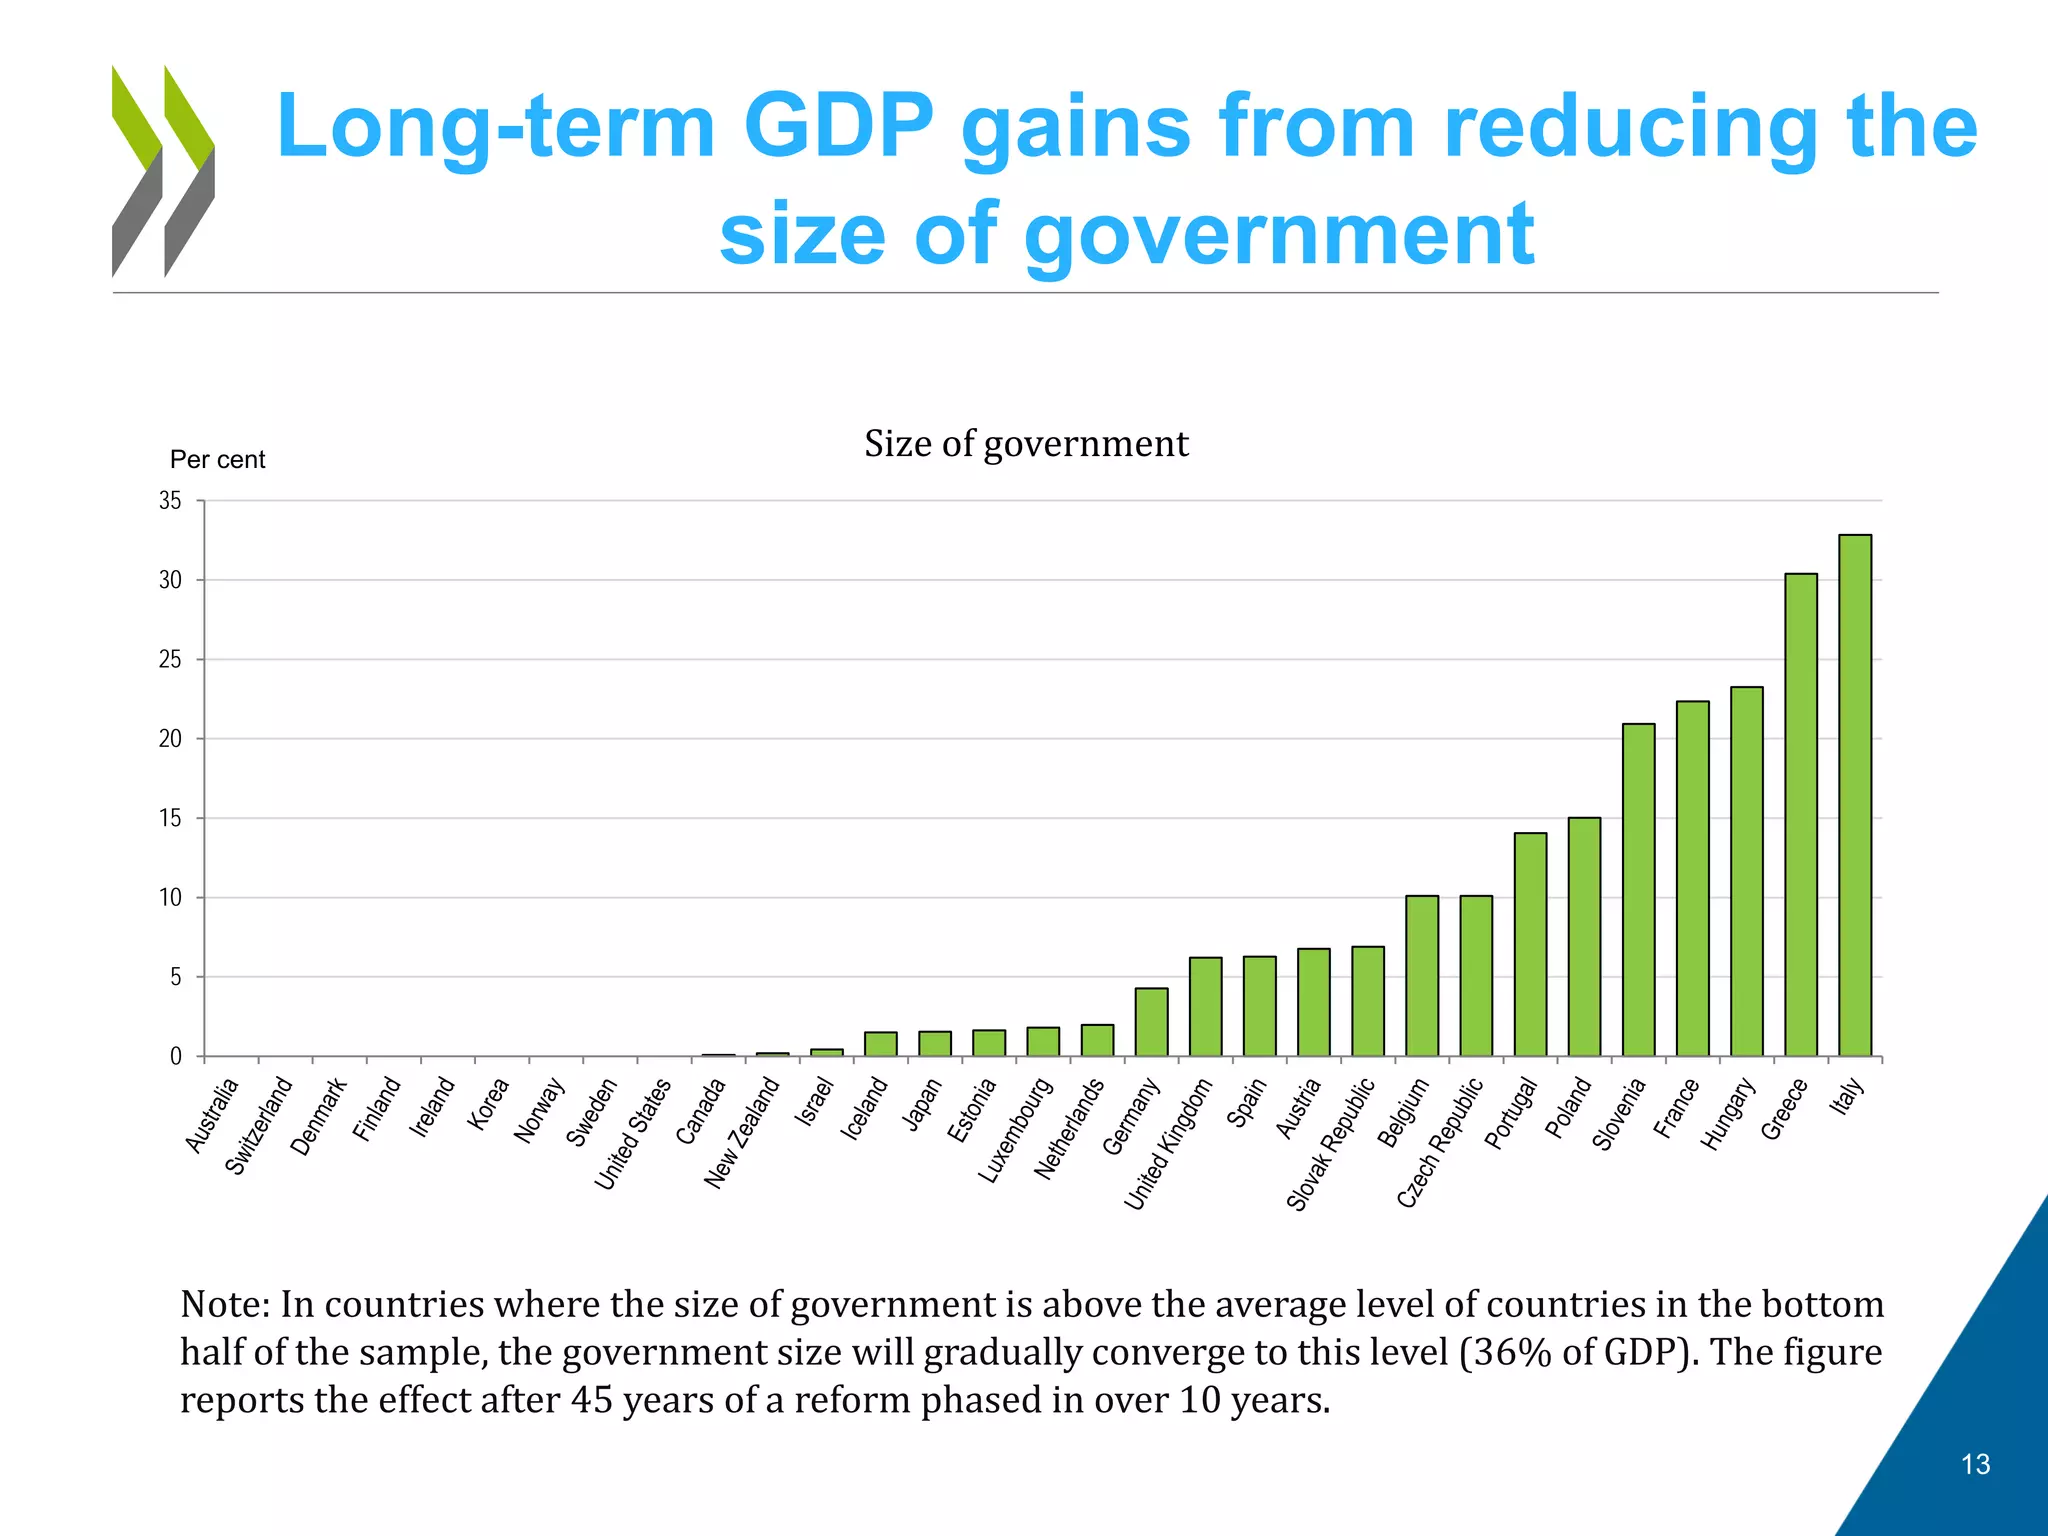
The document analyzes the impact of public spending size and mix on economic growth and income inequality, indicating that larger governments can reduce growth unless they are highly effective. It highlights that effective governments tend to reduce inequality, especially when focusing on family benefits, and presents simulations on growth and inequality effects. Upcoming sections will address the role of taxation and potential reforms to improve governance and economic outcomes.


![tp-govtsize-apr11[1]](https://cdn.slidesharecdn.com/ss_thumbnails/875a8f5f-f423-41bc-b7f1-9c57455bad1b-150719225449-lva1-app6892-thumbnail.jpg?width=640&height=640&fit=bounds)


