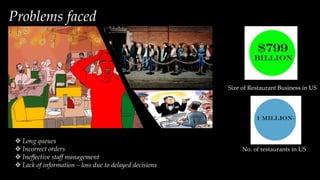
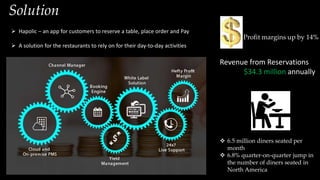
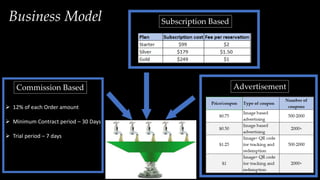
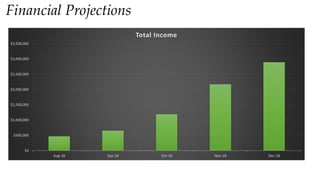
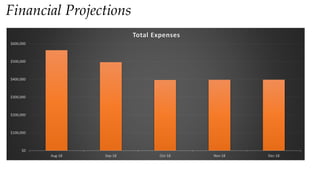
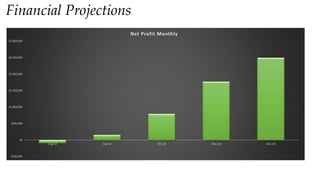
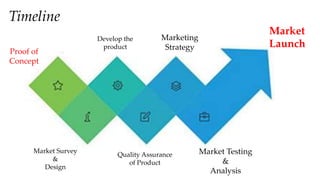
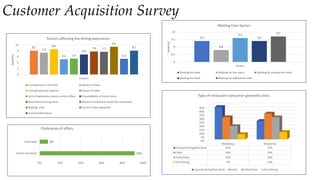
Group 3
Problem
Solution
Business Model
Financial Projections
Product Design
Competitors
1
2
3
4
5
6
Agenda
Problems faced
 Long queues
 Incorrect orders
 Ineffective staff management
 Lack of information – loss due to delayed decisions
Size of Restaurant Business in US
No. of restaurants in US
Solution
 6.5 million diners seated per
month
 6.8% quarter-on-quarter jump in
the number of diners seated in
North America
Profit margins up by 14%
Revenue from Reservations
$34.3 million annually
 Hapolic – an app for customers to reserve a table, place order and Pay
 A solution for the restaurants to rely on for their day-to-day activities
Business Model Subscription Based
AdvertisementCommission Based
 12% of each Order amount
 Minimum Contract period – 30 Days
 Trial period – 7 days
Financial Projections
$0
$500,000
$1,000,000
$1,500,000
$2,000,000
$2,500,000
$3,000,000
$3,500,000
Aug-18 Sep-18 Oct-18 Nov-18 Dec-18
Total Income
Financial Projections
$0
$500,000
$1,000,000
$1,500,000
$2,000,000
$2,500,000
$3,000,000
$3,500,000
Aug-18 Sep-18 Oct-18 Nov-18 Dec-18
Total Income
-$500,000
$0
$500,000
$1,000,000
$1,500,000
$2,000,000
$2,500,000
$3,000,000
Aug-18 Sep-18 Oct-18 Nov-18 Dec-18
Net Profit Monthly
$0
$100,000
$200,000
$300,000
$400,000
$500,000
$600,000
Aug-18 Sep-18 Oct-18 Nov-18 Dec-18
Total Expenses
Financial Projections
$0
$500,000
$1,000,000
$1,500,000
$2,000,000
$2,500,000
$3,000,000
$3,500,000
Aug-18 Sep-18 Oct-18 Nov-18 Dec-18
Total Income
-$500,000
$0
$500,000
$1,000,000
$1,500,000
$2,000,000
$2,500,000
$3,000,000
Aug-18 Sep-18 Oct-18 Nov-18 Dec-18
Net Profit Monthly
Product Design
Timeline
Market
Launch
Market Testing
&
Analysis
Marketing
Strategy
Quality Assurance
of Product
Develop the
product
Market Survey
&
Design
Proof of
Concept
Customer Acquisition Survey
8.1
7.4
8.6
5.2 5.4
6.8
7.8 7.7
9.4
5.3
8.1
0
2
4
6
8
10
Factors
Severity
Factors affecting the dining experience
Transparency in the bills Quality of food
Limited payment options Choice of table
Lack of awareness about current offers Unavailability of menu items
Disturbance during meal Distance traveled to reach the restaurant
Waiting time Correct order delivered
Correct billed items
9.4
8.8
9.6
9.4
9.7
8
8.5
9
9.5
10
Factors
Severity
Waiting time factors
Waiting for table Waiting for the menu Waiting for placing the order
Waiting for food Waiting for additional order
0%
5%
10%
15%
20%
25%
30%
35%
40%
45%
Weekdays Weekends
Causual Dining/Fast food 44% 25%
Cafes 30% 35%
Pubs/Clubs 18% 30%
Fine Dining 7% 10%
Type of restaurant consumer generally visits.
Causual Dining/Fast food Cafes Pubs/Clubs Fine Dining
92%
8%
0% 20% 40% 60% 80% 100%
Instant discounts
Cash back
Preference of offers.
References
• http://www.businessinsider.com/opentable-explainer-2011-10
• https://www.restaurant.org/Downloads/PDFs/BigData
• http://www.bplans.com/deli_restaurant_business_plan/market_analysis_summary_fc.php#
• http://sloanreview.mit.edu/article/creating-value-through-business-model-innovation/
• http://www.businessinsider.com/buffalo-wild-wings-business-plan-2014-11
• https://www.forbes.com/sites/greatspeculations/2014/05/06/slow-customer-growth-a-bigger-problem-for-opentable-than-q1-
loss/#62132d72b292
• http://www.businessinsider.com/opentable-explainer-2011-10
• https://www.eater.com/2014/6/13/6207641/opentable-by-the-numbers-from-launch-to-2-6-billion
• https://venturebeat.com/2016/05/10/opentable-rival-reserve-launches-restaurant-table-reservation-platform/
• https://restaurant.opentable.com/
• https://www.slideshare.net/fpernica/opentable-competitive-strategy-analysis?next_slideshow=1

Restaurant reservation App