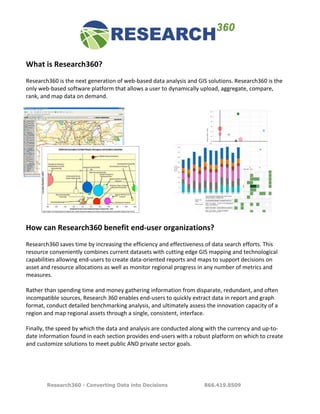
Research360 is a next generation web-based data analysis and GIS solution that allows users to dynamically upload, aggregate, compare, rank and map data on demand. It saves time for end-user organizations by increasing the efficiency of data search efforts and enabling quick extraction of data, reports and maps to support decision making through a single consistent interface. Some immediate returns on investment include asset mapping, benchmarking, trends analysis, identification of opportunities and streamlining use of internal data.
This document proposes an integrated approach to youth and student programs through four stages: mentoring, tutoring, interning, and launching. It argues this continuum would provide comprehensive economic opportunities and engagement by linking experiences to knowledge and careers. The approach would use technology platforms to minimize barriers and generate revenue across communities. Goals include establishing partnerships in 30% of regions within a year and creating unique delivery models leveraging existing networks and media to attract resources and participants. It proposes a "Youth and Student Collaboratory" national platform and non-profit to host forums, identify trends, and leverage youth innovation.
Nevada Business Weekly R Seline ArticleAccelerateH2O
This document summarizes a report commissioned by the Nevada Commission on Economic Development to identify industries Nevada has expertise in that could drive further innovation. The report identifies 5 areas: 1) gaming/defense simulation software, 2) mining/energy engineering skills, 3) renewable energy experience, 4) mining/metals research skills, and 5) high-capacity broadband infrastructure in southern Nevada. It recommends the state support research in these areas and attract private investment to commercialize promising technologies, but cautions against adopting innovation models from other states without consideration of Nevada's limitations.
This document provides a summary of a report titled "A Blueprint for Iowa 2025" which assesses Iowa's historical, current, and future economic competitiveness. The report was commissioned by the Iowa Business Council to identify challenges and opportunities to maintain positive economic growth over the next 5-20 years. Key findings include: (1) Iowa faces fiscal challenges that limit investments needed for growth; (2) federal expenditures in Iowa focus more on social services than growth; (3) retaining students and innovators lags national trends; and (4) Iowa's population gap and lack of diversity challenges its future workforce. The report recommends convening a forum to discuss goals, recommendations, and performance measures to address these issues and ensure Iowa
This document provides information about Richard Seline's speaking engagements and areas of expertise. It outlines six key aspects of Richard's presentations: 1) Enjoying storytelling to engage audiences; 2) Making presentations relevant; 3) Simplifying complex topics; 4) Connecting with participants; 5) Delivering clear takeaways; and 6) Creating buzz around events. Richard has experience speaking for audiences in various sectors including business, government, academia and more. He aims to inspire action and provide tangible next steps for audiences.
This document provides information about Richard Seline's presentations and facilitation services. It outlines his background working in business, politics, and academia. Richard specializes in presentations and forums on topics related to innovation, entrepreneurship, and economic development. He takes a storytelling approach and aims to make the content relevant to audiences. Richard strives to meaningfully engage participants and ensure they leave with clear takeaways and next steps. His goal is to inspire action through customized facilitation drawing on his extensive experience.
Paris Texas Presentation Richard SelineAccelerateH2O
This document proposes strategies for sustainable manufacturing and innovation-oriented growth leveraging water resources and location. It discusses how water can provide competitive advantages and how a focus on location remains important in innovation strategies. The document advocates developing manufacturing, food production, and delivery models that are more sustainable and make better use of water resources and logistics networks.
1) O documento discute os conceitos de milagres segundo diferentes perspectivas, incluindo a teológica e a espírita.
2) Um exemplo famoso de milagre citado é o de Fátima em 1917, quando a Virgem Maria teria aparecido e o sol teria "dançado" no céu para a multidão.
3) De acordo com o Espiritismo, Deus não faz milagres pois isso implicaria em derrogar as próprias leis imutáveis da natureza.
This document discusses an IT strategy for a technology company that offers computer products. It aims to provide outstanding customer experience using a best-of-breed approach for its ERP system. The company's product line is divided into computers for home, small business, and large enterprises. It faces challenges in research and development around managing complex product data and design processes. The document recommends using PTC's Windchill ProductPoint software for product development management and data management in R&D, highlighting advantages like reducing duplicate data, simplifying distribution and access to data, and increasing productivity.
1) The document describes gnubila's value propositions for its technology, services, and products.
2) Gnubila leverages high performance computing and grid technology to offer a multi-tenant Platform as a Service (PaaS) that can integrate with different infrastructure providers.
3) Gnubila's technology aims to facilitate legacy system migration to the cloud, provide compatibility across technologies, and enable private and hybrid cloud deployments.
This resume is for Pratibha Kumara Krishnan, who has over 8 years of experience in software development and business intelligence. Some of her skills and qualifications include experience with Java, databases, agile methodologies, and business intelligence tools. She has work experience as a business intelligence intern, systems engineer for Infosys working with clients like Elsevier and Walmart, and is currently seeking new opportunities.
- Big data refers to large volumes of data from various sources that is analyzed to reveal patterns, trends, and associations.
- The evolution of big data has seen it grow from just volume, velocity, and variety to also include veracity, variability, visualization, and value.
- Analyzing big data can provide hidden insights and competitive advantages for businesses by finding trends and patterns in large amounts of structured and unstructured data from multiple sources.
Analytical Innovation: How to Build the Next Generation Data PlatformVMware Tanzu
There was a time when the Enterprise Data Warehouse (EDW) was the only way to provide a 360-degree analytical view of the business. In recent years many organizations have deployed disparate analytics alternatives to the EDW, including: cloud data warehouses, machine learning frameworks, graph databases, geospatial tools, and other technologies. Often these new deployments have resulted in the creation of analytical silos that are too complex to integrate, seriously limiting global insights and innovation.
Join guest speaker, 451 Research’s Jim Curtis and Pivotal’s Jacque Istok for an interactive discussion about some of the overarching trends affecting the data warehousing market, as well as how to build a next generation data platform to accelerate business innovation. During this webinar you will learn:
- The significance of a multi-cloud, infrastructure-agnostic analytics
- What is working and what isn’t, when it comes to analytics integration
- The importance of seamlessly integrating all your analytics in one platform
- How to innovate faster, taking advantage of open source and agile software
Speakers: James Curtis, Senior Analyst, Data Platforms & Analytics, 451 Research & Jacque Istok, Head of Data, Pivotal
Presented by Indira Yerramareddy, Abenet Yabowork, Enrico Bonaiuti, Julien Colomer, Peter Ballantyne, Alan Orth and Michael Victor at the CGIAR Knowledge Management group, Virtual Meeting, 1 December 2022
The document discusses NASA's Systems Engineering Excellence Initiative which aims to improve systems engineering capabilities across the agency. It outlines several needs including consistency in systems engineering approaches, an agency-wide framework of best practices, common terminology, and a basis for assessing capabilities. The response is to establish a Systems Engineering Working Group and Engineering Management Board to develop and implement a common framework. This is expected to enable excellence in systems engineering and foster more effective communication and collaboration.
Poster - Train of Thought: Embedding libraries in multi-modal transportation ...robinfilipczak
This document discusses embedding library services in transportation hubs. It notes that libraries located in places like train stations can provide reading materials to users on the go. The context of the transportation location informs what materials the library offers and how it lends them. It proposes that Denver consider a similar model with its public transportation system, partnering with the Regional Transportation District and redevelopment of Union Station.
This document discusses data mining and provides an overview of the topic. It begins by defining data mining as the process of analyzing large amounts of data to discover hidden patterns and rules. The goal is to analyze this data and summarize it into useful information that can be used to make decisions.
It then describes some common data mining techniques like decision trees, neural networks, and clustering. It also discusses the typical stages of a data mining project, including business understanding, data preparation, modeling, evaluation, and deployment.
Finally, it provides examples of applications for data mining, such as in healthcare to identify patterns in patient data, education to improve learning outcomes, and manufacturing to enhance product quality. In summary, the document outlines the
Gridlogics is a leading provider of products and custom software solutions for patent research, management, data analysis and project management. Our products leverage the latest techniques in information retrieval, data mining and visualizations to help clients globally in deriving actionable intelligence from the masses of patent data.
This document provides an introduction to Insights for ArcGIS, a new spatial analytics tool. It discusses how Insights allows users to explore, analyze, visualize and iterate on data through drag and drop functionality. Insights connects to various data sources and allows users to record workflows, share results, and tell stories through embedded visualizations and analysis. The document outlines how Insights can provide value to different user types, including GIS professionals, through fast, powerful data discovery and the ability to share analysis results.
Achieve data democracy in data lake with data integration Saurabh K. Gupta
Saurabh K. Gupta discusses achieving data democratization through effective data integration. He outlines key considerations for data lake architecture and data ingestion frameworks to implement a data lake that empowers data democratization. The document provides an overview of data lake styles, principles for data ingestion, and techniques for batched and streaming data integration like Apache Sqoop, Apache Flume, and change data capture.
As more companies grow their business in global markets, they discover the need to capture new opportunities in a matter of days rather than months to have competitive advantage and to capture new market share. Their machines are producing terabytes of various data types — video, audio, Microsoft® SharePoint®, sensor data, Microsoft Excel® files — and leaders are searching for the right technologies to capture this data and help provide a better understanding of their business. The HDS big data product roadmap will help customers build a big data enterprise plan that ingests data faster and correlate meaningful data sets to create intelligence that’s easy to consume and helps leaders make the right business decisions. View this webcast to learn about Hitachi’s product roadmap to big data. For more information on HDS Big Data Solutions please visit: http://www.hds.com/solutions/it-strategies/big-data/?WT.ac=us_mg_sol_bigdat
Big data analytics (BDA) involves examining large, diverse datasets to uncover hidden patterns, correlations, trends, and insights. BDA helps organizations gain a competitive advantage by extracting insights from data to make faster, more informed decisions. It supports a 360-degree view of customers by analyzing both structured and unstructured data sources like clickstream data. Businesses can leverage techniques like machine learning, predictive analytics, and natural language processing on existing and new data sources. BDA requires close collaboration between IT, business users, and data scientists to process and analyze large datasets beyond typical storage and processing capabilities.
Analytic Platforms with Mark Madsen, John O'Brien and ParAccel
Live Webcast Dec. 5, 2012
There's a good reason why so many people are talking about analytic platforms these days. The surge in popularity of Big Data, coupled with the need to reconcile this new source of insights with Business Intelligence and Data Warehousing, has fueled a wave of innovation for synthesizing analytical capabilities. What are the latest innovations in analytic platforms? Check out this episode of Hot Technologies to find out!
Veteran Analysts Mark Madsen of Third Nature and John O'Brien of Radiant Advisors will offer their insights on what to look for in a robust analytic platform. They'll then take a briefing from Walter Maguire of ParAccel, who will provide details about his company's platform offering, which includes a high-performance analytic database, Hadoop integration, and innovative extensions that allow companies to embed analytics in business process, create big data apps, and create on demand access to 100s of new data sources.
Visit: http://insideanalysis.com
Analytics and reporting context linkedin finalDennis Crow
This document discusses enterprise information architecture for analytics and reporting. It provides definitions and principles for information architecture, including that it synthesizes analytical requirements and data capabilities, and that information is the outcome of how users interpret data. The document outlines relationships between analytics stakeholders and describes the data warehousing, analytics, and performance measurement process. It also includes diagrams showing an analysis process and how information can be presented from different data sources.
Top Big data Analytics tools: Emerging trends and Best practicesSpringPeople
This document discusses top big data analytics tools and emerging trends in big data analytics. It defines big data analytics as examining large data sets to find patterns and business insights. The document then covers several open source and commercial big data analytics tools, including Jaspersoft and Talend for reporting, Skytree for machine learning, Tableau for visualization, and Pentaho and Splunk for reporting. It emphasizes that tool selection is just one part of a big data project and that evaluating business value is also important.
Business analytics is the process of examining large volumes of various types of data to discover hidden patterns and correlations. This analysis can provide competitive advantages by helping organizations make more effective marketing and pricing decisions, leading to higher revenues. The data comes from traditional and unstructured sources and is organized and analyzed using statistical tools to make real-time decisions. Descriptive analytics describes past trends while predictive and prescriptive analytics determine future outcomes and best actions. Most data is structured but unstructured and semi-structured data from sources like text is growing.
Gainesville Phase 1 Final Report Printable Version FinalAccelerateH2O
The document provides an overview of a knowledge economy roadmap project for Gainesville, Florida. It analyzes data on the region's economy, assets, funding, and sectors to identify opportunities. Key findings include the importance of federal research funding, particularly in life sciences, and strength in sectors like biomedical, construction, and healthcare. However, connectivity between organizations and leveraging knowledge assets could be improved. The project examines building blocks and industry targets to diversify the economy and drive innovation and growth.
Paris texas presentation richard selineAccelerateH2O
This document proposes strategies for sustainable manufacturing and innovation-oriented growth leveraging water resources and location. It discusses how water can provide competitive advantages and how a focus on location remains important in innovation strategies. The document advocates developing manufacturing, food production, and delivery models that are more sustainable and make better use of water resources and logistics networks.
This document proposes an integrated approach to youth and student engagement called the Youth and Student Collaboratory. It would bring together the fragmented existing mentoring, tutoring, interning, and entrepreneurship programs into a single continuum. The goal is to help youth and students access the knowledge and experiences needed for academic and career success through affordable and measurable partnerships between organizations. A national technology platform would minimize barriers and generate revenue to support the model on a long-term basis.
Richard Seline is a civic, industry, and community provocateur who gives keynote presentations and facilitates forums and discussions around innovation, entrepreneurship, and society. Over his career, he has engaged audiences around the world through 100+ engagements. His presentations are tailored using data and insights gathered from extensive surveys, interviews, and analysis. He aims to inform, inspire, and provoke audiences into action and discussion. He has experience facilitating customized longer-term initiatives of up to six months to accelerate learning, decision-making, and next steps for civic and community leaders.
R Seline University Regional Engagement ActivitiesAccelerateH2O
This document presents Richard Seline's qualifications and experience working with universities to promote regional economic development, community engagement, and scientific innovation. Over his career, Seline has advised over 50 communities on skills and talent development strategies. He has also worked extensively with universities to design new metrics for regional innovation and advise on research commercialization and capacity building. Seline believes his experience and integrated perspective across sectors qualifies him for a role as a Chief Innovation Engagement Officer to facilitate collaborations between universities and their stakeholders.
21st Century Academic Enterprises & InnovationAccelerateH2O
This document discusses the need for 21st century academic research enterprises to better link their work to addressing national challenges and supporting regional economies. It argues that while universities have traditionally focused internally on education and research, the demands of the global knowledge economy require them to more actively engage with external partners through commercialization, collaboration and other initiatives. The document examines some past models for greater university-industry-government partnerships and argues that academic institutions must evolve their engagement models to maintain their relevance and maximize their economic and social impacts.
Measuring Comparative Benefits Of Arra SpendingAccelerateH2O
This document provides an overview of the National Dashboard Project, which aims to precisely and quickly measure the impacts and benefits of federal investments. The Dashboard combines various data sources and analytical techniques to provide a more sophisticated way to estimate the economic impacts of federal initiatives. It allows comparison of initiatives across industries and locations. Initial findings from an analysis of ARRA spending in two Midwestern cities show healthcare and education jobs provided higher economic benefits than energy or transportation jobs in one city, while the benefits were more evenly distributed across job types in the other city. Further analysis of differences in local economies can provide insights to optimize future spending.
This document outlines a model for 21st century innovation intermediaries that aim to accelerate innovation and drive regional economic growth. It discusses how traditional technology-based economic development models are outdated and must shift focus to innovation. The proposed model centers on connecting regional talent, technologies, and resources to collaborate on innovation. It also discusses functions of innovation intermediaries in convening regions and accelerating technologies to market. The best practice of Innovation Philadelphia is provided as an example that established programs to connect the regional innovation economy and fill gaps.
The document discusses launching a dashboard to enhance the effectiveness of federal spending on states, regions, and communities. It aims to provide decision makers with better metrics and data to improve investment decisions and see the full impact of spending. The dashboard will aggregate data on over 50 million grants, contracts, and other spending records over the past 7 years to allow for predictive analytics and identify what programs and approaches are most effective at stimulating economic growth. It seeks to measure the local impact of spending and jobs created in a more precise way than traditional employment statistics.
1.
What
is
Research360?
Research360
is
the
next
generation
of
web-‐based
data
analysis
and
GIS
solutions.
Research360
is
the
only
web-‐based
software
platform
that
allows
a
user
to
dynamically
upload,
aggregate,
compare,
rank,
and
map
data
on
demand.
How
can
Research360
benefit
end-‐user
organizations?
Research360
saves
time
by
increasing
the
efficiency
and
effectiveness
of
data
search
efforts.
This
resource
conveniently
combines
current
datasets
with
cutting
edge
GIS
mapping
and
technological
capabilities
allowing
end-‐users
to
create
data-‐oriented
reports
and
maps
to
support
decisions
on
asset
and
resource
allocations
as
well
as
monitor
regional
progress
in
any
number
of
metrics
and
measures.
Rather
than
spending
time
and
money
gathering
information
from
disparate,
redundant,
and
often
incompatible
sources,
Research
360
enables
end-‐users
to
quickly
extract
data
in
report
and
graph
format,
conduct
detailed
benchmarking
analysis,
and
ultimately
assess
the
innovation
capacity
of
a
region
and
map
regional
assets
through
a
single,
consistent,
interface.
Finally,
the
speed
by
which
the
data
and
analysis
are
conducted
along
with
the
currency
and
up-‐to-‐
date
information
found
in
each
section
provides
end-‐users
with
a
robust
platform
on
which
to
create
and
customize
solutions
to
meet
public
AND
private
sector
goals.
Research360 - Converting Data into Decisions 866.419.8509
2. What
are
some
of
the
immediate
returns
on
investment
from
the
Research360
solution?
• Asset
mapping
and
benchmarking
capabilities
for
gap
and
SWOT
analysis,
as
well
as
a
functional
inventory
of
hard
and
soft
drivers
of
innovation
and
economic
capacity
building
• Trends
and
real-‐time
impact
analysis
of
critical
inputs
to
the
economy,
the
workforce,
and
the
sustainability
of
competitiveness
among
regional,
state
and
federal
investments
• Determination
of
federal
and
state
resource
allocation
plans
and
increased
collaboration
and
alignment
among
various
stakeholders,
and
organizations
through
fact-‐driven
analysis
• Identification
of
new
targets
of
opportunity
across
technological,
scientific,
and
industry
sectors
leading
to
consistent
growth
in
jobs
and
entrepreneurial
outcomes
• Streamlining
the
use
of
internal
data
to
assist
researchers
and
decision
makers
• Creating
a
network
of
shared
business
intelligence
through
our
unique
SHARE
technology
allows
regional
and
state
agencies
to
unlock
the
power
of
data
• Regional,
State
or
National
networks
of
users
are
able
to
leverage
a
cost
effective
data
dissemination
tool
through
a
consistent,
easy
to
use
software
solution
Patents
Economic
Forecast
Research360 - Converting Data into Decisions 866.419.8509
3. Features
and
Functionality
• Upload
data
appended
to
standard
geographies
to
create
reports
and
thematic
maps
–
from
pie-‐charts
to
hot-‐maps
• HTML
export
of
reports
(users
can
then
link
the
url
as
public
access
data)
• Select
Geographies
by
market
capture
• SHARE
data,
report
formats,
and
map
templates
with
other
Research360
users
in
a
customized
network
• Custom
Chart
creation
from
all
datasets
thru
our
just-‐in-‐time
DataDashboard
• Compare
dissimilar
geographies
including
radius
versus
drive
time
or
radius
versus
standard
geographies
• Create
Weighted
indices
• Merge
Radius
or
Drive
time
boundaries
• State
name
appended
to
geography
selections
• Map
customization
including
increased
thematic
ranges
and
defining
thematic
ranges
by:
Equal
Value,
Equal
Class
Counts,
Class
Percent,
Means
and
Standard
Deviations,
Individual
Values
• Save
Reports
by
Project/Geography
• Create
Custom
Reports
that
combine
standard
data
and
your
uploaded
data
• Additional
map
options:
Google
Earth,
Google
Maps,
Virtual
Earth,
Yahoo
Maps
• 3D
mapping
available
from
Virtual
Earth
• Save
Map
Templates
by
Project
• Save
or
Export
Maps
as:
GIF,
JPG,
TIF,
PNG,
WMF,
or
EMF
file
formats
• Thematic
Mapping
available
for
large
areas
(i.e.
multiple
states)
up
to
the
entire
U.S.
at
any
geography
level
• Multi-‐user
Admin
controls
for
managing
access
to
uploaded
data
and
for
sharing
report
and
map
templates
• Rank
geography
options
with
a
“sort
by
data
variable”
feature
within
HTML
outputs
• Innovation
Datasets
–
now
available
for
thematic
mapping
and
custom
reports
across
datasets
• PopStats
–
the
only
demographic
database
with
Quarterly
Updates
• 500
mile
radius
and
4
hour
travel
time
geographies
available
• additional
features
and
functionality
available
upon
request
Research360 - Converting Data into Decisions 866.419.8509
4.
Research
Package
Descriptions
All
Packages
include
the
PRO
version
of
Research360,
D&B
Business
Location
data,
and
NAICS
Business
Summary
data
Research360
Advantage
–
Workforce
and
Industry
Data
Enhance
your
workforce
and
training
related
decisions
with
our
Industry
and
Occupation/Wage
data
modules.
Adding
to
the
data
and
technical
features
available
in
Research360
Professional,
Advantage
offers
current
and
projected
industry
cluster
data
including
location
quotient,
wage
and
occupation
growth
statistics
providing
users
with
an
economic
barometer
for
their
region.
In
addition,
occupation
levels
by
standard
occupation
code
help
determine
the
future
workforce
needs
of
emerging
businesses
and
industries.
Armed
with
this
information,
a
region
will
be
able
to
design
more
effective
regional
workforce
development
initiatives
and
a
superior
workforce
delivery
system.
Research360
InnovationEconomy
–
Federal/State
Funding,
Patents
and
VC
Our
Research360/
Innovation360
package
incorporates
key
datasets
to
our
Professional
solution
by
including
ten
years
worth
of
all
federal
funding
(R&D,
Economic
and
Workforce,
Community
and
Infrastructure,
Small
Business/Entrepreneurial
activities
–
some
600
programs
in
total),
patents,
and
venture
capital
that
can
help
to
identify
potential
gaps
and
weaknesses
as
well
as
key
opportunities
and
strengths.
In
this
knowledge-‐based
economy,
clusters
of
competency
in
the
workforce
drive
the
growth
of
new
industries.
It
is
essential
to
understand
where
knowledge
is
being
created,
transferred,
commercialized,
and
industrialized
when
determining
which
competencies
regional
businesses
will
demand
in
the
future.
Research360
Analyst
Research360
Analyst
is
the
ultimate
version
of
our
web-‐based
GIS
Software,
taking
numerous
sources
of
information
–
Professional
functionality,
NAICS
Business
Summary
and
Location
data,
Industry,
Occupation/Wage,
Patents,
Venture
Capital,
and
Federal
Funding
data
and
combining
them
into
one
powerful
decision
making
tool.
By
combining
these
tools
and
unique
datasets,
access
to
typical
employment,
wage,
labor-‐shed
and
other
knowledge
becomes
readily
available
to
decision
makers
at
all
levels.
Analyst
datasets
match
innovation
inputs
with
key
metrics
of
performance,
production,
and
overall
outputs
for
aggregating
intelligence
for
economic
and
workforce
related
activities.
Research360 - Converting Data into Decisions 866.419.8509
5. Data
Descriptions
Business
Location
Data
This
location
data
is
ideal
for
competitive
analysis,
understanding
market
opportunities
and
evaluating
market
dynamics.
Sourced
to
D&B®,
the
world's
most
trusted
source
of
sales
and
marketing
solutions,
all
D&B
information
is
powered
by
DUNSRightTM,
D&B's
Quality
Process
which
gives
you
the
insight
you
need
to
avoid
duplication,
better
target
prospects
and
increase
the
profitability
of
marketing
lists.
This
data
is
updated
quarterly
and
provided
down
to
6-‐digit
NAICS.
Business
Summary
Data
Employee
and
Establishment
counts
at
4
digit
NAICS
by
Industry
Consumer
Expenditures
This
data
includes
18
reports
and
close
to
1,000
variables
that
collectively
cover
almost
95%
of
household
spending.
Based
on
extensive
modeling
of
the
BLS
Consumer
Expenditure
Survey,
CEX
provides
reliable
estimates
of
market
demand
and
average
household
expenditures.
Retail
Potential
This
new
tabulation
utilizes
the
Census
of
Retail
Trade
tables
which
cross-‐tabulates
store
type
by
merchandise
line.
The
Consumer
Expenditure
data
was
aggregated
to
the
merchandise
line
classification
and
then
distributed
to
each
of
the
major
store
types.
The
store
type
classification
is
based
on
the
NAICS
definitions.
Crime
Index
Data
This
report
provides
indexed
crime
data
for
your
geography.
It
provides
indices
for
assault,
burglary,
larceny,
motor
vehicle
theft,
murder,
personal
crime,
property
crime,
rape
and
robbery.
It
also
provides
an
index
for
total
crime
in
the
area.
Federal
Funding
The
only
system
in
the
country
that
tracks
federal
funding
by
recipient
location
in
over
900
budget
codes
across
four
key
areas—Federal
Research
and
Development;
Economic
&
Community
Development;
Workforce
&
STEM;
and
Enterprise
&
Entrepreneurial
Development—broken
down
by
Research360 - Converting Data into Decisions 866.419.8509
6. program,
sponsoring
agency,
recipient,
and
year.
Also
includes
2008-‐2010
Stimulus/ARRA
spending
by
agency
and
program,
as
well
as
National
Science
Foundation
funding
initiatives.
Patents
Twenty-‐five
years
of
patents
categorized
by
year,
tech
sector,
and
assignee,
to
identify
key
technologies
for
commercialization
and
technological
strengths
and
gaps.
Venture
Capital
Identifies
SBIR,
early-‐stage/seed
stage,
and
venture
backed
investments
by
technology
sector,
recipient
company,
and
venture
firm.
Employment
and
Wages
Captures
historical,
current
and
projected
employment
and
wage
data
down
to
5
digit
NAICS
for
all
Standard
Occupation
Codes.
Covers
all
counties
in
the
U.S.
Industry
Data
Tracks
current
industry
employment,
location
quotient,
plus
5
and
10
year
projected
growth
data
for
400
industries.
Covers
all
counties
in
the
U.S.
State
and
Local
Procurement
Data
(additional
cost)
In
cooperation
with
ONVIA,
identifies
the
past
seven
years
worth
of
all
state,
county,
municipal,
primary/secondary
education,
university
and
community
college
procurement
of
labor,
materials,
equipment,
and
services
–
including
most
recent
ARRA
expenditures.
Corporate
and
Philanthropic
Giving
(additional
cost)
In
cooperation
with
GrantStation,
identifies
the
past
twenty-‐four
months
of
8,000
sources
of
gifts,
grants,
and
partnership
initiatives
provided
by
corporate,
family,
and
related
philanthropic
sources.
Since
many
federal,
state,
and
local
programs
requiring
matching
dollars
or
a
non-‐profit
lead
entity,
tracking
these
dollars
assist
in
projecting
additional
impacts
on
economic
output
Other
Options
and
Data
(additional
cost)
Partnerships
have
been
formed
with
several
other
data
providers
including
Monster.com
(accessing
their
job-‐seekers
aggregate
information
by
region,
occupation,
sector),
IPED
data
provided
by
US
Department
of
Education
on
degrees
and
certificates,
and
third
party
providers
of
information
on
social
networks
among
civic-‐business-‐academic
leadership.
Research360 - Converting Data into Decisions 866.419.8509
7.
Pricing
and
Budget
Parameters
Note:
Research360
is
the
first
web-‐based
GIS
solution
available
as
a
software
platform
only
–
data
is
optional.
“Software
Only”
Pricing
for
multiple
seat
licenses
–
PRO
Version
Up
to
5
users:
$1995/user
6
to
10
users:
$1790/user
11
to
25
users:
$1590/user
26
to
50
users:
$1390/user
51
to
100
users:
$1190/user
101
to
200
users:
$
990/user
201
to
500
users:
$
890/user
501
to
1000
users:
$
690/user
1000+
users:
$
490/user
Individual
Users/Organizations
have
the
option
of
licensing
add-‐on
datasets
from
the
pricing
schedule
below
for
their
respective
accounts.
Subscription
Rate
CORE
Software
with
no
data
$995.00
CORE
with
AGS
(annual)
$1,795.00
CORE
with
PopStats
(quarterly)
$2,995.00
PRO
Software
with
no
data
$1,995.00
PRO
with
AGS
(annual)
$2,795.00
PRO
with
PopStats
(quarterly)
$3,995.00
Add-‐On
Options
AGS
Business
Summary
by
NAICS
$795.00
AGS
CEX
$795.00
AGS
Retail
Potential
$595.00
AGS
MOSAIC
$1,995.00
AGS
Crime
$895.00
AGS
Climate
$495.00
D&B
Data
$1,495.00
D&B
Data
with
Contact
Information
$3,995.00
Research360 - Converting Data into Decisions 866.419.8509
8.
Federal
Funding
$2,495.00
Patents
$1,495.00
Venture
Capital
$1,295.00
Occupation,
Employment
&
Wages
$2,995.00
Industry
Data
$1,995.00
Research
Packages
Research360
Advantage
$7,995.00
Research360
Innovation
$9.995.00
Research360
Analyst
$12,495.00
For
additional
information
contact:
Chuck
Branch
Decision
Data
Resources
15
Office
Park
Circle
Suite
210
Birmingham,
AL
35223
205.871.0353
cbranch@decisiondata.net
Richard
Seline
National
Regional
Data
Consortium
1250
24th
Street
N.W.
Suite
300
Washington,
DC
20037
202.466.0566
rss@data-‐consortium.com
Research360 - Converting Data into Decisions 866.419.8509