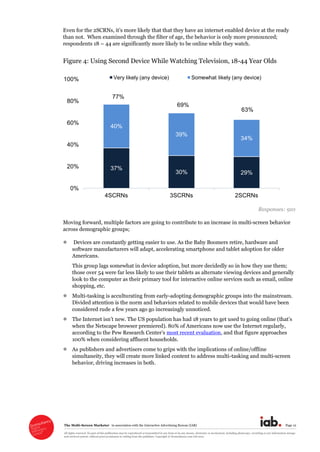
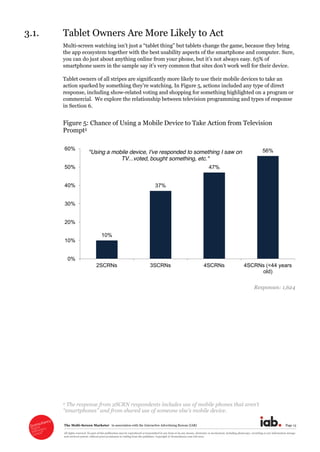
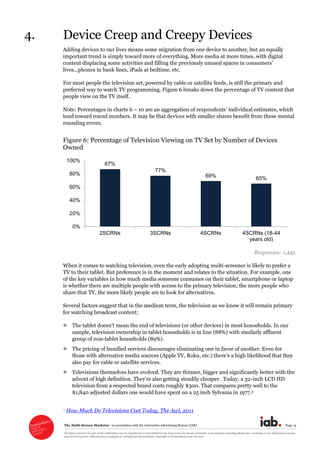
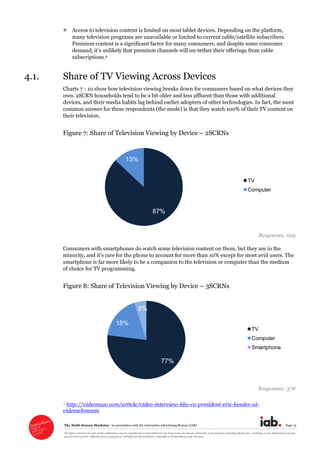
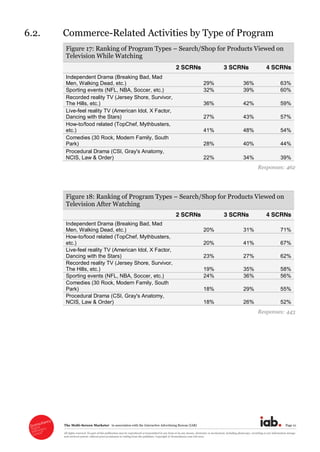
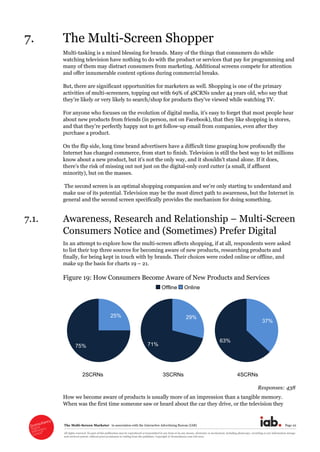
This document discusses research from a study on modern viewing habits called "The Multi-Screen Marketer". The study found that multi-tasking across devices while watching TV has become common, with over 60% of smartphone users and 65% of tablet owners reporting doing so. Younger age groups are more likely to multi-task. Tablet owners are more likely to take actions like purchasing in response to ads. However, consumers find mobile apps and sites from media companies unsatisfying. The rise of smartphones and tablets indicates multi-screen behavior will continue to increase as these devices become more prevalent.
![The Multi-Screen Marketer in association with the Interactive Advertising Bureau (IAB) Page 17
All rights reserved. No part of this publication may be reproduced or transmitted in any form or by any means, electronic or mechanical, including photocopy, recording or any information storage
and retrieval system, without prior permission in writing from the publisher. Copyright © Econsultancy.com Ltd 2012
4.2.
As consumers diversify how they watch, w
could be directly connected through a cable provider, or the
Internet, or might simply be
television programming that might be watched in its complete form when broadcast, or be time
shifted with commercials curtailed or accessed via a service such as iTunes, with no advertising.
The television set its potential. As with many
new offerings ures of so- onnected Over time, that
will change, and we asked consumers about their vision for how television will operate.
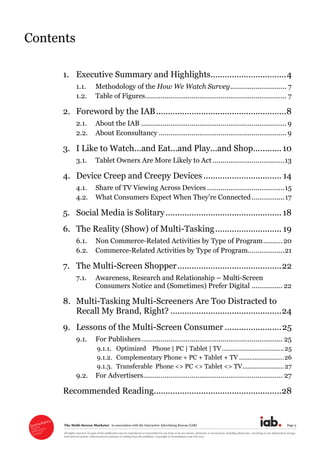
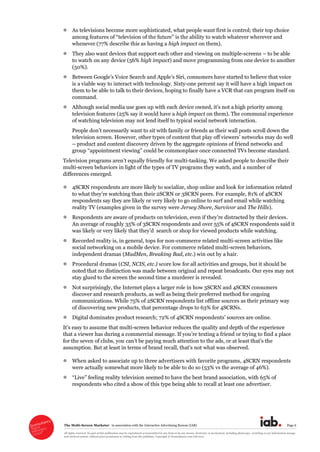
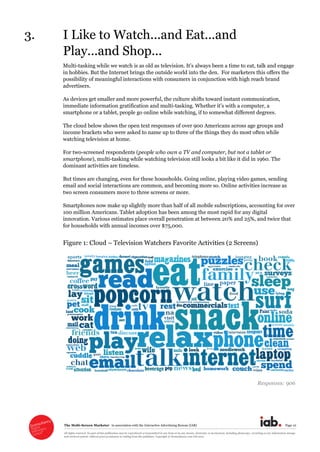
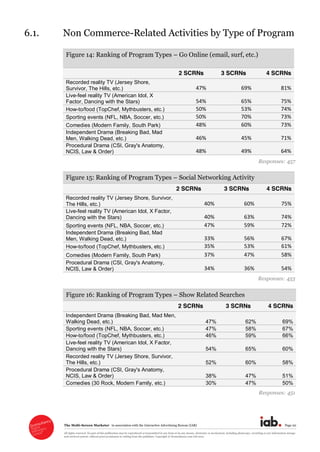
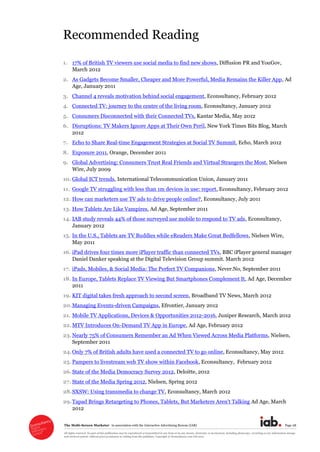
Figure 11: Impact of Features Expected in Future Televisions
Responses: 955
The top preference is for a change in how media providers do business;; consumers naturally
want to be able to watch anything at any time.
effective voice recognition is
expected to have a significant impact. Complexity is a major factor in the slow adoption of
connected
to use voice and motion controls to access the more powerful functions of connected TVs may
well unlock their use for the mass market.
The multi-screen experience is also important to consumers. Among the top three most
lowed by the ability to
They also see a world where devices talk to one another where tablets act as remotes ( Siri,
Bill Murray, before he went meta ) and where they can identify
products of interest using a mobile device to point at them.
The implication is that consumers expect to use multiple, complementary d
not doing so now. Smartphones are headed to ubiquity and tablets are rapidly moving beyond
young, early adopter to becoming a household staple, so the market for this movable feast of
content will only expand.
25%
36%
42%
47%
50%
56%
61%
77%
0% 30% 60% 90%
[Ability to] use the television to easily access
and interact with social media
[Ability to] use the television to easily access
and interact with websites
[Ability to] buy anything I see on TV by
pointing at it with mobile device
[Ability to] use tablet/mobile device as a
remote control for everything
[Ability to] move programming from one
device to another mid-show
[Ability to] watch on any device
[Ability to] talk to my TV and accessories and
tell them what to do
[Ability to] watch anything I want when I want
it
(% responding feature will have an impact on them)](https://image.slidesharecdn.com/5eb43cca-18ce-4370-8800-dbf486660c8f-150313085127-conversion-gate01/85/Research-Survey-Multi-Screens-FINAL-5-17-12-17-320.jpg)
![The Multi-Screen Marketer in association with the Interactive Advertising Bureau (IAB) Page 29
All rights reserved. No part of this publication may be reproduced or transmitted in any form or by any means, electronic or mechanical, including photocopy, recording or any information storage
and retrieval system, without prior permission in writing from the publisher. Copyright © Econsultancy.com Ltd 2012
30. , Econsultancy, April 2012
31. The big tip for 2012: convergence is here, Econsultancy, January 2012
32.The Magic of Doing One Thing at a Time, Harvard Business Review, March 2012
33.The Tablet-TV Connection, Forrester Blogs, April 2012
34.Time Inc. Study Reveals That "Digital Natives" Switch Between Devices and Platforms Every
Two Minutes, Use Media to Regulate Their Mood, Time Inc, April 2012
35. Time Warner Cable, Comcast and the End of TV as We Know It, Ad Age, April 2011
36.Toluna C&M Social Media Marketing Best Practice Guide, Constant Motion / Toluna,
February 2012
37. TV and search: associative marketing in a two-screen world, Econsultancy, November 2011
38.TV's Digital Age Will (Truly) Arrive In 2017, Ad Age, January 2012
39.Video Perceptions Survey, Discovery Research, January 2012
40.Welcome to the Digital Living Room, [Infographic] High Table, January 2012
41. What is social TV? Not Google TV or YouTube says NBC rep, Econsultancy, February 2012
42.What you need to know about interactive TV, Ad Age, February 2012](https://image.slidesharecdn.com/5eb43cca-18ce-4370-8800-dbf486660c8f-150313085127-conversion-gate01/85/Research-Survey-Multi-Screens-FINAL-5-17-12-29-320.jpg)


