Outlin
e
Brief overviewof research process
Role of supervisor
Components of research proposal
Title
Statement of the problem
Objectives/Hypothesis
Literature Review
Methodology
Research funding
Checklist for evaluating proposal
Results and Discussion
Conclusions and Recommendations
References
How does researchstart and end?
Research begins when a researcher
identifies a research
problem/question
Ends with a
solution/answer
5.
No Steps Phase
1Identifying the Topic area
2 Formulation of research
problem
3 Formulation of objectives and
hypothesis
4 Designing Research
5 Developing a research
proposal
6 Collection of data
7 Data Management and
analysis
and Interpretation
8 Reporting
PREPARATORY
PHASE
IMPLEMENTATI
ON
The Research process
What is aresearch proposal?
Document proposing a research project
Statement of intent
Three key components
1. What you plan to research (i.e. your research topic)
2. Why it is important (your justification)
3. How you plan to investigate (your practical
approach).
Purpose: convince your research
supervisor, university board
1. Suitable (for the requirements of the degree
program)
2. You have the Expertise
3. Manageable (given the time and resource
constraints you will face)
8.
Importance of aresearch
proposal?
PROPOSAL IS A SERIOUS MATTER
A GOOD THESIS HINGES ON A GOOD
PROPOSAL
A GOOD JOURNAL ARTICLE HINGES
ON A GOOD PROPOSAL
9.
Importance of aresearch
proposal?...
1. Makes your intentions known
2. Provides justification for funding
3. Guides research throughout
4. Allows you to plan and identify steps
that will be undertaken in the research
study
5. Helps you to determine time and
resources needed
10.
Characteristics of agood
research proposal
1. Adequate background information: Have
sufficient information to convince your readers that
you have an important research idea
2. Clear Research problem: Justifies the need to carry
out the study
3. Relevant Literature: Show good good grasp of the
relevant literature and the major issues
4. Adequate Resources: Show that that you have
the competence, work-plan and resources to
complete it.
5. Achievable objectives: Proposal must state what you
plan to accomplish, why you want to do it and how you
are going to do it.
11.
Characteristics of agood
research proposal …
6. Continuity among sections of the
proposal: Show continuity among proposal
sections; objectives must logically conclude
the introduction and justification
7. Clear objectives: Objectives must be
few, clearly stated and lead to well worded
hypotheses
8. Testable hypothesis: Hypotheses must
be stated such that treatment selection and
important measures are obvious
12.
Characteristics of agood
research proposal …
9. Clear methodology: Methodology
must be related to the objectives and
individual working hypotheses:
methodology should clearly show how
each objective will be achieved.
10. Written properly: Quality of your
proposal writing matters. Your writing
should be coherent, clear and compelling
13.
Components of aresearch
proposal
Note: Components may differ based on your
discipline Always check for format and structure
with your Department and University
14.
Components of aResearch Proposal
1. CHAPTER ONE: INTRODUCTION
• Background
• Statement of the Problem
• Research Questions
• Research Objectives
• Research Hypotheses
• Significance/justification of the study
•Conceptual or Theoretical
Framework CHAPTER TWO: LITERATURE
REVIEW CHAPTER THREE: MATERIALS
&METHODS
Preliminary
pages Title
Declaration
page
Abstract
Table of
contents
Reference
s
Appendice
s
Workplan
Budget
Front
matter
Back Matter
Middle
15.
Start Here
(Topic)
SUPERVISOR
Write andPresent Proposal
Collect
Data
Analyse Data and write Report/Thesis
Journal Articles
Examinatio
n
The Role of Supervisor
16.
Role of yourAcademic supervisor
Faculty will appoint academic supervisory
team consisting of two supervisors or more
Roles
1. Coach, mentor, trainer
2. Guide and advice
3. Help refine your proposal by asking you critical
questions
4. Help develop appropriate plans, design and
strategies
5. Guide you on suitable literature
6. Connect you to other researchers
Always remember, you are the driver of
your research project
17.
Role of supervisor
Students: Concern: delays in response
by supervisors
Supervisors: Concern: Students
failure to attend comments within
given time
CULTIVATE A HEALTHY
RELATIONSHIP WITH YOUR
SUPERVISOR
18.
Characteristics of aSupervisor
Expert in your academic field
Has experience in research
Most cases have supervised
other students
Check and review your
progress
19.
Integrating in-situ rainwater harvesting
and organic manure for improved soil
moisture and maize yields in Ebonyi State,
Nigeria
A research proposal submitted in partial
fulfillment for the award of the Doctoral
Degree of Master in Food Value Chain
Management…………in the Faculty of
Agriculture of Alex Ekwueme Federal
University, Ndufu-Alike, Nigeria
Titl
e
Rubri
c
Title page: has Title and Rubric
20.
Title
Concise andappealing
Not more than 20 words, “Avoid filler
words” (eg An investigation of …..A study
of..)
1. Specific and informative
2. Nature of the study
3. Principle species involved
4. Geographical location
21.
What informs thetitle in proposal?
Content of the proposal should
be reflected in the title
Start with a tentative title and write
final title after proposal is complete
22.
Examples of goodtitles
Integrating in-situ rain water harvesting
and organic manure for improved soil
moisture and maize yields in Ebonyi
State, Nigeria (19 words)
Identify nature of study,
species involved and
geographical area
23.
Examples of goodtitles
1. Adoption intensity, perception and
profitability of organic based soil
fertility management technologies in
Southeast, Nigeria (15 words)
2. Farmers Perceptions and adoption of
micro catchments for Agroforestry
Trees establishment in South-south
Zone, Nigeria (15 words)
24.
Abstract
One paragraphsummary of the proposal
(250 to 300 words)
Write it last
Should contain
Overview of the problem (one to
two sentences
Objectives of the study (write
completely)
Methodology (data collected,
how collected+analysis)
Outputs/Significance (one to two
sentences)
25.
Background
Topic ofinterest
global, regional and national overview of
the research topic is briefly discussed.
Flow from broad to specific – narrow a broad
area into a manageable problem
Contain
Brief overview of the problem
Rationale for choosing this problem
Magnitude of the problem: use
numbers or figures to show the extent
of the problem
Review of the other work carried on the
subject with authoritative citations
26.
Background
Background shouldbe organised under:-
(i) Globally, what key debates and (gaps)
exist
(ii) Regionally, what key debates (and
gaps) exist
(iii) Nationally; (The research problem is
found here)
BROAD TO SPECIFIC (FUNNEL SHAPE)
Statement of theproblem (SOP)
Nerve centre of any research
SOP clearly describes the research
problem already identified
Brief description of the issue, difficulty,
problem that will be addressed in the study
Summarizes “the context for the study”
by briefly describing the problem and
clearly showing the knowledge gap
SOP should be brief and precise (Not more
than 2 paragraphs)
29.
What is Knowledgegap?
Gap/void that the research intends
to close.
Unknown or poorly understood
Gap provides direction and clarifies
what is to be investigated
31.
Deficiencies What ismissing?
What is not Known?
What do we need to know?
Intent of study/ What is the purpose?
Research objectives
Link between Statement of the
Problem (SOP) and objectives
32.
Components of statementof the
problem
Subject area
Topic
Research problem Issue of concern, Problem
Controversy
Difficult situation
Evidence for the
issues
Literature
Practical
experiences
Statistics
Deficiencies What is missing?
What is not Known?
What do we need to know
Intent of study/ What is the purpose?
33.
SOP Example
• Themajor development goal of Ebonyi IFAD-
VCDP is to increase production of rice by
providing high yielding varieties to farmers
(Topic).
• Over the years, IFAD-VCDP has made concerted
efforts to facilitate promotion of improved
varieties of rice.
• Recent studies, however, report low adoption of
the varieties (Research problem).
• Estimates indicate that currently, only about
40% of the smallholder farmers are using the
improved varieties.
• In addition yields are low averaging 0.5 tha-1.
(Evidence and justification).
• Factors responsible for these low adoption are
not clearly understood (Deficiency).
• The purpose of this study is to determine
factors influencing adoption of improved rice
34.
SOP example
1
Agricultureis the main economic activity for people
living in Lafia LGA, Nasarawa State, Nigeria.
Yam production is dominated by cassava (Topic).
Despite widespread preference for the crop, reports
from the district agricultural office indicate that the
productivity of yam is very low (Research problem).
Farmers get less than 40% of the potential yield and
most households in this region are food insecure.
Production constraints and poor farming methods are
some of the factors that affect crop production in
other regions (Ref) Evidence and justification.
Factors causing low yam production are not clearly
understood (Deficiency).
The purpose of the study is to determine the factors
contributing to low productivity of yam in Lafia
(Intent/purpose)
35.
Example of problem
statement(Exercise)
The humid highlands of southern Nigeria are characterized
by high population pressure, coupled with a growth rate of
about 2.9%, therefore rising demand for more food (Topic).
Production of more food is constrained by declining soil
fertility and the high costs of inorganic fertilizers. (Research
problem).
Emerging evidence indicate that integrated soil fertility
management involving the judicious use of combinations of
organic and inorganic resources is a feasible approach to
overcome soil fertility constraint and increase yields within
the smallholder farms. (Evidence and justification)
The major obstacle hindering their use by farmers is lack of
proper guidelines on their use. This is because there is
limited understanding of their effect on crop yields and soil
characteristics in this region.
Further, the small scale farmers are heterogeneous in terms
of their household and farm characteristics and there is
limited information on how these factors influence
adoption of new soil fertility management options.
(Deficiency).
This study will therefore evaluate the effect of organic and
inorganic inputs on yields and soil properties as well as
factors that influence adoption of an integration of organic
and inorganic inputs by smallholder farmers of
36.
Research objectives
Statementindicating what is to
be achieved
Map the pathway for
the investigation
Mantra (Objective
drive the study)
37.
Stating the hypothesis
Should be stated using action
words
Action words are used
To determine
To examine
To evaluate
To assess
To compare
Avoid: To understand, To study
38.
Examples of poorly
stated
objectives
To evaluate four mango varieties
To determine effects of soil
fertility decline
To evaluate food security
To evaluate the effect of
market liberalization
These objectives are incomplete…
lacks variables
39.
Main objective andspecific
objectives
Main objective (aim); overall
statement of the thrust of your study
The main objective is broken down
into small logically connected parts
to form specific objectives
Close to Title
Issue of concern with students: Main
objective fails to match with the
specific objectives
Example of generalobjective and
specific objectives
General Objective
To evaluate the influence of communication on uptake of
integrated soil fertility management and soil water
conservation technologies by farmers in Kebbi State,
Nigeria
Specific objectives
1. To assess farmers’ perceptions of the effectiveness of
selected communication channels for disseminating
information on combined organic and inorganic
fertilizer, mulch and zai pits technologies;
2. To determine socioeconomic factors influencing farmer’s
level of knowledge on the use of combined organic and
inorganic fertilizer, mulch and zai pits technologies;
3. To establish the influence of information packaging on
uptake of
combined organic and inorganic fertilizer, mulch and zai
pits technologies;
4. To assess the effect of communication factors on uptake
of combined organic and inorganic fertilizer, mulch and
zai pits technologies.
Descriptive objectives
1. Todescribe the types of horticultural crops
grown by farmers in Region A
2. To characterize farmers participating in collective
marketing of Avocado in Region B
3. To find out the opinion of farmers about
availability of markets for bananas in Region
C
4. To determine nitrogen fertilizer equivalency
values of Tithonia diversifolia, Senna
spectabilis and Calliandra calothyrsus
Weak objectives: Difficult to publish; does not
appeal to
international audience
44.
Causal objectives
1. Toinvestigate the effect of organic,
inorganic, and combined N sources
on maize yield and nitrogen use
efficiency
2. To determine the effects of different
soil- incorporated organic inputs on
soil chemical properties and maize
yields
Clear independent and dependent variables
Strong objectives: Easy to publish, comparisons
and relationships
45.
Comparative Objectives
1. Todetermine socio-economic factors
influencing utilisation of rain water
harvesting and saving technologies in
Zamfara State, Nigeria.
2. To determine household and farm
characteristics influencing farmers’ decision
to adopt or not to adopt introduced
integrated soil fertility replenishment
technologies
Use causal-comparative design; Compares two
groups Assumes cause effect relationship
Examples of researchquestions
(Biophysical)
🞂 What are the effects of the
different soil-incorporated organics
(with and without inorganic
fertilizers) on soil chemical
properties and maize yields?
🞂 What is the magnitude of N
leaching following different soil
fertility amendment options in
varied soil fertility status?
48.
Causal objectives
1. Toinvestigate the effect of
protein supplemental diets on
milk yields of dairy cows
2. To assess the effect of nitrogen
levels on growth and yield of
fodder sorghum
Identify the independent and
dependent variable
49.
Examples of researchquestions
(Social)
1. What are the farmers perceptions towards
collective marketing of tissue culture
bananas?
1. Descriptive
2. What is the impact of farmers adopting
tissue culture bananas on annual income?
1. Assumes cause effect relationship
3. What socio-economic factors influence
adoption of tissue culture bananas by
farmers in region A?
1. Relationship based; Predictive
50.
Hypothesis
A researchhypothesis is a statement
of expectation or prediction that will
be tested by research
Educated guess
Proposed explanation
51.
Characteristics of agood hypothesis
1. Clear: States clearly and concisely the researcher's
expectations concerning the
relationships/differences; between the variables in
the research problem
2. Measurable Variables: Defines the selected
variables in operational and measurable terms
3. Testable and verifiable ; methods available to
collect data
4. Data availability: Possible to support or not
support hypothesis by collecting and analysing
data
5. Logical: Gives logical arguments to justify
hypothesis
6. Consistent with Theory: Consistent with the
existing body of knowledge
52.
Null and
Alternative
1. Nullhypothesis (Ho):
Assumes and states no relationship
between the independent and
dependent variables
No differences in means
Most valuable: tested using
statistical analysis
2. Alternative hypothesis (HA):
opposite of the null hypothesis. states
there is a difference
53.
Null and
Alternative
NULL
Feedinggoats with supplemental
diet of fodder trees has no
significant effect on milk
production
ALTERNATIVE
Feeding goats with supplemental
diet of fodder trees
significantly increases milk
production
54.
No differencein incomes between
farmers participating in milk
cooperatives and non participants
Farmers participating in milk
cooperatives have significantly higher
annual incomes than non participants
55.
Objective and hypothesisare
related
Objective: To evaluate the effect of
different levels of Nitrogen on growth
and yield of fodder sorghum
Null hypothesis
Different levels of nitrogen cause no
significant effect on growth and yield
of fodder sorghum
No difference in growth and yield of
fodder sorghum among different levels
of nitrogen
56.
Significance of thestudy
Provides an explanation of who will
benefit with the outcome, how they will
benefit and therefore links the research
to the end users.
In Agriculture stakeholders mainly
include;
Farmers
Policy makers
Extension agents
Other scientists
57.
Significance of thestudy
What is the expected end
product?
How will the results be used?
Who will benefit from the
results?
How does it stand to inform
policy?
How is it significant to our body
of knowledge?
Why should a donor support it?
58.
Example 1; Significanceof the
study
This study will provide information on
most effective ways of disseminating soil
fertility management technologies. The
information will be most useful
to the stakeholders in agriculture sector
(policy makers, extension, researchers)
who will use it to improve communication
channels for scaling up soil fertility
management on smallholder farms.
Improved communication should increase
adoption of soil fertility management
technologies that will result in increased
crop production and contribute to
reduction of extreme poverty.
59.
Example 1: Significanceof the
study
The information generated from the study
will provide useful feedback and
recommendations to the farmers and the
extension agents on implementation of water
harvesting technologies. In addition, the
findings of the study will provide an insight to
policy makers, government institutions and
other development agencies in planning,
designing and implementing future
programmes geared towards water
harvesting. Also, this study
will provide reference material for further
research.
61.
Conceptual Framework
CFis the schematic diagram
which shows;
variables in the study
concepts under study and
their relationship.
independent and
dependent variables
Hypothesized relationships
are explained in the text
62.
Importance of CF
Presentsthe BIG PICTURE
House for the research problem
Provides links Problem
and interventions
Proposed relationships
helps researcher
organise thinking
63.
CF
Keeps theresearch on track by;
Helping the reader to quickly see the
proposed relationships
Provides clear links from literature to
the research goals and questions
Contributes to trustworthiness of the
study
helps researcher organise her or his
thinking and complete an investigation
successfully.
It is like a building a house for the
research problem
64.
y.
Introducti
o n and
disseminat
ion of
water
harvesting
technologi
es.
Demographic
characteristics
-Gender and
age of
household head
- Size of
househol
d
Socio-
economic
characteristics
-education
level of
household
head
-Role of
extensio
n
agent
s
- availability of
off farm
income
- ability to
hire labour
Farm characteristics
- Farm size
-farm ownership
-agri rural
development
policies
-Social and
cultural factors
-Farmers’ access
to credit
-Farmers’
involvement
in group
activities
Awareness
/
knowledge
of water
harvesting
technologi
e s
Formatio
n of
attitude
and
perceptio
n
technolo
gi es
Adoptio
n
behavio
r
decisio
n
ADOPT
REJECT
NOT-ADOPT
65.
Stakeholders’ participation
•Ministry ofagriculture
•Input suppliers
•NGO’s
•CBO’s
•Policy makers
Researcher soil fertility options
Mineral
fertilizer Green
manure Crop
rotation
Legumes
Erosion control
measures
Communication pathways
Face to face communication
Electronic communication
Publication
Demonstration
More improved technologies suited
for farmers’ needs are generated
-Increased agricultural production
-Reduced poverty
-Increased environmental
benefits
Adoption of soil
fertility technologies
Farme
r
1 3
6
5
2
7
8
4
66.
Tips on CF
CF should always be explained clearly
in the text
Give citations of all concepts and
theories
Caption: always at the bottom of
the figure
Excellent Computer skills
67.
Theoretical
Framework
● The theoryprovides a point of focus for
attacking the unknown in a specific area
● If a relationship is found between two or
more variables a theory should be
formulated to explain why the relationship
exists
▪ Theories are purposely created and
formulated, never discovered; they can
be tested but never proven
● It consists of theories that seem to be
interrelated.
● More formal and used for studies
based on existing theories.
68.
Purpose of Theoretical
Framework
●To test theories
● To make research findings
meaningful and generalizable
● To establish orderly
connections between
observations and facts
● To predict and control situations
● To stimulate research
69.
CHAPTER 2: Literaturereview
Generally helps you to;
Know what has been done
Deepen theoretical understanding of the
topic
Identify research gaps
Refine variables and procedures
Give credit to past authors
Borrow suitable methodology and
approaches
Literature review (Researcher) is for you
and readers
70.
Criteria for diagnosingthe
contents of existing literature
relevant to your research
• What has been done on the subject?
• What is already known?
• What is the utility value, soundness
and validity of data in existing
literature?
• What information is relevant to the
study?
• How can the proposed research build
upon or add to what is known?
71.
Literature review
Veryimportant
Secret to Good Research
Selective and Critical review of written
works
Librarian (First Search engine)
Information literacy classes by Library
How to get literature
How to organisze
How to cite
How to use file management system
(Zotera, Mendeley)
72.
Literature review…
Manysources of literature
Review literature
Synthesize and identify knowledge
gaps
Do not just report findings BUT
An analysis of the information to reveal
the gaps that need attention and also to
show how existing literature ties in
with objectives of the proposed study
LITERATURE REVIEW
2.1 Overview
2.2 Soil Fertility Management Technologies
2.3 Communication Strategy and Knowledge
Sharing
2.4 Participation of stakeholders in
dissemination of research outputs
2.5 Social Economic Factors that affect farmers’
preference on communication methods
2.6 Scaling Up soil fertility
Enhancing Communication for Effective up
Scaling of Soil Fertility Management
Technologies in Meru South and Mberee South
Districts in Kenya
75.
Quality of resourcesof
literature
Books
Thesis and dissertations
Peer reviewed journal articles
Non-reviewed journal papers (Be careful…
Predatory)
Technical reports
Newspaper
Professional magazines
Recordings
Online articles
Annual reports
Government policies/plans/strategies
Working papers
Discussion papers
76.
Notices the difference
-Paraphrase (express someone else’s
idea in your own words)
- Summarize (express someone else’s
idea in a reduced form in your
own words)
- Quote (express someone else’s idea
in their exact words)
- Copy (reproduce a diagram, graph or
table from someone else’s work).
78.
Steps to Conducta
Literature Review
Step 1: Identify Key Terms or
“Descriptors”
•Extract key words from your
title (remember, you may
decide to change the title later)
•Use some of the words other
authors reported in the literature
•Scan both electronic and library
journals from the past 10 years and look
for key terms in the articles
79.
Steps to Conducta Literature
Review
Step 2: Locate Literature
● Search different types
of
summaries, encyclopedias,
and glossaries of terms,
literature:
dictionaries
handbooks,
statistical indexes, reviews and syntheses,
electronic sources,
books, journals, indexed
abstract
publications,
series,
and
databases
80.
Steps to Conducta Literature
Review
Step 3: Critically Evaluate and Select
Literature
● Rely on journal articles published
in national journals
● Prioritize your search: first look
for refereed journal articles, then, non-
refereed articles, then books, then
conference papers, dissertations and
theses and then papers posted to websites
● Look for research articles and avoid
as much as possible “opinion” pieces
● Blend qualitative and
quantitative research in your review
81.
Steps to Conducta Literature
Review
Step 4: Organize the Literature
● Create a “file” or “abstract” system
to keep track of what you read. Each
article you read should be summarized in
one page
● Study-by-study
summary of each
Review:
study
a detailed
under a broad
theme is provided. Link summaries (or
abstracts) using transitional
Must be organized and flow
sentences.
coherently
under various subheadings. Avoid
quotations (i.e., lengthy chunks of
string
text
directly quoted from a source)
82.
Steps to Conducta Literature
Review
Step 5:Write a Literature Review
• Types of Reviews:
● Thematic Review: a theme is identified
and studies found under this theme are
described. Major ideas and findings are
reported rather than details.
● Review in chronological order
● Review across countries
83.
Chapter 3: Methodology
Purpose
Provides a description of the exact
(specific) actions, plan, or strategies to be
used to achieve the research
objectives
Link each of the specific objectives to the
methods so as to account for all activities
of the project
84.
Chapter 3: Methodology
Concernfrom supervisors
Link each variable you will measure
to methods, apparatus,
instruments and procedures to be
used
The Research Methods should be
detailed enough to let the reader decide
whether the methods you intend to use
are adequate for the research at hand
85.
Definition and Componentsof
Research Design
● A research design is the arrangement of
conditions for collection and analysis
of data in a manner that aims to
combine relevance to the research
purpose with economy in procedure.
● It is the conceptual structure within which
research is conducted;
● It constitutes the blueprint for the
collection, measurement and analysis of
data.
86.
Con
t…
➢ The strategyspecifying which
approach will be used for gathering and
analyzing the data.
➢ The time and cost budgets since most
studies are done under these
two constraints.
❖In short, research design consists of:
➢ The plan that specifies the sources and
types of information relevant to
the research problem.
87.
Description of thestudy
area
● Brief description of the study area
or study organizations or sampling unit.
● It provides information about
the characteristics of the study
areas as population,
location, climate,
socioeconomic activities etc.
● In case you are studying
about institutions, information
concerning target institutions is
inevitable. Such information may
include organizational structure,
mandates of respective institutions,
establishment laws etc.
88.
Census and sampling
survey
●A complete enumeration of all items
in the ‘population’ is known as
a Census.
◦All items in any field of inquiry is a
population or universe.
● Under census, the assumption is
that no element is left and
highest accuracy is obtained.
89.
Con
t…
Sample
selected
respondents
from
the
can be
population.
● Therespondents selected should be
as representative of the
total population as possible.
● The selected respondents
constitute what is technically called a
‘sample’ and the selection process
is called ‘sampling technique.’ The
survey so conducted is known as
‘sample survey’.
90.
Sample is
defined
❖ Asample is a subset, or some part, of a larger
population.
◦ A larger population could be
anything out of which sample is taken.
◦ A complete group of entities sharing
some common set of characteristics is
population.
❖ Why sample?
◦ Saves Cost, Labor, and Time
◦ Quality Management/supervision
◦ Accurate and Reliable Results
◦ Sampling may be the Only Way
91.
Cont
….
● Target population
isthe complete
◦Target
population group
of
specific population
elements relevant to the
research project.
◦Target population may also be called
survey population i.e. that
aggregation of elements from which
the survey sample is actually
selected.
92.
Sampling …..
❖Sampling
◦Sampling isthe process of selecting a
small number of items or parts from a
larger population to make conclusions
about the whole population
❖Sampling frame
●A
sampling frame is the list of
elements from which the sample may
be drawn.
●A
working population because
sampling frame is also called the
it
provides the list that can be worked with
operationally.
93.
Sampling unit
● Asampling unit is that element or
set of elements considered for
selection in some stage of sampling.
● Sampling may be done in single stage
or in multiple stages.
◦Single-stage sample, the sampling
units are the same as the elements.
◦In more complex samples, however,
different levels of sampling units may
be employed – the case of clustering
or stratified techniques
94.
Or
● is theunit to be
Sampling unit
studied.
● Sampling unit can be
-
-
-
-
Geographical unit as state
Construction unit as a house, flat
etc
Social unit as family, club, school
Individual
● The researcher will have to decide one
or more of such units
95.
Parameter
● A
parameter isthe summary
description of a given variable in
a
population.
◦The mean income of all families in a
city and the age distribution of the
city’s population are parameters.
● More precisely, parameters is the
characteristics of a POPULATION.
Non-probability Sampling
Techniques
● Non-probability
(Non-random/Judgment)sampling is
a sampling method where personal
knowledge and opinion play major
role in identifying which elements of
the population are to be included in
the sample,
● The probability of an element from the
population to be included in the sample
is not known.
98.
A. Quota Sampling
●Quota sampling:
is procedure which
ensures
a
sampling
that
certain
characteristics of a population sample
will be represented to the exact extent
that the researcher desires.
● Given characteristics may be male
and female, under age 30, ages 30 to
60, over 60 etc then decides how
many to get in each category.
● Thus, the number of people in
various categories of the sample is fixed.
99.
Cont….
way of selectinga
● Advantages
◦ Inexpensive
sample
◦ Sampling frame is not needed
◦ Guarantees inclusion of target groups
● Disadvantages
◦ Sample is not a probability one
(no generalization)
◦ Accessible respondents might
have
unique characteristics
◦ In some cases selection cannot
be guided by visible characteristics.
100.
B. Convenience/ Accidental
Sampling
●Convenience/Accidental sampling
involves choosing the nearest and
the
most convenient persons for
researcher
consideration is ease of
● The main
access
to
population and not
selection of respondents.
● Selection continues until
required number of respondents is
contacted.
101.
C. Purposive sampling
●In this sampling technique, a
researcher purposively selects people
who she/he believes have the
required characteristics needed for
the study. For example a researcher
is study on
factors
conducting a
contributing to poor performance in
Mathematics might lead him to select
teachers who teach Mathematics.
102.
D. Snowball (Network)
Sampling– chain sampling
◦This is a method for identifying and
selecting the cases in a network.
◦It is based on an analogy to a
snowball.
➢ It begins with one or a few people
or cases and use them to
establish contact with others.
➢ You start with one or
two information-rich key informants
and ask them if they know persons
who know a lot about your
topic of interest.
103.
Cont….
● This groupis then used to locate
others who possess similar
characteristics and who, in turn, identify
others.
◦ For example, if a researcher wants to
get information about people who
are HIV positive then the researcher
can use this kind of sampling.
104.
Cont…
● Advantages
◦Useful ifyou do only know little
of
the group you wish to study
◦Good for studying e.g. communication
patterns, decision-making, or diffusion
of information
● Disadvantages
◦ Difficult for larger samples
◦ Choice of entire sample rests
on choice of first individuals (bias)
105.
1. Probability Sampling
Probabilitysampling technique is a sampling
method whereby all items (i.e., each
element) in the population have a
chance of being chosen in the sample
❖the probability of each element of the
population included in the sample
is known.
❖When to use?
◦Probability sampling designs are used
when the representativeness of the
sample is of importance in the
interest of wider generalizability.
106.
A. Simple RandomSample
● This method is also known as
chance sampling or probability
sampling
● In this method, each and every
item in the population has an equal
chance of inclusion in the sample.
● This is performed through lottery.
107.
B. Systematic sampling
●In this sampling, an element of randomness
is usually introduced by using random
numbers to pick up the unit with which to
start.
is useful when
sampling listing) is
available in
the
● This procedure
frame (source
form of list.
● Systematic sampling is method of selecting
sample in which an element in the sample is
obtained by taking every Kt h element on a
list of all elements in the population.
● To determine which of the first K elements is
chosen, a number from 1 to K is chosen at
random.
108.
Example
● Suppose thatthere are 1000 resident
or households in one village with
different income levels. If the
researcher has the list of all
households randomly listed and wants
to study the income disparity in that
village by taking 50 samples?
◦instead of a list of random numbers,
the researcher calculates a sampling
interval.
The sampling interval is the standard
distance between elements selected
in the sample.
109.
C. Stratified sampling
●If the population from which a sample
is to be drawn does not
constitute homogenous group,
then stratified sampling technique is
applied so as to obtain a
representative sample.
The population is divided into strata
and random sample is taken from
the elements in each stratum.
110.
Because
● When the
population
heterogeneous,the
random sample may
is
use of simple
not produce
representative sample. Some of the
bigger strata
representation
small ones entirely
may get over
while some of the
may be
eliminated.
❖Why strata?
● In order to sub-divide
heterogonous population into
a relatively homogenous groups
within the strata
111.
Cont…
The reasons forstratifying
❑ To increase a sample’s
statistical efficiency (smaller standard
errors).
❑ To provide adequate data for
analyzing the various subpopulation.
❑ To enable different research
methods and procedures to be used in
different strata.
● Can be multiple stage stratified random
sampling
● E.g., in the household survey we may be
interested to have sufficient number
of households from each region of
Ethiopia; stratify by region!
112.
Cont….
How to Stratify
◦Threemajor decisions must be made in
order to stratify the given population
into some mutually exclusive groups.
(1) What stratification base to use:
stratification would be
under
on
the such
as
principal variable
income, age, education,
based
study
sex, location,
religion, etc.
113.
Cont…
(2) How manystrata to use: there is no precise
answer as to how many strata to use.
◦The more strata the closer one would be to
come to maximizing inter-strata
intra-strata
differences and minimizing
variables.
(3) What strata sample size to draw: different
approaches could be used:
One could adopt a proportionate
sampling procedure.
Or use disproportionate sampling, which
allocates elements on the basis of some
bias.
114.
D. Cluster sampling
❖Cluster sample: Is useful when
o It is difficult or costly to develop a complete list
of the population members or when
o The population elements are widely
dispersed geographically.
●Cluster methodology basically leads to less
efficient estimates (bigger confidence
intervals, for a given sample size) but the
larger sample size can offset this.
●Population divided into clusters, e.g.
regions of the country
●Only some of the clusters sampled. This
reduces cost, possibly substantially
115.
Determining the sample
size
❖Researchdesigns with too small sample
size are not good especially for
quantitative research.
◦because they waste resources as they
can only provide anecdotal evidence.
❑ If the sample size is too small, the
data will be unusable.
❑Research studies that use too large
samples i.e., larger than needed,
also are unethical because:
❑ they waste time and
financial resources,
116.
Determining the sample
size
❖Samplesize determination hinges on:
i) Degree of homogeneity: The size of the
population variance is an important
parameter.
The greater the dispersion in the
must be to provide a
population the larger the sample
given
estimation precession.
117.
Determining the samplesize
ii) Degree of confidence
required: Since a sample can
never reflect its population
for certain, the researcher must
s/he
determine how much precision
needs.
Precision is measured in terms of
(i)An interval range (the margin
of error).
(ii)Thedegree of confidence
(how sure you are)
118.
Determining the samplesize
iii) Number of sub groups to be studied:
❑ If the research is to make estimates
on several subgroups of the population
then the sample must be large
enough for each of these subgroups
to meet the desired quality level.
iv) Cost: cost considerations have a major
implications.
❑ All studies have some
budgetary constraint and hence cost
dictates the size of the sample.
119.
Determining the samplesize
V) Prior information: If similar
previous study exists we can use
that prior information to determine
our sample size.
❑ using prior mean and
variance estimates or
stratifying the population to
reduce variation within groups.
❑samples
that
have met the
requirements of the statistical
methods from past researches.
❑Researchers use it
because
they
rarely have information on
the
variance or standard errors.
120.
Determining the samplesize
vi) Practicality: Of course the sample size
you select must make sense.
We want to take enough observations
to obtain reasonably precise
estimates of the parameters of
interest but we also want to do this
within a practical resource budget.
121.
Problems in Sampling
●Two types of errors:
Non sampling
errors Sampling
errors
1. Non Sampling errors: are biases or
errors due to fieldwork problems,
interviewer induced bias, clerical
problems in managing data, etc.
◦ These would contribute to error in a
survey, irrespective of
whether a sample is drawn or a
census is taken.
2. sampling errors are error which is
attributable to sampling, and which
therefore, is not present in information
gathered in a census.
122.
Problems in Sampling
1.Non-SamplingError: refers to
◦Non-coverage error
◦Non response error
◦Instrument error
◦Interviewer’s error
Non-Coverage sampling error: This refers
to sample frame defect.
◦Omission of part of the target
population (for instance, soldiers,
students living in campus, people in
hospitals, prisoners,
without a telephone in
households
telephone
surveys, etc).
123.
Problems in Sampling
Nonresponse error – Common in self-
administered surveys
◦This error occurs when you are not
able to find those whom you were
supposed to study.
◦Some people refuse to be interviewed
because they are ill, are too busy, or
simply do not trust the interviewer.
◦When
one
is forced to
interview an
unknown bias is
substitutes,
introduced.
124.
Problems in Sampling
Instrumenterror
◦The word instrument in sampling
survey means the device in which we
collect data- usually a questionnaire.
◦When a question is badly asked or
worded, the resulting error is called
instrument error.
Example: leading questions or
carelessly worded questions may be
misinterpreted by some researchers.
125.
Problems in Sampling
Interviewererror :
◦Enumerator can distort the results of a
survey by in-appropriate suggestions, word
emphasis, tone of voice and question
rephrasing.
◦Cheating by enumerators -with only limited
training and under little direct supervision.
◦Perceived social distance
between enumerator and
respondent also has a
distorting effect.
E.G: questions about sexual behavior
might be differently answered depending
on the gender of the interviewer.
126.
Problems in Sampling
2.Sampling Errors
◦Error which is attributable to sampling, and
which therefore is not present in a census.
◦Sampling errors can be calculated only for
probability samples.
◦Increasing the sample size is one of the major
instruments to reduce the extent of the
sampling error.
◦Sampling error is related to confidence
intervals.
● A
narrower confidence interval means more
precise estimates of the population for a given
level of confidence.
127.
Ensure data analysis
flowslogically from
objectives
Use a data analysis
matrix
Objectives Type of data to be collected Method of
data
collection
Method
of data
analysis
Dependent
variable
Independen
t variable
128.
Research funding
Researchrequires time and funds
Resources; funds, laboratory,
equipment, land etc
Faculty staff (projects)
Research organisations, NARIs,
international (IPNI/APNI)
TF: School Grant
External donors: DAAD
National Research funding
129.
Aspect Key evaluationcriteria
Background to the
study
Have you adequately described
background to
the study/problem (Tip: Relevant
authoritative
literature)
Problem
identification
Is the problem clearly articulated and
defined?
Is it brief, focussed and concise?
Objectives/hypothes
is/research
questions:
Are objectives precise and they achievable ;
Are hypothesis and research questions
suitable (Tip: do you have testable
hypothesis)
Significance of the
study
Are the expected outcomes clearly identified?
Are the benefits and beneficiaries clear?
Checklist to evaluate your proposal
130.
Aspe ct Keyevaluation criteria
Conceptual
framework
Is the big picture clear?; Are concepts, variables
logically connected with problem and objectives
Literature review Is there clear evidence of a thorough review of
the
literature? Relevant, recent
Methodology Is the research design well structured and
outlined?
Is it in line with objectives?; Are methods for
measuring each of the variables clearly
explained ?
Feasibility: Is the problem researchable and is it feasible? Do
the preliminary data and available resources
support its feasibility?
Formatting Is the proposal well structured and formatted?
Has
the research proposal been proofread and
edited (Tip: scientific writing skills)
Check list to Evaluate your proposal
131.
Principles in Writinga Research
Proposal
• The research proposal should address a research
problem that is particularly significant in the context
(scientific, policy and development) of the country
or area concerned
• The research proposal should be internally
consistent (synergy between hypotheses, objectives
and methodology) and methodologically adequate
and compatible with available resources.
• The researchers should ensure that the research
proposal includes procedures for addressing every
objective, hypothesis or research question.
• The research proposal must contain a clear
description of the theoretical base of the
methodology to be used.
• The research proposal should be presented in such
a manner that flows logically from section to
132.
Principles in Writinga
Research Proposal
• The research proposal should be in a language and
editorial style appropriate to the scientific discipline.
• The research proposal should be easily readable, with
clear and concise language.
• The research proposal is a documentation of the
scholarship, innovativeness and effort of the
researcher, so great effort and care need to be put
into developing and writing it.
• The research proposal should be self-contained and
self-recommending, and with sufficient details to
convey research intent.
• Preparing a research proposal is anything but a neat,
continuous process with well-defined steps, each of
which is completed before the next.
• The whole process is iterative, that is, the researcher
must continuously go “forth and back” adjusting
earlier sections in the context of later segments of
the proposal.
Introduction
◦ Proper datacollection, retention,
and sharing are vital to the research
enterprise.
❑ Data refers to any group of
facts,
make inferences about the problem
measurements, or observations used to
of
investigation.
◦ can range from material created in a
laboratory, to information obtained in
social- science research, such as
a filled-out questionnaire, video and
audio recordings, or photographs, etc.
135.
Introduction
❑No research projecthas unlimited funds, so
selection of the most promising data usually
is affected by the priorities of cost
and convenience.
❑ So,
design
meaningful
an
experiment and
unbiased data,
that
creates that
will not
waste resources.
❑If data are not recorded in a fashion that allows
others to validate findings, results can be
called into question.
136.
Data Collection Methods
●It is the process of gathering and
measuring information on variables of
interest in an accepted systematic
fashion.
● Data
collection
discipline
methods
data types;
vary by
but
the
emphasis
and
on ensuring
accurate
collection remains the same.
137.
Data Collection
Methods
● Consequencesfrom improperly
collected data:
❑ Inability to repeat and validate
the study.
❑Distorted, inaccurate findings.
❑Wasted resources.
❑ Misleading other researchers to
pursue fruitless avenues of investigation.
138.
Data Collection Methods
●More importantly, poor collection may
cause disproportionate harm when the
results of the flawed research are used
to support public policy suggestions.
● It is critical that researchers have
sufficient skills to ensure the integrity of
their data collection efforts.
◦ For instance: Quality data collection
requires a rigorous and detailed
recruitment and training plan for data
collectors.
139.
Data management issues
●Storage and Protection
❑ Research data must be stored securely
both during a research project and after it
ends.
❑ Risks like fire, water or other
environmental damage, or common
technical failures like hard disk crashes, must
be considered.
❑ Make backup copies of the data
periodically and store the copies in a secure
location.
140.
Data management issues
●Confidentiality
❑Confidentiality refers to limiting
information access and disclosure to
authorized users and preventing access
by or disclosures to unauthorized
persons. Policies on
❑who can handle which portion of data,
❑at what point during the project,
❑for what purpose, and so on.
141.
Data management
issues
● Integrity
❑Integrity refers to
the trustworthiness of the
information.
inappropriately,
❑Data should not be
modified
whether
accidentally or deliberately.
❑The right information is used.
142.
Data Collection
Techniques
❑ Datacan be acquired from Secondary and
primary sources or from both.
Secondary Sources of data
◦Secondary sources are those, which
have been collected by other
individuals or agencies.
◦As much as possible secondary data
should always be considered first, if
available.
143.
Data Collection
Techniques
● But,when dealing with secondary data you
should ask:
Is the owner of the data making
them available to you?
Is it free of charge? If not, how will you
pay?
Are the data suitable for
your investigation?
A description of the sampling technique,
i.e., how the sample was collected.
144.
Data Collection Techniques
Advantagesof Secondary data
Can be found more quickly and cheaply.
Most researches on past events or
distant places have to rely on secondary
data sources.
not much may be known
Limitations
◦ Authenticity:
about
genuine?
credible?
representative?
145.
Data Collection
Techniques
● Completeness:The information
often does not meet one’s specific
needs.
Definitions might differ, units of
measurements may be different and
different time periods may be
involved.
◦Data could also be out of date.
146.
Data Collection Techniques
PrimarySources of Data
Data that come into being for
the first time by the
researcher.
◦There are two approaches to primary
data collection:
the qualitative approach and
the quantitative approach
147.
Data Collection
Techniques
Triangulation
refers tothe use of more than one
approach to the investigation of a
research question in order to enhance
confidence in the findings.
The purpose of triangulation is to obtain
confirmation of findings through
convergence of different perspectives.
Why use triangulation
◦By combining
multiple
empirical materials, researchers
methods, and
can
hope to overcome the weakness or
biases and problems that are associated
with a single method.
148.
Data Collection Techniques
Taxonomyof triangulation
1. Data triangulation: Involves
gathering data at different times and
situations, from different subjects
using different sampling techniques.
◦Surveying relevant stakeholders about
the impact of a policy
intervention would be an example.
❑ E.G: Using survey data with
time series data.
149.
Data Collection Techniques
2.Investigator triangulation: involves
using more than one field researcher
to collect and analyze the data
relevant to a specific research object.
scientific experimenters to
▪ Asking
attempt
to replicate each other’s
work is an example.
150.
Data Collection Techniques
3.Methodological triangulation: combination of
different research methods or different
varieties of the same method - two forms of
methodological triangulation.
❑ Within method triangulation
involves making use of
different varieties of the
same method.
❑ making use of alternative
econometric estimators would be an
example.
❑ Between method triangulation
involves making use of different methods.
❑ Using ‘quantitative’ and
‘qualitative’ methods in combination.
151.
Data Collection Techniques
QuantitativePrimary Data Collection
Methods
❑This method involves the collection
of
data so that information
can be and
subjected to statistical
quantified
treatment.
❑Primary data may be collected through:
❑ Direct personal observation
method, or
❑Survey or questioning other persons,
152.
Data Collection Techniques
TheObservation Method
◦Observation includes the full range of
monitoring behavioral and
non- behavioral activities.
● Advantages
It is less demanding and has less bias.
One can collect data at the
time it
occurs and need not
depend on reports by others.
with this method one can capture the
whole event as it occurs.
153.
Data Collection Techniques
Weaknessof the Method
● The observer normally must be at the
scene of the event when it takes
place.
◦ But it is often difficult or impossible to
predict when and where an event will
occur.
●
●
It is also a slow and expensive process.
Its most reliable results are restricted to
data that can be determined by an open
or deliberate action or surface indicator.
● Limited as a way to learn about the
past, or difficult to gather information on
such topics as intentions, attitudes,
opinions and preferences.
154.
Data Collection
Techniques
The SurveyMethod:
To survey is to ask people questions
in a questionnaire - mailed or
handled by interviewers.
Strength of the Survey Method
It is a versatile or flexible method -
capable of many different uses.
Surveys tend to be more efficient and
economical than observations -
surveying using telephone or mail is
less expensive.
155.
Data Collection
Techniques
Weakness ofthe Method
◦The quality of information secured
depends heavily on the ability
and willingness of the respondents.
A respondent may interpret questions
or concept differently from what was
intended by the researcher.
A respondent may deliberately
mislead the researcher by giving false
information.
156.
Data Collection
Techniques
● Surveyscould be carried out through:
Face to face personal interview
By telephone interview
By mail or e-mail, or
By a combination of all
these.
a) Personal Face to face
Interview
◦It is a two-way conversion where one
person interviews another person for
detailed information.
157.
Data Collection
Techniques
Advantages
❑ Thedepth and detail of the
information exceeds the information
secured from telephone or mail surveys.
❑ Interviewers can probe
additional questions, gather
supplemental information through
observation, etc.
❑ Interviewers can make adjustments
to the language of the interview
because they can observe the
problems and effects with which the
interviewer is faced.
158.
Data Collection
Techniques
Limitations ofthe Method
❑The method is an expensive enterprise –
(e.g., locating respondents)
❑ Hence, personal interviews
are generally used only when
subjects are not likely to respond to
other survey methods.
❑susceptible to interviewers’ bias/mistakes
❑Interviewer may also be reluctant to visit
unfamiliar neighborhoods.
159.
Data Collection
Techniques
b) TelephoneInterview
◦Telephone can be a helpful medium of
communication in setting up interviews.
◦Telephone surveys are the fastest
method of gathering information from a
relatively large sample.
● generally lasts less than ten minutes.
160.
Data Collection
Techniques
Strength ofthis method
◦Moderate travel and administrative costs
◦ Faster completion of study
◦Responses can be directly entered on to
the computer
Limitations of this method
◦Respondents must be available by phone.
◦The length of the interview period is short.
◦those interviewed by phone find the
experience to be less rewarding
than a personal interview.
161.
Data Collection
Techniques
C) Interviewingby mail (Solicited responses)
◦Self-administrated questionnaires.
◦They are ideal for large sample sizes, or
when the sample comes from a
wide geographic area.
Advantages
◦Lower cost than personal interview
◦Persons
who
inaccessible can
might otherwise
be be contacted
(major
corporate executives)
◦Less interviewer bias
◦better protects privacy/anonymity
162.
Data Collection Techniques
Disadvantages
◦Non response error is high
◦ Large amount of information may not
be acquired
d) Online Surveys (E-mail and internet)
◦ E-mail surveys are relatively new and little is
known about the effect of sampling bias in
internet surveys.
Advantages:
◦ Very inexpensive -saves inputting costs
as well
◦ Respondents feel privacy
163.
Data Collection
Techniques
Disadvantages:
◦Very biasedtoward wealthy - in Nigeria
◦Biased toward young everywhere – even
the very poor have less online
access in industrialized world
● The demographic profile of the internet
user does not always represent
the general population.
◦Therefore, before doing an e-mail or
internet survey, carefully consider
the effect that this bias might have
on the results.
164.
Questionnaire Design
❑ Actualinstrument design begins by drafting
specific measurement questions in the form
of a questionnaire.
❑ Questionnaires are easy to analyze.
❑ Data entry and tabulation can be
easily done with many computer
software packages.
❑ Questionnaires are familiar to most people.
❑ Nearly everyone has had some experience
completing questionnaires
generally do not make
and
they
people
apprehensive.
165.
Questionnaire Design
❑Questionnaires reducebias.
❑ There is uniform
question presentation.
❑ The researcher's own opinions will
not influence the answer.
❑ Mailed questionnaires are less
intrusive.
❑ When a respondent receives
a questionnaire by mail, he/she is
free to complete the questionnaire
on his/her own time-table.
166.
Questionnaire Design
● Whenthe goals of a study can
be expressed in a few clear and
concise sentences then
Questionnaire design becomes
considerably easier
● Hence, ask only questions that
directly address the study goals.
◦Avoid the temptation to ask questions
because it would be "interesting
to know".
167.
Questionnaire Design
● Asa general rule, long
questionnaires get less response
than short questionnaires.
◦Hence, keep your questionnaire
short to maximize response rate –
essentials.
● Minimizing the number of questions
is highly desirable, but we should
never try to ask two questions in one.
168.
Questionnaire Design
● Indeveloping a survey instrument
the following issues need to be
considered carefully:
Question content
Question wording
Response form
Question sequence
169.
Questionnaire Design
1. QuestionContent
● Question content depends on
the respondent’s:
to answer the question
◦ability, and
◦willingness
accurately.
a) Respondents’ ability:
◦The respondent information level should
be assessed.
Questions that overtax the
respondent’s recall ability may not be
appropriate.
170.
Questionnaire Design
b) Willingnessof respondent to answer
◦Even if respondents have the
information, they may be unwilling to
give it.
◦Some of the main reasons
for unwillingness:
The situation is not appropriate for
disclosing the information –
embarrassing or sensitive
Disclosure of information is a
potential threat to the respondent
topic is irrelevant and uninteresting
for them.
171.
Questionnaire Design
❑ truthful
Tosecure more complete and
information
❑
❑
Use indirect statements i.e., “other people”
Change the design of the questioning
process.
❑ Apply appropriate questioning sequences
that will lead a respondent from „safe“
question gradually to those that are more
sensitive.
❑ Begin with non-threatening and
interesting questions.
172.
Questionnaire Design
● Questionsshould be
◦Simple and short
◦About issues respondents have
knowledge of
◦With same meaning to all
● Questions should not be
◦Double-barrelled – do not ask two questions
◦Leading – push people to answer
in a certain way
◦Avoid words like usually, often, sometimes,
occasionally, seldom, etc.
173.
Questionnaire Design
2. QuestionWording: Using Shared
Vocabulary
● In a survey the two parties must
understand each other and this is
●
possible only if the vocabulary used
is common to both parties.
So, don’t use uncommon words or long
sentences or abbreviations and make
items as brief as possible.
❑And, don’t use emotionally loaded or
vaguely defined words.
174.
Questionnaire Design
3. Responsestructure or format -
● Refers to the degree and form of
the structure imposed on the responses.
◦Open-ended or closed questions
a) Open Ended Questions
◦ In open-ended questions
respondents can give any answer.
They may express
themselves extensively.
The freedom may be to
choose a word in a “fill in “
question.
175.
Questionnaire Design
Advantage
◦Permit anunlimited number of answers
◦Respondents can qualify and
clarify responses
◦Permit creativity, self expression, etc.
Limitations
responses may not be consistent.
Some responses may be irrelevant
Comparison and statistical
analysis difficult.
Articulate and highly literature
respondents have an advantage, etc.
176.
Questionnaire Design
b) ClosedQuestions
◦Generally preferable in large surveys.
dichotomous or multiple-choice questions.
Advantages
◦Easier and quicker for respondents
to answer
◦Easier to compare the answers of
different respondents
◦Easier to code and statistically analyze
◦Are less costly to administer
◦reduce the variability of responses
◦make fewer demands on interviewer
skill, etc.
◦don’t discriminate against the less talkative
177.
Questionnaire
Design
Limitations
◦Can suggest ideasthat the
respondents would not otherwise have
◦too many choices can confuse
respondents
● During the construction of closed
ended questions:
The response categories
provided should be exhaustive.
They should include all the
possible responses that might be
expected.
The answer categories must
be
mutually exclusive.
178.
Questionnaire Design
4) QuestionSequence – the order of the
questions
● The order in which questions are asked
can affect the overall data collection
activity.
● Grouping questions that are similar will
complete, and the respondent will
make the questionnaire easier to
feel
more comfortable.
◦Questions that use the same response
formats, or those that cover a
specific topic, should appear together.
179.
Questionnaire Design
5) PhysicalCharacteristics of a Questionnaire
● An improperly laid out questionnaire can lead
respondents to miss questions, can confuse
them.
● So, take time to design a good layout
◦ease to navigate within and between sections
◦ease to use the questionnaire in the field;
e.g., questions on recto and codes on verso
sides of the questionnaire
◦leave sufficient space for open-ended
questions
◦questionnaire should be spread out properly.
180.
Questionnaire Design
● Puttingmore than one question on
a line will result in some
respondents skipping the second
question.
● Abbreviating questions will result
in misinterpretation of the question.
Formats for Responses
◦A variety of methods are available
for presenting a series of
response categories.
Boxes
Blank spaces
181.
Questionnaire
Design
6) Reproducing thequestionnaire
●A
neatly reproduced instrument will
encourage a higher response rate, thereby
providing better data.
◦ Pilot
Survey:
questionnaire
The final
test of a
is to try it
on
representatives of the target audience.
◦If there are problems with the
questionnaire, they almost always
show up here.
182.
Data Management
● Dataanalysis ranges from very simple
summary statistics to extremely
complex multivariate analyses.
Data Preparation and Presentation
Data processing starts with the
and
editing, coding, classifying
tabulation of the collected data.
183.
Data Management
i) Editing
◦Editingof data is the process of
examining the collected raw data to
detect errors and omissions.
◦In general one edits to assure
that the data are:
✓Accurate
✓ Consistent with
other information/facts gathered
✓Uniformly entered
184.
Data Management
● Theediting can be done at two levels
a) Field level Editing
After an interview, field workers should
review their reporting forms,
complete
personal shorthand, rewrite
what was abbreviated, translate
illegible
entries, and make callback if necessary.
b) Central editing
when all forms have been completed
and returned to the office data editors
correct obvious errors such as entry in
wrong place, recorded in wrong units,
etc.
185.
Data Management
ii) Coding
Codingrefers to the process of assigning
numerals to answers so that responses
can be put into a limited number of
categories or classes -coding sheet.
iii) Classification and Tabulation
large volume of raw data must be
reduced into homogenous groups if we
are to get meaningful relationships.
● Classification is the process of arranging
data in groups or classes on the basis of
common characteristics.
186.
Data Management
● Tabulationis the orderly arrangement
of data in columns and rows.
● Simple or complex tables.
◦Simple tabulation gives
information about one variable.
◦Complex tabulation shows the
division of data into two or more
categories.
SPSS, R, Excel, STATA, etc.
187.
Data Management
following
● Tabulationprovides
the advantages:
✓ It conserves space and
reduces explanatory and descriptive
statement to a minimum.
✓It facilitates the process of comparison
✓ It facilitates the summation of items
and the detection of errors and
omissions
✓ It provides a basis for various
statistical computations such as
measures of central tendencies,
dispersions, etc.
188.
Steps in dataanalysis
❖Actions After Data Collection
◦ Process the data
◦ Prepare tables and graphs
◦ Analyze and interpret findings
◦ Prepare for presentation
Descriptive Statistics
➢ Refersto the description of data from a
particular sample, hence the conclusion must
refer only the sample.
➢ In other word, it is summarizing and
describing the character of the sample
➢ Descriptive statistics are numerical values
obtained from the sample that gives meaning
to the data collected
191.
Inferential
Statistics Analysis
➢ Theuse of statistical tests, either to test for
significant relationships among variables or to
find statistical supports for the hypotheses.
Inferential statistics
researcher to draw conclusions about
➢ Are numerical values that enable
the
a
population based on the characteristics of
a population sample
➢ This is based on the laws of probability.
192.
Uses of InferentialAnalysis
• Cited some statistical test for
inferential analysis.
1. t-test- is used to examine the
difference between the means of two
independent groups.
2. Analysis of Variance (ANOVA)- is used
to test the significance of differences
between
means of two or more groups.
3. Chi-square- this is used to test hypotheses
about the proportion of elements that fall into
various cells of a contingency table.
196.
Presentation of
Findings
• Findingsare presented in different forms such
as:
1. Narrative or textual form
◦ This is composed of summary of findings,
direct quotations and implications of the study.
to present a clear and
2. Tables
◦ Tables are
used organized
data.
◦ This is
utilized
for easy analysis and
interpretation of data.
198.
Summary of Findings
•
•
Thisportion summarizes the result
of data analysis
The best thing is to review the
stated problem and tie up with the
result of your data analysis.
199.
Conclusions
•
•
A conclusion isdrawn from the
summary of findings.
focuses on the answers to the problem
the outcome
whether it
is
ofthe
rejected
or
including
hypotheses
accepted.
200.
• of the
•toward
Recommendations
This is based on the result
conclusions
The main goal is geared
improvement or development
201.
Rules of referencing& citation
(APA/Harvard System
1.Book(Single Author)
Title: Econometric analysis of cross
section and panel data
Author: Publisher: MIT press
Year: 2010 City: London Edition: 1st
In-text citation Reference list
Beginning of sentence--- Jeffrey M. Wooldridge
Wooldridge (2010). End of (2010),
sentence (Ahmed,2011) Econometric
cross
section
analysis
of
and
panel
data, 1st
ed,
MIT press,
London
202.
Co
n’t
2. Book (TwoAuthors)
Title: Introduction to Econometrics
Author: James H. Stock and
Mark W. Watson
Publisher: Pearson, Addison-Wesly
Year: 1993 City: Boston Edition: 3rd
203.
Con’t
3. Book(Four Authors)
Title:Conflict Analysis and Resolution
Author: Ahmed Hassan , Yasin Omer,
Hodan Nour & Asma Hussein
Publisher: National Printing Press
Year: 2011 City: Hargeisa Edition:
3rd
204.
Con’t
4. Journal article(Single Author)
Article title: Factors affecting employees
performance of service organization in
Somaliland
Journal Name: Journal of Human Resource
Management
Author: Abdirahman Jama Year: 2011
Pages:
5-10
Volume: 4 Issue: 16
205.
Con’t
5. Conference Proceedings
Articletitle: Causes of employees’ turnover
in Private Businesses in Hargeisa
Conference publication name: Proceedings of
the 10t h annual conference on the Small Business
Development
Author: Ahmed Hassan Year: 2011 Pages: 42-
65
City: Hargeisa Publisher: Chamber of
Commerce
206.
Con’t
6. Website
Name ofwebpage: Procurement
administration in Somaliland
Name of website: National Tender Board
Year: 2011 Month: January Day: 24
Year Accessed: 2011 Month
Accessed: September Day Accessed: 15
URL: http://www.ntb.gov.et
207.
When must we
providecitation?
❖ When must we provide citation?
◦ Quote directly
◦ Paraphrase
◦ Summarise
● Use ideas, theories, facts,
experiments, case studies, from a source
● Adopt another person’s research
method, survey or experiment design
● Use statistics, tables, diagrams etc.
208.
Cases where no
citationrequired
● Your own ideas, theories,
arguments, conclusions
● Surveys and experiments designed
and carried out by you
● Your own research method
● Very basic common knowledge:
i.e. Abuja is the capital of Nigeria.
BUT
● Abuja is the capital of Nigeria and has
a population of an estimate of 200
million (cite source!)
209.
APA Style
◦ Inthe case of one and two
authors- Sur name of the author(s)
followed by year of publication and
page number if it is direct quote
Cormack (2014) work supports
… view (paraphrasing)
Cormack (2014, p.32-33) states
that 'when writing….’ (quote)
Writing for a professional
audience (Cormack and Jacky, 1994).
210.
Con’t
◦ In caseof three to five authors-Write the
surnames of all of the authors the first time
the text is cited, then after the surname of
the first author followed by et al. meaning
and others
Further research (Green, Harris and
Dunne, 2009) showed that …
The research (Green, et al., 2009) has also
found that the majority of
● In the case of six and more authors-
the surname of the first author followed
by et al. every time the work is cited
211.
Con’t
● Several worksby one author in the same
year will be identified by an alphabet
◦Earlier research
by found
that…but
Dunn
later
(2013a)
research
suggested again by Dunn (2013b) that
….
● When you cite a chapter from an edited
book, you cite the author of the
chapter not the editor of the book
● In case you want to cite a work that has
no author
◦Development is defined as (Anon., 2009)
212.
Con’t
● In caseyou want to cite a work that
has no date
◦Earlier research (Smith,
n.d.) demonstrated that …
● Second hand references
◦Deforestation is described as ….(Brown,
2006 cited in Bassett, 2013, p.142)
213.
Con’t
● Citing frompersonal communication
◦(Surname of the information source,
personal communication, Month day,
Year of the interview)
◦(Ahmed Ali, personal communication,
September, 12, 2012)
214.
Con’t
● If certainbibliographic details
are missing, use:-
◦Anon author anonymous or
not identifiable
◦s.l. no place of publication (Latin: sine
loco)
◦s.n. no named publisher (Latin:
sine nomine)
◦n.d. no date
Process of Research
Report
1.Beginwriting up the report as soon as
you can. Do not leave it until you have
finished your data collection before you
start writing up. Many sections, can be
drafted during or even before data collection.
2.Write down ideas as soon as you get
them, rather than leaving them to the
writing-up stage. Keep a research diary
where you can safely note any ideas. Not all
of your ideas will be useful, but it is certain
that some of them will be!
Do not imagine that you will be able to
remember these ideas at a later date.
217.
Report Writing
3.Be awareof the nature of the report
and the intended audience.
● If it is for a student research project,
then ensure you have read and
understood the criteria laid down by your
institution in terms of content, presentation,
length and so on.
4.If you are writing for a journal, ensure
that your research fits within the scope of
that journal’s objectives as well as its
editorial requirements.
● If you are producing a report or piece
of consultancy, ensure that you are clear
about the requirements of your audience.
218.
5.You will notbe able to write the
final report out first time.
●You will need to rewrite it a number
of times before it reaches completion.
●You should allow for this when
planning your research timetable, and not
become discouraged when the first
draft is not perfect.
219.
6.Make sure beforeyou begin writing
up that you make backups of your work
at every available opportunity. Whatever
you do, do not assume that whatever you
save on a hard drive will be safe!
7.You should keep your backups in
a separate location. As a further
safety measure, print out what you have
written so far at regular intervals.
220.
8.Final editing andproof reading.
Once you have got this far, the
temptation is to skip over the final
proof reading and simply submit the
project. Do carefully read over to
check spelling and grammar.
9. Submission of the report!
221.
TYPICAL RESEARCH REPORTSTRUCTURE
1. Title Page
2. Abstract
3. Acknowledgements
4. Contents
- List of Tables
- List of Figures
- Acronyms
5. Introduction
- Background of the study
- Problem statement of the study
- Objective of the study
- Justification of the study
- Scope of the study
- Significance of the study
- Limitation of the study
- Organization of the paper
6. Literature Review
- Theoretical Literature Review
- Empirical Literature Review
- Conceptual Framework
7. Methodology
- Data
- Model Specification
- Estimation Method
8. Results, discussion and Analysis
9. Conclusions and Recommendations
11. Reference List
12. Appendices
222.
Word of advice
Research is a task
and requires
Wide and targeted reading
Dedication
Continuous and critical
thinking
Linking components
Logical reasoning
223.
References
Patel B,Kay Muir-Leresche, Richard Coe and Susan D
Hainsworth (2004). The Green Book: A guide to
effective graduate research in African Agriculture. The
African Crop Science Society, Kampala, Uganda
Creswell JW (2009). Research design. Qualitative,
Quantitative and Mixed methods approaches. 3rd
Edition. SAGE publishers, California, USA.
Locke, L.F., Spiduso, W. and Silverman, S.J. (2007)
Proposals that Work: A Guide for Planning Dissertations
and Grant Proposals. 5th ed. Sage, Thousand Oaks.

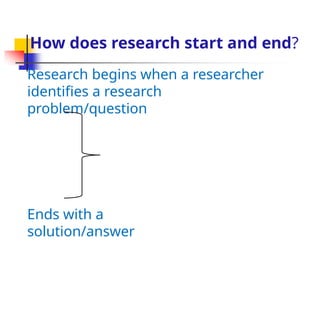
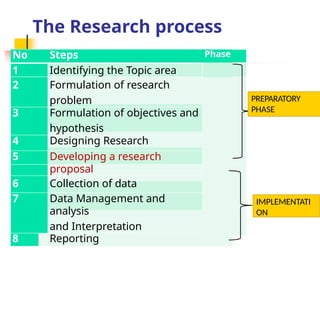
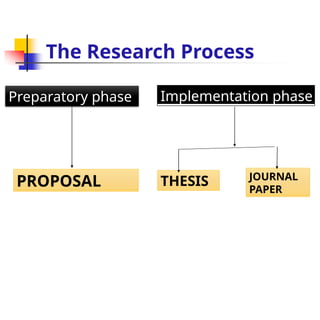
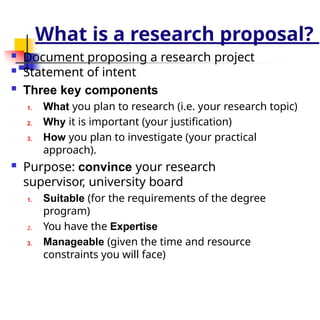
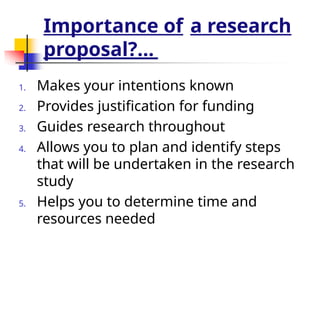

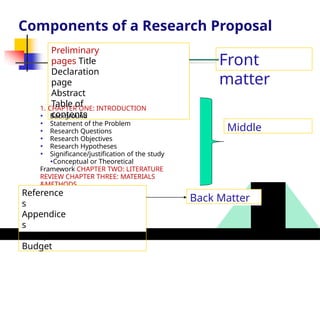
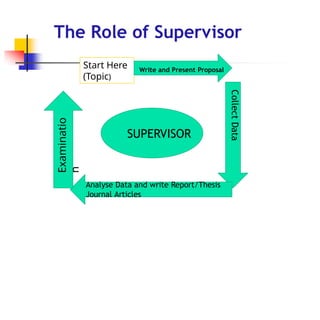
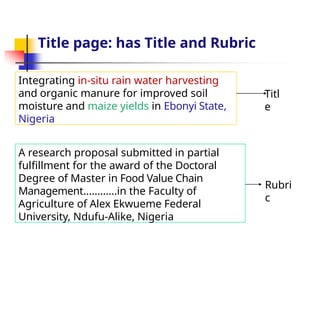
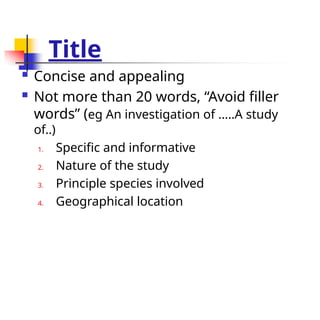
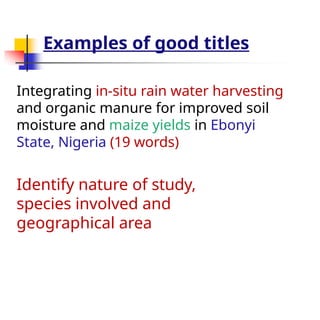

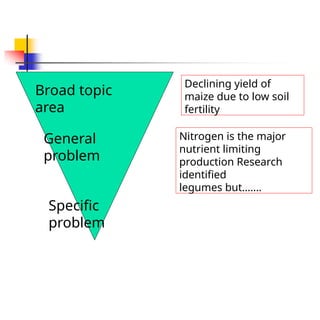
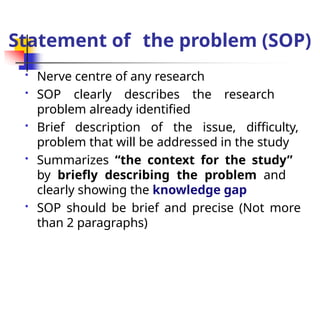

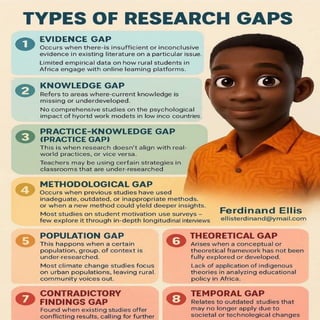

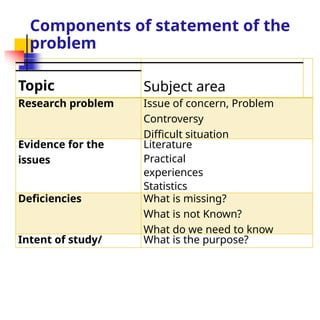
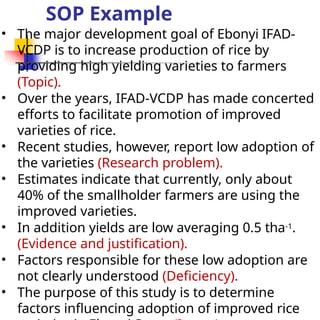
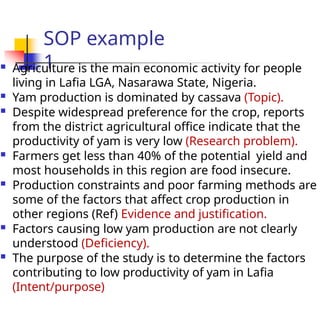
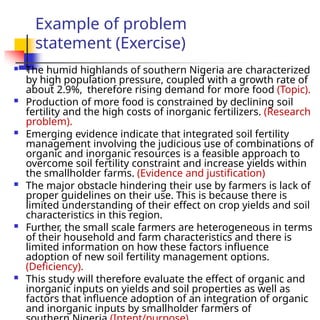
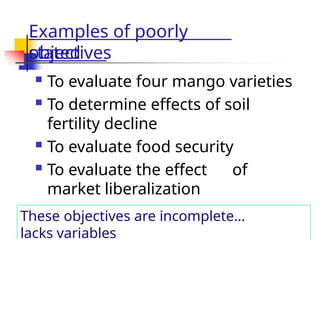
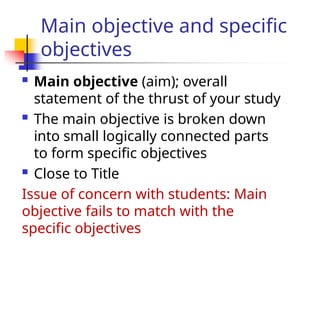
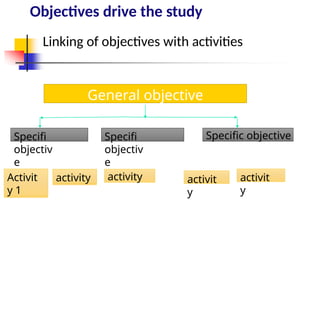
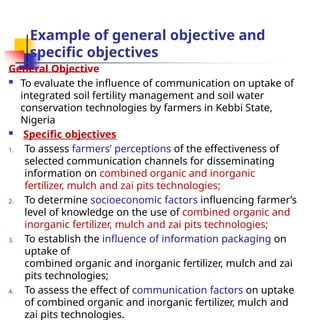
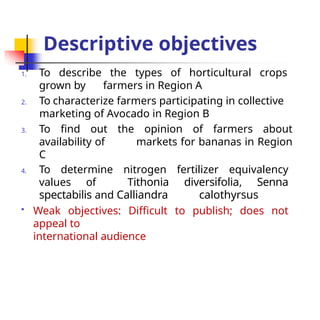
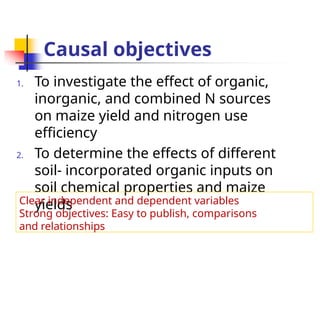
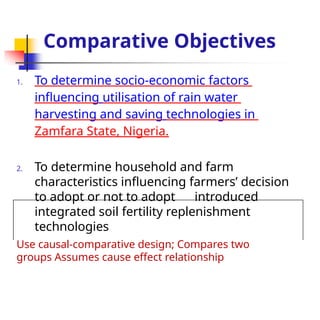

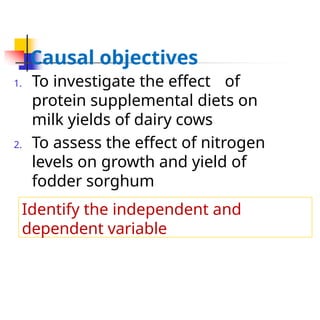
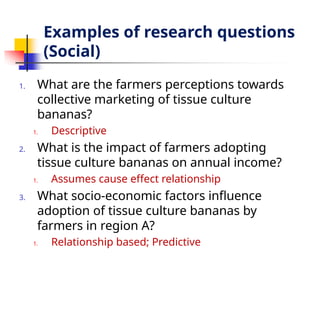

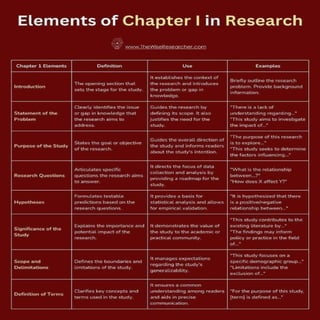
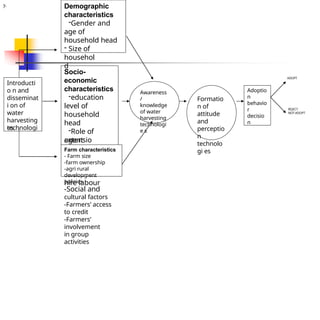
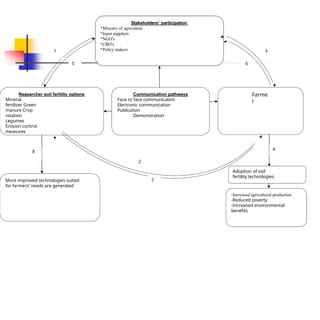
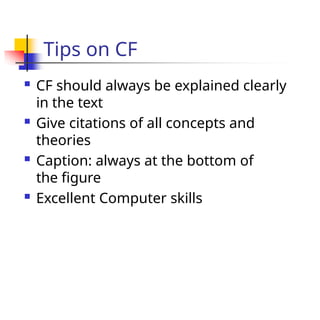
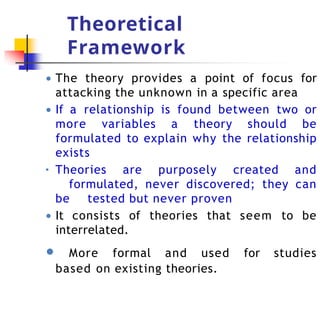
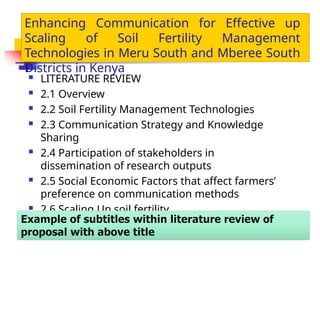
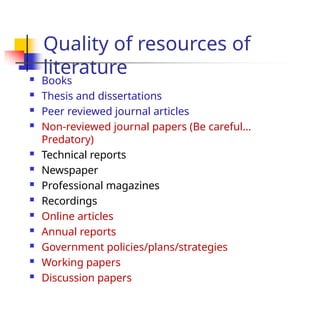
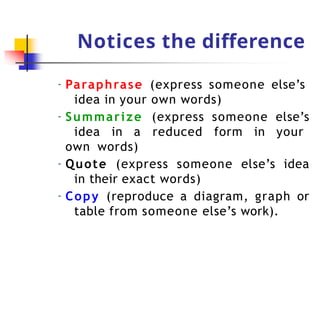
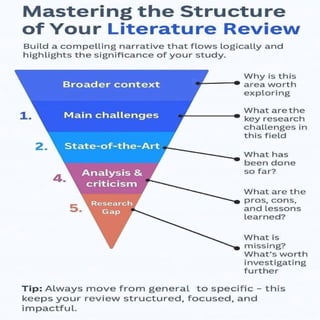
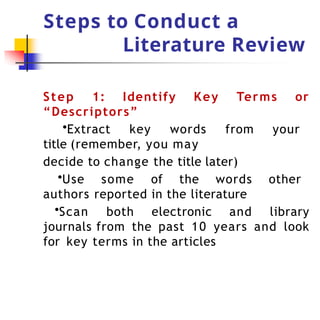
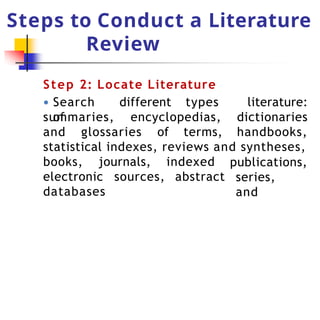
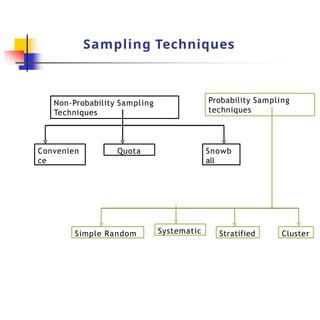
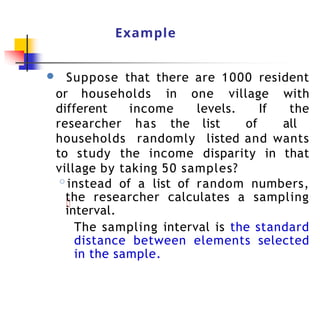
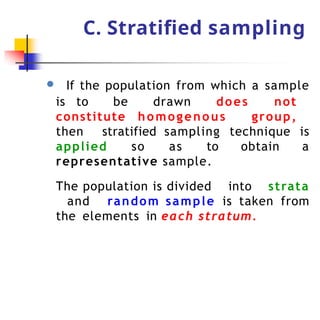
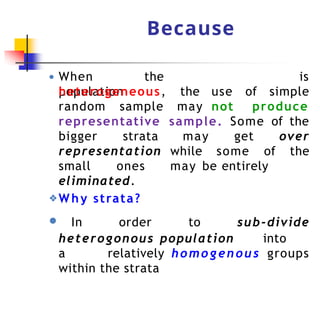
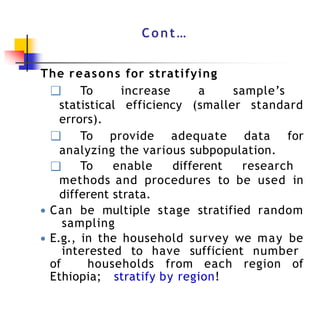
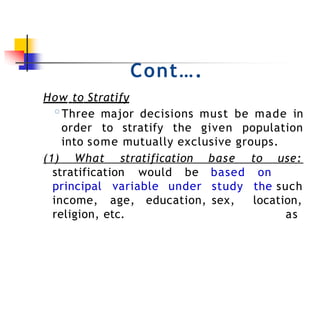
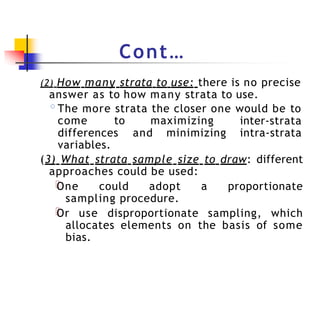

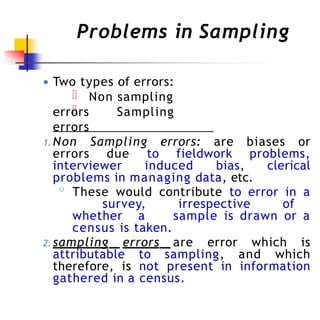
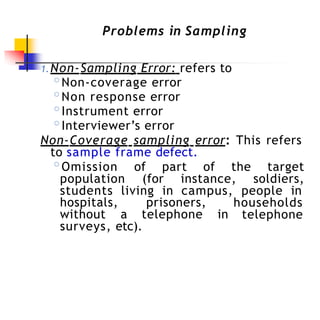
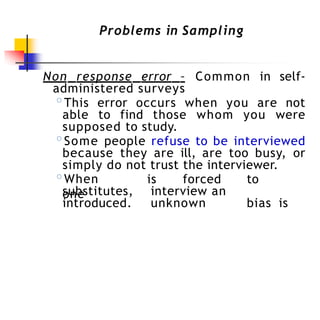
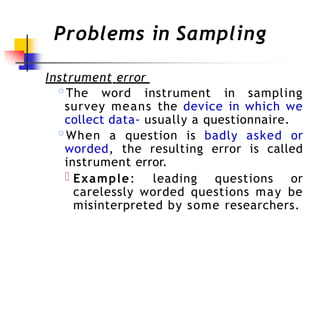
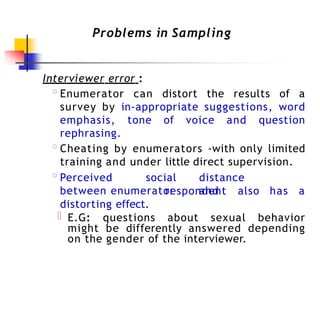
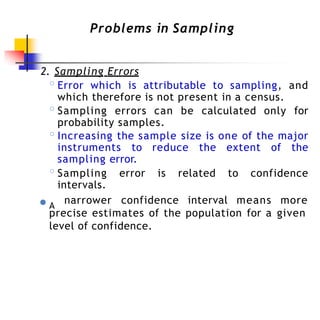
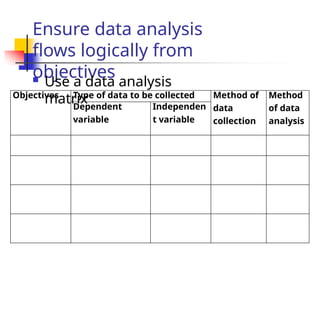

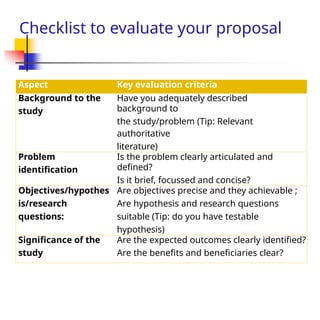
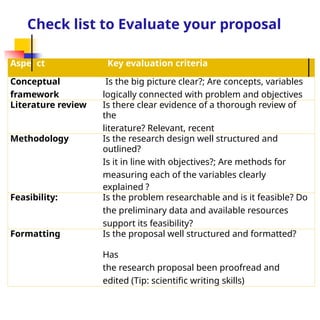
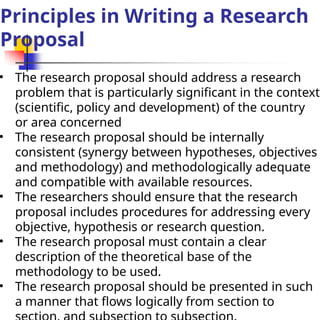
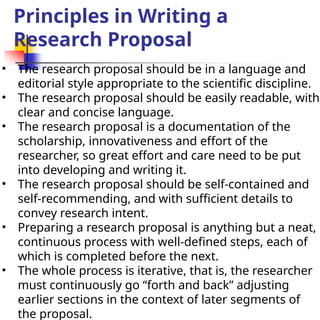
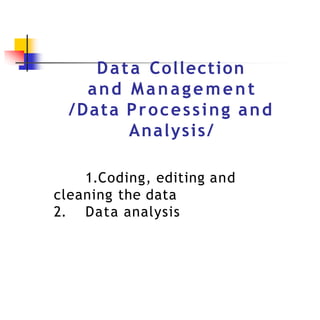
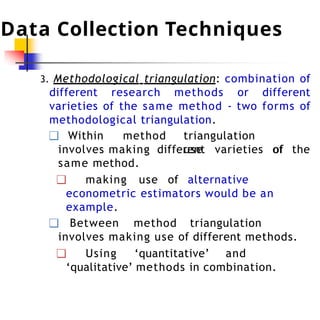
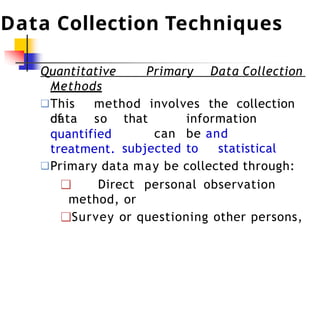
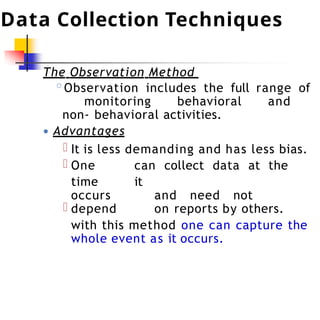
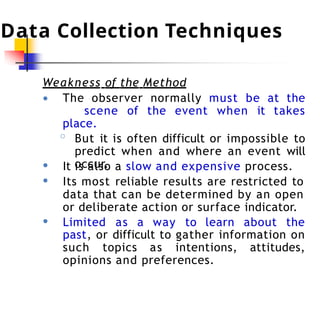

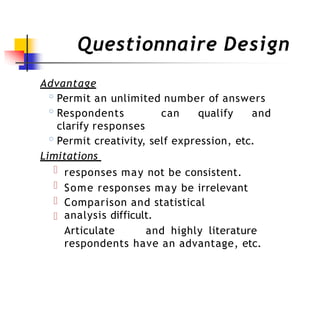
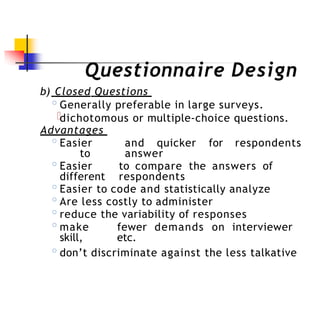
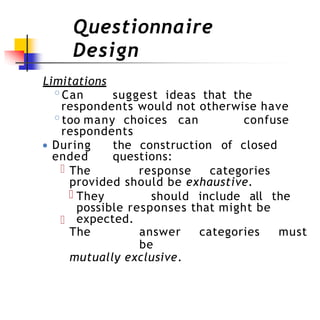
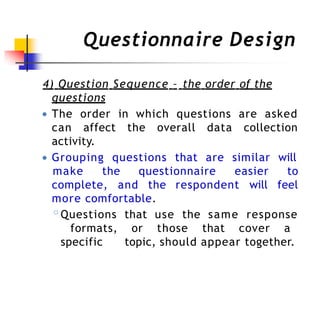

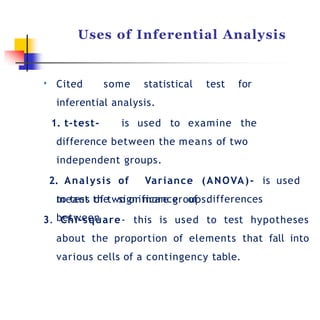
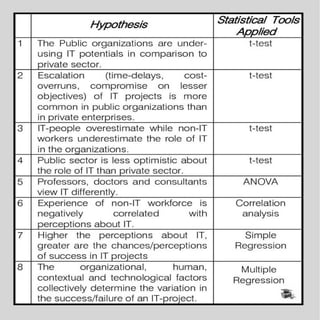
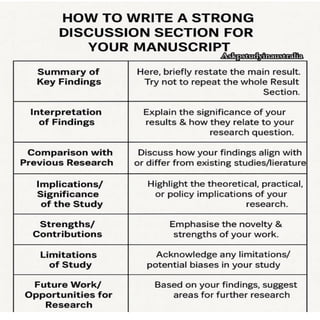
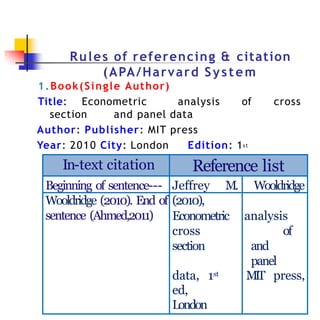

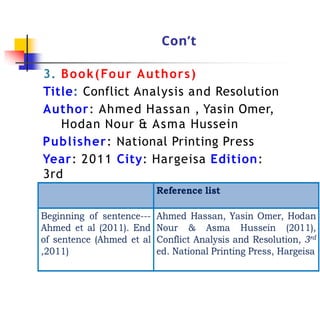
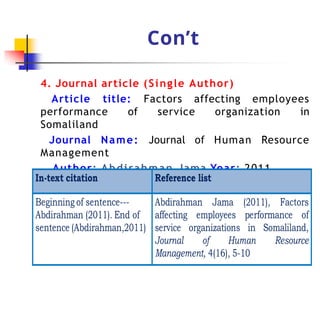
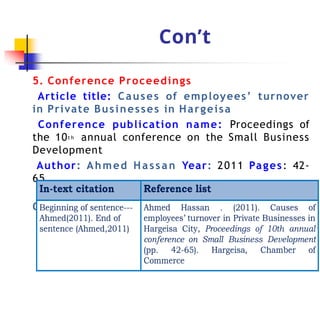
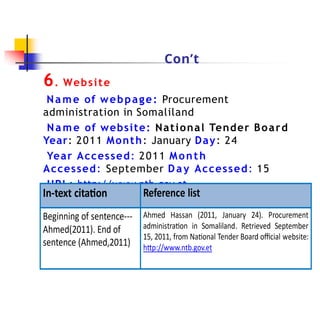

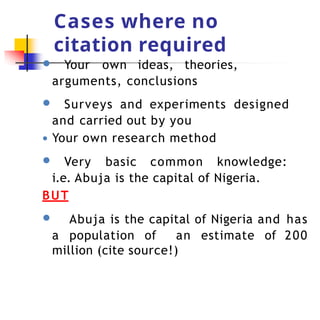
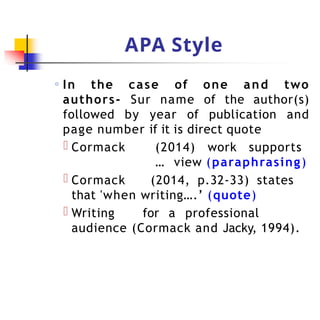


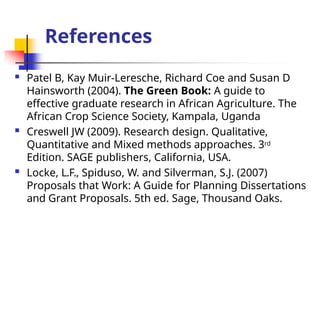


![[DSC Europe 25] Ivan Lukovic & Marija Djukic - From Data to Value: Why Maturi...](https://cdn.slidesharecdn.com/ss_thumbnails/ahrfps8xr6knowwhacxh-1-ivan-marija-dsc-2025-ld-v1-presentation-260115093812-be21adfc-thumbnail.jpg?width=640&height=640&fit=bounds)


![[DSC Europe 25] Bojan Djuricic - Predictive Design Process.pdf](https://cdn.slidesharecdn.com/ss_thumbnails/5awdrbedqdek3gqu2ezy-4-the-predictive-design-bojan-djuricic-260120105856-6c399e9b-thumbnail.jpg?width=640&height=640&fit=bounds)


