Downloaded 216 times


![JOR3-CT98-0284 OWTES
atmospheric pressure, temperature and precipitation. The position of the meteorological mast
relative to the offshore turbines is shown in Figure 3.4.
3.4 Measurement programme
The turbine structural loads, the sea-state at the turbine base and the wind characteristics were
recorded simultaneously using a Garrad Hassan T-MON measurement system. This well-
proven, robust system was found to perform well in the offshore environment. Analogue-to-
digital converters distributed around the turbine structure collected and sent data via a fibre-
optic link to an onshore control room. Here, the collection and recording of data was
controlled by a central computer which had a modem connection to allow remote
interrogation.
The measurement period began in October 2001 and continued to January 2003. During this
period, every sensor on the turbine was sampled at 40Hz and data collected in two formats:
‘summary’ datasets and ‘campaign’ datasets. Summary datasets consisted of the basic
statistics of each channel, measured every ten minutes, comprising the minimum, maximum,
mean and standard deviation of each signal. Campaign datasets stored time-history data from
each measured channel and were recorded in order to establish the dynamic behaviour, fatigue
load spectra and extreme loads experienced by the turbine. The recording of campaign
datasets was triggered automatically by the central computer when pre-defined trigger
conditions were met.
Campaign datasets were triggered to store time-history records of turbine operation or idling
under both ‘normal’ and ‘extreme’ external conditions. A matrix of normal conditions was
defined in terms of variations in mean wind speed, tidal water level, significant wave height,
wind direction (offshore or onshore) and turbine state (operating, idling, start-up, shut-down).
Extreme conditions that triggered the collection of campaign data included wind speeds above
the cut-out wind speed of 25m/s and significant wave heights above 4m.
Approximately 1,300 campaign datasets were recorded during the monitoring period, giving a
total of nearly 500 hours of measured time-history records. During the same monitoring
period, over 12,300 hours of summary data were collected. This data was processed into
engineering units by the application of sensor calibration factors and distributed to the
OWTES project partners in tab-delimited text files.
Further details of the monitoring system installed at the Blyth offshore wind farm are given in
[3.1] and [3.2].
8](https://image.slidesharecdn.com/report020-121129010446-phpapp02/85/Report-020-14-320.jpg)

![JOR3-CT98-0284 OWTES
5% 10% 15%
0-3 3-6 6-9 >9 m/s
Figure 4.1: Wind rose (43m met. mast anemometer)
Wind speeds recorded at four heights on the meteorological mast were used to estimate the
value of the wind shear exponent for onshore and offshore wind directions. By fitting the data
to the above expression, a mean wind shear exponent value of 0.05 was found for wind
directions from the sea and a value of 0.29 was found for wind directions from the land.
Of particular note is the low value of wind shear exponent associated with onshore wind
directions. As a check on the measured values of wind shear exponent, the mean wind speeds
measured by the met. mast were extrapolated from 43m to hub height using the measured
wind shear exponents and compared with mean wind speeds measured at the turbine nacelle
(corrected to account for the presence of the rotor and nacelle). Table 4.1 shows agreements
between these two values of mean wind speed of approximately 2%.
Wind direction Onshore (0° to 140°) Offshore (180° to 325°)
Measured wind shear 0.053 0.294
Turbine mean wind speed 9.57 m/s 6.25 m/s
Extrapolated mast wind 9.76 m/s 6.16 m/s
speed
Comparison 2.01% -1.47%
Table 4.1: Comparison of hub-height mean wind speeds
4.1.4 Turbulence intensity
Due to the turbine anemometer being located in disturbed flow behind the rotor, analysis of
the turbulent and spectral characteristics of the wind was performed using data from the met.
mast. Figure 4.2 presents the variation of turbulence intensity with wind speed for offshore
wind directions, measured at 43m height above OS datum. Superimposed on the scatter plot
of 10-minute measured values are binned mean values of turbulence intensity, and the range
of +/-1 standard deviation within each bin. Figure 4.3 compares the measured characteristic
values of turbulence intensity (mean plus 1 standard deviation) with standard distributions
taken from the IEC [4.1] and Germanischer Lloyd [4.2] regulations. It can be seen that the
10](https://image.slidesharecdn.com/report020-121129010446-phpapp02/85/Report-020-16-320.jpg)
![FINAL REPORT
measured values of turbulence intensity for wind directions from the land are nearly constant
between 3m/s and 22m/s.
Figures 4.4 and 4.5 presents turbulence intensity measurements in the same format for
onshore wind directions. It can be seen that the mean values of measured turbulence intensity
are significantly lower than for offshore wind directions, as might be expected from the lower
roughness. The measured values of characteristic turbulence intensity compare reasonably
well with the Germanischer Lloyd value of 12% except for wind speeds below 5m/s when the
measured turbulence is significantly greater.
Figure 4.2: Turbulence intensity for wind directions from the shore
Figure 4.3: Turbulence intensity for wind directions from the sea
4.1.5 Spectral analysis of the wind
Figure 4.4 shows an auto spectrum of measured wind speed for a wind direction from the sea
(campaign dataset x0633) for frequencies from 0 to 1 Hz. Superimposed over the measured
data is the theoretical “Improved Von Karman” spectrum [4.3]. It can be seen that the
Improved Von Karman model provides a good fit to this measured wind speed spectrum.
4.1.6 Extreme wind speeds
The database of summary data was examined to find the maximum 10-minute mean and
maximum instantaneous wind speeds recorded at the turbine nacelle during the 16-month
monitoring period. These were found to be:
• Maximum 10-minute mean wind speed: 17.0m/s, recorded on 11/02/02.
• Maximum instantaneous wind speed: 49.8m/s, recorded on 28/01/02
11](https://image.slidesharecdn.com/report020-121129010446-phpapp02/85/Report-020-17-320.jpg)
![JOR3-CT98-0284 OWTES
Autospectrum (m2 / Hz)
Frequency (Hz)
Figure 4.4: Wind speed autospectrum (campaign X0633)
4.2 Wave Conditions
Measurements of the sea state were performed using a wave radar located outboard of the
turbine walkway, 13.7m above the lowest astronomical tide (LAT) water level. A parallel
series of wave measurements was conducted at the beginning of the monitoring period using a
wave and tide recorder located on the seabed, approximately 40m from the turbine base. A
comparison of measurements from both instruments, including the tidal variation of mean
water level and the variation of significant wave height, showed good agreement.
4.2.2 Wind / wave scatter diagram
Using the complete database of summary datasets, the probability of occurrence of
combinations of the following variables was calculated:
• wind speed (2m/s bin width)
• tidal mean water level (1m bin width)
• significant wave height (1m bin width)
The results of this data processing were used to create scatter diagrams giving number of
occurrences (parts per thousand) as a function of tidal mean water level, wind speed and
significant wave height.
4.2.4 Correlation of wave height with wind speed
A scatter plot of the variation in significant wave height with wind speed, including all
available Blyth data, is shown in Figure 4.6. Datapoints corresponding to offshore and
onshore wind directions are indicated. Superimposed on this graph is the Pierson-Neumann
correlation specified by the GL certification regulations [4.2]. A very high degree of scatter is
evident in the measured data as a consequence of two effects: firstly the very large changes of
fetch with wind direction, and secondly the time lag between changes in wind speed and
changes in wave height.
12](https://image.slidesharecdn.com/report020-121129010446-phpapp02/85/Report-020-18-320.jpg)

![JOR3-CT98-0284 OWTES
offshore wind directions (westerly winds), it can be seen that combinations of high wind
speeds and high wind-wave misalignments are unlikely to occur.
Probability
Misalignment
Figure 4.7: Wind-wave misalignment for onshore and offshore wind directions
4.2.6 Spectral properties of recorded waves
Spectral analyses of the sea surface elevation time history were performed for a selection of
campaigns datasets. An example is shown in Figure 4.8 for campaign x0576. This figure
shows that the wave energy is concentrated in a relatively narrow range of frequencies (in
this case close to 0.1Hz). Superimposed on the graph in Figure 4.8 is a spectrum of the
standard JONSWAP form. This was fitted to the measured wave energy spectrum using the
method of Houmb and Overik [4.4].
Figure 4.8 illustrates a feature of nearly all of the wave spectra recorded at Blyth: a smaller
‘bulge’ in the wave energy spectrum over a range of frequencies close to twice the frequency
of the peak in the spectrum. It is believed that this is due to the fact that, in the shallow water
depth in which the turbine is situated, the waves’ profiles are not sinusoidal (linear) but have a
more steeply sided (non-linear) profile. Recent work by Veldkamp [4.5] has shown that small
non-linear waves may be modelled by correcting linear wave models for second order effects.
Figure 4.9 (taken from [4.5]) compares a measured wave spectrum at Blyth with a
theoretically-derived spectrum that attempts to account for second-order effects. The
agreement between measured and predicted spectra is better at twice the peak frequency than
the JONSWAP fit shown in Figure 4.8, although in the particular example shown the second-
order ‘bulge’ overestimates the measurements.
14](https://image.slidesharecdn.com/report020-121129010446-phpapp02/85/Report-020-20-320.jpg)
![FINAL REPORT
Autospectrum (m2/Hz)
Autospectrum (m2/Hz)
Frequency (Hz) Frequency (Hz)
Figure 4.8: Wave energy spectra Figure 4.9: Second order comparison
4.2.7 Extreme wave heights
The maximum wave height recorded during the monitoring period was 8.63m. This occurred
during stormy conditions on the 9th November 2001. The mean water depth corresponding to
this extreme wave was 7.8m. The measured extreme wave height was therefore 110% of the
mean water depth. This ratio is greater than the often-quoted value of 78% due to the slope of
the sea-bed.
4.3 Current conditions
For a period of almost three months at the beginning of the monitoring period, the direction
and speed of the current at the site of the Blyth turbine was measured using an Acoustic
Doppler Current Profiler (ADCP). Using this instrument the current velocity was measured at
a number of points vertically above the ADCP, with a spacing of 1m, at 10 minute intervals.
Analysis of the current speed and direction data showed that the prevailing tidal currents at
the site run in SSE and NW directions (approximately parallel to the shoreline).
Figure 4.10: Current velocity profile (SSE direction)
Figure 4.10 shows current velocity profiles plotted against normalised water depth for the
SSE current direction. Shown over-plotted on this figure is a 1/7th power law velocity profile
as specified by the GL regulations [4.2] to represent tidal current profiles. It can be seen that
the measured velocity profile is much more sheared than predicted by a 1/7th power law. This
is likely to be because the currents were measured on the top of the North Spit rock outcrop
rather than on a flat sea bed for which the 1/7th power law is thought to give a more accurate
prediction.
15](https://image.slidesharecdn.com/report020-121129010446-phpapp02/85/Report-020-21-320.jpg)


![JOR3-CT98-0284 OWTES
largest component of damping was predicted to be the aerodynamic damping of the rotor, at
approximately 4% of critical damping. The aerodynamic damping is higher at a wind speed of
9.6m/s than at 18.4m/s because of the higher thrust force at wind speeds close to the rated
wind speed. The predicted values of aerodynamic damping compare favourably with damping
factor values calculated from measured campaigns [5.1] which were found to be
approximately 4%.
X0763 X0635
Structural 0. 50% 0. 50%
Aerodynamic: tower drag 0. 07% 0.02%
Aerodynamic: rotor 3.76% 4.93%
Hydrodynamic 0.00% 0.00%
TOTAL 4.33% 5.45%
Table 5.2: Predicted damping components (% of critical damping)
5.4 Fatigue loading
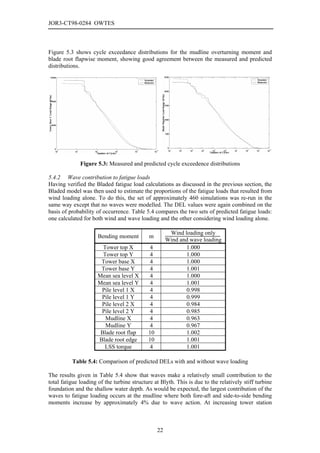
5.4.1 Measured and predicted fatigue loads
As described in [5.1], the data processing to calculate fatigue damage equivalent loads (DELs)
and Markov matrices from the database of measurements comprised two steps. In the first
step a scatter diagram of external conditions and turbine operating states was defined based on
summary datasets. In the second step, load time histories from approximately 460 campaign
datasets were rainflow cycle counted and the results combined on the basis of the probability
of occurrence of the external conditions and turbine operating state. The wind direction was
specifically accounted for in this data processing because of the different turbulence intensity
and wind shear properties for onshore and offshore wind directions.
The GH Bladed program was then used to create a time-domain simulation for each of the
measured campaign datasets, modelling the external conditions to be as close to the measured
campaign as possible. The wind shear exponent was calculated from long-term met. mast
anemometer data, being different for onshore and offshore wind directions. The mean wind
speed was found from met. mast anemometer readings, extrapolated to the turbine hub height
using the appropriate wind shear exponent. The turbulence intensity was specified as the
standard deviation of wind speed recorded by the 40m met. mast anemometer, normalised by
the hub-height wind speed. All modelled wind data were created using the ‘improved Von
Karman’ turbulence model [5.2].
Wave conditions were input to the simulations as Pierson-Moskowitz wave energy spectra.
For each simulation / campaign, the significant wave height (Hs) was calculated from the
campaign dataset as 4.005 times the standard deviation of sea surface elevation. The peak
spectral period (Tp) was then found by fitting a Pierson-Moskowitz spectrum to the measured
wave energy spectrum using the ‘least squares’ method. The measured mean sea level for
each campaign was also included in the simulation.
The simulations modelled the turbine either in idling or power production mode, depending
on the operational status of the turbine as recorded by the respective campaign dataset. The
measured difference in the wind and wave directions was also taken into account. The
20](https://image.slidesharecdn.com/report020-121129010446-phpapp02/85/Report-020-26-320.jpg)

![FINAL REPORT
heights the wave contribution to fatigue loads decreases and is essentially zero at the tower
base and above.
5.5 Extreme wave loading
The aims of this investigation were to compare the measured and predicted loads on the
turbine support structure resulting from the passage of large waves passed the turbine base.
Two studies were conducted: firstly the measured and predicted loads applied by the waves
were compared, and secondly a comparison was made of the predicted and measured dynamic
responses of the support structure to the impact of large waves.
5.5.1 Comparison of measured and predicted applied wave loads
The measured support structure loads included contributions from the wind loading, wave
loading and structural dynamics. As described in [5.1], a method of data processing was
developed to estimate the applied load time-history from the waves only.
A two-input-single-output linear shift operator time series model was estimated
from measures of rotor out-of-plane load and low speed shaft torque to the tower mudline
bending moment resolved into the mean wave direction. The linear model was assumed to
represent the wind component of the mudline bending moment. The wave component was
then estimated as the difference between the measured mudline bending moment and the wind
component predicted by the linear model. The dynamic component of the measured
overturning moment was found to be small and was neglected.
The results of this method of data processing were checked by searching the campaign
datasets for waves of similar heights and comparing the processed time-histories of mudline
applied bending moments. This check was carried out for waves of approximately 2.9m,
3.5m, 4.3m and 5.0m height. Load ranges were found to agree to approximately 10%.
Using the Bladed program, simulations were run to predict the wave applied loads for waves
of the same four heights. In this case, high-order stream function theory was used to calculate
the water particle kinematics associated with the wave and the resulting loads were calculated
using Morison’s equation. The calculations assumed a drag coefficient (Cd) of 0.6 and an
inertia coefficient (Cm) of 1.3. No separate calculation of slap loading (an inertial load
associated with the impact of the wave crest) was made.
At Blyth the turbines are installed on a rocky outcrop known as the ‘North Spit’. As waves
approach the turbines, the water depth reduces rapidly in the region of the outcrop. An effect
of a sloping sea-bed is to increase the height of the breaking wave relative to the breaking
wave height for a flat sea-bed. The breaking wave height may increase by a factor of up to 1.5
for a sea-bed slope of 10%, as shown by Figure 6.10 of [5.3]. A consequence of this is that,
when modelling a wave with a given wave height and period, the wave characteristics will be
more non-linear (i.e. closer to breaking) for a flat sea-bed than they would be for a sloping
sea-bed. Because the wave solver contained within the Bladed program calculates wave
properties for a flat sea-bed, some adjustment was necessary to account for the effect of the
actual sea-bed slope on the predicted wave profile and water particle kinematics. This
adjustment was made as follows:
1. The mean water level was determined for the campaign datasets considered. This was
found to be 2.5m above lowest astronomical tide (LAT), equivalent to a total depth of
8.5m.
23](https://image.slidesharecdn.com/report020-121129010446-phpapp02/85/Report-020-29-320.jpg)


![FINAL REPORT
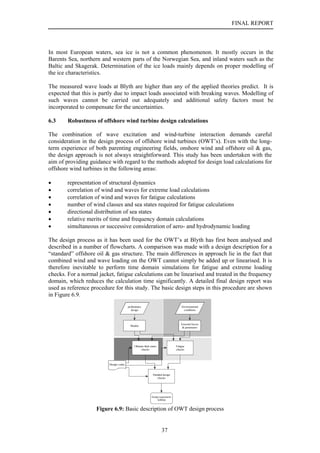
6 PARAMETRIC DESIGN STUDY
6.1 Sensitivity analysis for foundations of offshore wind turbines
As shown in [6.5], dynamic response is an important aspect in the prediction of extreme and
fatigue loading of the support structure of an offshore wind energy converter (OWEC). The
predictability of this dynamic response differs in some important aspects from that of
platforms for the offshore oil industry and of onshore wind energy converters. The natural
frequency of an OWEC is wedged between different excitation frequencies, whereas the
natural frequency of a fixed platform for the offshore oil industry is usually designed to be
well above the wave excitation frequencies. The geometry and dimensions of offshore
foundations differ from typical onshore solutions, resulting particularly in an expected larger
influence of soil characteristics for slender monopile foundations.
The first and second natural frequencies of the support structure were taken as the primary
indicators of dynamic response. The work focused on the two following issues relating to the
prediction of the natural frequency in wind turbine design codes: (i) sensitivity of the
predicted natural frequency to variations in input parameters and foundation models, and (ii)
comparison of predicted and measured natural frequencies.
The support structures were modelled using the finite element program ANSYS®. The soil-
structure interaction models that were used in this study are common in the offshore oil
industry, e.g. as recommended in [6.1]. The selected models were sufficiently sophisticated to
incorporate the influence of the parameters that were varied in the study. It was assumed that
the parameter sensitivities could be determined with sufficient accuracy with these models,
while the validity of the absolute values of the calculated natural frequencies was investigated
by comparison with the measurements. This work is reported extensively in [6.3] and [6.9]
and was presented at two conferences, see [6.8] and [6.10].
6.1.1 Sensitivity of predicted frequency
For the sensitivity study five different support structure concepts are selected, all designed for
a 3 MW wind turbine. The five concepts, shown in Figure 6.1, are:
1. Tubular tower on a monopile
2. Tubular tower on a gravity base structure
3. Tripod and tubular tower with piles
4. Lattice tower with piles
5. Lattice tower with a gravity base structure
1. 2. 3. 4. 5.
Figure 6.1: Schematic representation of concepts used in sensitivity study.
27](https://image.slidesharecdn.com/report020-121129010446-phpapp02/85/Report-020-33-320.jpg)
![JOR3-CT98-0284 OWTES
The sensitivity of the natural frequency to foundation and soil properties was the main
objective of the parameter sensitivity study. Therefore, many basic parameters that describe
the soil and foundation were varied. Some environmental and structural parameters were also
varied, to provide insight in the relative importance of the sensitivities. The following types of
analyses were performed:
1. Parameter sensitivity, relating to uncertainties, changes during the operational lifetime
and (small) changes in location.
2. Site dependency, relating to larger changes in location and soil conditions.
3. Loading conditions, relating to non-linear foundation behaviour.
4. Different foundation models, based amongst others on [6.2] and [6.6].
As an example of the results of the sensitivity study the differences between the predicted first
natural frequencies with several foundation models are shown in Figure 6.2. The study of
foundation models was only performed for support structure concepts with a piled foundation.
1.20
1st natural frequency (normalised)
1.00
Tubular tower
Tripod
Lattice tower
0.80
Force method
Displacement method
Only axial springs
(Seabed) 0D
Winkler FEM (reference)
2D
Randolph
Only lateral stiffness matrix
FEM-based
8D
6D
4D
Effective fixity depth Stiffness
matrix
Springs
Figure 6.2: Predicted first natural frequency for several foundation models.
6.1.2 Measured and predicted natural frequencies
For the comparison of predicted and measured natural frequencies, design data was collected
for the wind farms Lely, see [6.4], and Irene Vorrink in the Dutch IJsselmeer. The location
and typical soil profiles of these wind farms are shown in Figure 6.3.
28](https://image.slidesharecdn.com/report020-121129010446-phpapp02/85/Report-020-34-320.jpg)
![FINAL REPORT
0 0
SILT
SOFT CLAY -2
-3 SAND [d]
-4
SOFT CLAY
-7
-8 SAND [d]
SAND [vd]
-10
SAND [d]
SAND [d]
-19
STIFF CLAY -22
-24 STIFF CLAY
SAND [vd] -26
-29
Upper left: Lely; lower right: Irene Vorrink Lely Irene Vorrink
Figure 6.3: Location of measured wind farms and typical soil profiles.
The Lely wind farm consists of four NW41 turbines, manufactured by NedWind. The two
bladed turbines have a rated power of 500 kW each and a rotor diameter of 40.77 m. The
turbines in the Irene Vorrink wind farm are NTK 600 turbines, made by the Nordtank Energy
Group. The turbines have a rated power of 600 kW each and a rotor diameter of 43 m. Both
wind farms are depicted in Figure 6.4.
Figure 6.4: Wind farms Lely (left) and Irene Vorrink (right).
The following measurements were carried out within this programme:
• To determine the resonant frequencies of the bending mode of the tower, monitoring
was done during periods of one hour, with the turbine parked and in production at
various wind velocities.
• To determine the damping ratio of the tower, transient translation movements were
measured after a stop.
• To determine the rotational resonant frequencies transient rotational movements of
the nacelle were measured after yaw movement.
29](https://image.slidesharecdn.com/report020-121129010446-phpapp02/85/Report-020-35-320.jpg)
![JOR3-CT98-0284 OWTES
All turbines for which data was collected were modelled in the finite element program, to
compare the measured natural frequencies with predictions. Table 6.1 gives an example of the
results. The measurements at the Lely wind farm were also compared with measurements
made in 1995, reported in [6.7], in order to determine aging effects.
Turbine 1st Bending mode (Hz) 2nd Bending mode (Hz)
number
Predicted Measured Difference Predicted Measured Difference
3 0.517 0.546 -5.3% 2.5 3.3 -24%
7 0.557 0.554 0.5% 3.2 3.3 -3%
12 0.542 0.553 -2.0% 3.0 3.3 -9%
23 0.544 0.563 -3.4% 3.0 3.3 -9%
28 0.541 0.560 -3.4% 3.0 3.3 -9%
Table 6.1: Predicted and measured frequencies of turbines in Irene Vorrink wind farm
6.1.3 Conclusions
It is emphasised here that many conclusions drawn from this study are only directly
applicable to the reference cases considered and that interpretation of the results in a general
perspective needs careful consideration of the assumed conditions.
The parameter sensitivity shows that the uncertainty of the first natural frequency of the
analysed support structures with pile foundations will be in the order of 4%. The sensitivity of
the tripod and lattice tower was smaller than that of the tubular tower. The natural frequency
of the tubular tower decreased by less than 5% for a scour hole of 2 times the pile diameter.
The uncertainty of the first natural frequency of the analysed gravity base structures appears
to be in the order of 20%. However, the analysis of the GBS is based on a rather simple
foundation model and a conservatively large variation of soil parameters. The design process
of gravity base structures will require a more thorough analysis of variations within a wind
farm.
Several foundation models were compared. Three of these models have a different basis: a
finite element model based on stress strain curves, a linear elastic model developed by
Randolph and an effective fixity depth model. The finite element model and the linear elastic
model give comparable results for the investigated nearly uniform soil. The uncertainty in the
assumed effective fixity depth results in a large uncertainty in the predicted natural frequency.
The use of the effective fixity depth model without a priori knowledge of the foundation is
strongly discouraged for analysis beyond an initial guess of support structure behaviour.
The first and second natural frequency obtained with a stiffness matrix with coupled lateral
behaviour gives very good correspondence with the finite element foundation model. The use
of uncoupled springs for lateral displacement, rotation and axial displacement is not
recommended. For the tripod and lattice tower the lateral flexibility of the piles appeared to be
much more important than the axial flexibility.
The predicted fundamental natural frequencies of five turbines in the wind farm ‘Irene
Vorrink’ are within approximately 5% of the measured frequencies. The depth of the first stiff
soil layer appears to be an important parameter. One of the turbines in the wind farm ‘Lely’
showed a large difference of 9% between predicted and natural frequency. The other turbine
30](https://image.slidesharecdn.com/report020-121129010446-phpapp02/85/Report-020-36-320.jpg)

![JOR3-CT98-0284 OWTES
1. Morison's method, usually in the time domain, used for slender structures, such as
monopiles and tripods,
2. Diffraction theory, used for massive structures, such as gravity base supports
Froude-Krylov /
Integration
Diffraction
Pressure
Morison
CFD
Time / Frequency Domain TD FD FD TD TD
Forces
inertia √ √ √ √ √
Transverse
drag √ √6 X X √
Lateral (drag) √ √6 X X √
Pressure X1 X1 √ √ √
Geometry
Diffraction X2 X2 √ X √
Surface 1D √ √ X √ √
Effects 3 3D X X X √ √
Massive Structures X X √ √ √
Wave Model
Non-linear wave models &
√ X X √ √
extrapol.
Stochastic (Linear) √ √ √ X5 X5
Applicability (* = poor / *** = good)
Commercial Availability *** *** *** ** *
Ease of Use *** ** ** ** *
Calculation Speed ** *** *** * *
Table 6.2: Wave load calculation methods
1
= can be modelled relatively easily by adding an extra term; 2 = can be modelled using MacCamy-
Fuchs correction for simple shapes; 3 = non-linear surface effects between the structure and the wave-
field: 1D = in vertical direction only (i.e. wave height considered only at the vertical-axis of the
structure), 3D = full geometric field (i.e. wave height at each surface element of the structure); 4 = must
be estimated; 5 = high demands on computation power; 6 = linearised
The pressure integration method (or Froude-Krylov method) offers the advantage of being
able to model massive and complex structural geometries with any wave model [6.14], and it
in general lead to a small increase in loads when in particular the non-linear wave model is
chosen. Diffraction has to be estimated in a similar manner as for Morison's method and so
accuracy and extend of application is limited.
32](https://image.slidesharecdn.com/report020-121129010446-phpapp02/85/Report-020-38-320.jpg)
![FINAL REPORT
Where the method could offer the most beneficial results, i.e. gravity base structures in
shallow water, the wind loads on the turbine do dominate the design process, however this
method has already been used for the design of gravity base structures for offshore wind farms
i.e. Middelgrunden. The influence of the structure on the wave pattern is unfortunately not
modelled in the diffraction methods yet. In the longer term CFD could help, being able to
model all aspects.
6.2.2 Linear versus non-linear wave theory
Today, waves kinematics are generally modelled using two different methods: (i) linear or
Airy theory, possibly incorporating vertical extrapolation, such as Wheeler stretching, to take
account of the wave height, and (ii) the non-linear theory (=stream function model) which
always includes the elevation of the water surface. In the past, Stokes theory has been used
widely; however for many users it has now been superseded by the stream function theory. A
number of other theories are of interest to researchers and include solitary wave, cnoidal and
Boussinesq theories, however these are generally not incorporated into commercial software.
The choice of the actual wave model to be used depends upon the relationship between the
wave height-and-period and the water-depth-and-wave-period. Waves with low steepness (i.e.
where the height to length ratio is low) in deep waters can be modelled accurately with linear
wave theory; in other cases, stream function theory of an appropriate order is recommended,
see Figure 6.5.
Windfarm Extreme
& Fatigue
Figure 6.5: Recommended wave models according to API [6.15] and the area of interest for
wind turbine applications when located in intermediate water depths
33](https://image.slidesharecdn.com/report020-121129010446-phpapp02/85/Report-020-39-320.jpg)
![JOR3-CT98-0284 OWTES
In the equations of the load model the inertia parameter is generally between 1.7 1.8, while
the drag parameter is between 1.05 1.2. Sometimes the added mass is included in the
equations, but if not it should not be forgotten. The area overlapping the Stream functions is of
special interest because it should be addressed in detail as it was mentioned in the task
description of 4.2. The effects of the wave model – which initiate the loads – on the calculated
overturning moment at mudline is demonstrated by examining a single wave, of 4m height and
8s period in 6m water depth (this is close to the breaking height and close to the extreme
experienced by the tower at this tide level).
The time span of the load impact and load level differ strongly. The difference in load level
between the non-linear and linear waves - now being almost 100% - goes down when the
wave height is reduced. For a 3 m. wave height the difference is 73% and it becomes 45%
when the wave height is only 2 m.
The difference in load level not only depends on the wave height but also on water depth and
wave period. Figure 6.6 shows the differences between the linear (Airy) and non-linear
(Stream Function) wave model for several cases. In deeper water depth, 21m, the differences
between the two models are significantly reduced. For the same wave height of 4m, the
difference in overturning moment reduces from in the order of 100% to the order of 10%. It
can be seen that at low wave heights, such as those that could determine the fatigue loads, the
difference is smaller and hence linear models may be acceptable. For higher waves, the choice
of wave model is very important.
4
Breaking Breaking
Waves Waves 10 20 50
100 150 200
30 40 60 70 80 90
3 10 50 60
Wave Height [m]
Wave Height [m]
50 40
100 150 30
10 20
2
50 100 10 20
5 in %
in %
1 50 0
4 6 8 10 12 14 4 6 8 10 12 14
DifferenceM Wave Period [s] DifferenceM Wave Period [s]
Figure 6.6: Overturning Moment – Under-prediction of the Airy Waves compared to the
Deans Waves in 6 m. water (left graph) and 21 m. water (right graph)
6.2.3 Breaking waves
Guidance for determining breaking wave loads are not common in offshore engineering; for
example the API recommendations [6.15] do not give any specific recommendations, probably
partly because there is incomplete consensus that modelling this aspect accurately is
important.
Hence, some form of analysis is recommended. The worst case of a plunging breaker could be
modelled as an impulse according to Eq. 6.1:
34](https://image.slidesharecdn.com/report020-121129010446-phpapp02/85/Report-020-40-320.jpg)
![FINAL REPORT
FI = ρ .R.C 2 .C S .λ .η b (6.1)
Two forms of CS, the time varying impact force function, have been examined; Von Kármán
and Wagner. The latter predicts a shorter more complex variation of the sawtooth force
representation and is regarded as the most accurate one, however von Kármán’s is still more
widely used. These formulations only refer to the total loads on the cylinder; local pressures
can be much higher up to 32ρv2, i.e. more than ten times higher but are also much shorter at
less than 1% of the wave period.
If the cylinders are inclined, for example as on a tripod structure, the wave loads will generally
be decreased, since they are inclined away from the waves; in the event that a wave is able to
break on an element inclined into the wave, the loads are significantly increased.
6.2.4 Ice Loads [6.16]
In most European waters, sea ice is not a common phenomenon. It mostly occurs in the
Barents Sea, northern and western parts of the Norwegian Sea, and inland waters such as the
Baltic and Skagerak. For a preliminary evaluation, charts based on satellite data may be used,
as presented in NORSOK N-003 for the Barents Sea, and by Vefsnmo et al (1990).
API RP 2N [6.17] provides ice categories and typical ice extremes such as thickness, diameter
and speed for locations in the North American Arctic that can be applied for similar conditions
in other areas. There are some 6 categories given by API RP 2N but for European offshore
waters only first year floe, first year ridges, and ice rubble are the typically occurring ice
types. Loading could be static or dynamic, the latter only occurs when there is an ambient
current or strong wind.
No standardised design data are readily available for European sites, and data should be
obtained from local sources. Most design codes come from northern countries such as
Norway, Canada, and USA (Alaska) that provide guidance on the subject. DNV’s code for
offshore structures (DNV-OS-C101) gives very little detail. The Norwegian Code, NORSOK
N-003 is slightly better and provides some guidance to the different types of ice loading. All
refer to the American Petroleum Institute (API), which has developed a recommended practice
for arctic conditions (API RP 2N) and provides by far the best information.
As an example, the ice loads from a one-year floe can be approximated by:
• Generalised Korzhavin’s Equation
• Modified Korzhavin’s Equation
• Based on Measurements
• Based on Peak Pressure Equation
Except the generalised Korzhavin’s equation (1962) all other are described in the API RP 2N
1995 standard. The generalised Korzhavin’s equation for the pressure exerted on a structure is:
Pe = I × k × m × σ c (6.2)
Where:
I = indentation coefficient (between 0.1 and 0.5)
k = contact coefficient,
m = shape factor and
σc = ice compressive strength (typical values are 8 to 10 MPa).
35](https://image.slidesharecdn.com/report020-121129010446-phpapp02/85/Report-020-41-320.jpg)
![JOR3-CT98-0284 OWTES
Both the generalised Korzhavin’s equation and the modified Korzhavin’s equation use the
compressive strength of the ice, which typically leads to conservative estimates of the loads.
Both methods are suitable for a first estimation.
For all ice types different equations are available, but the determination of the parameters is
always the major problem and quite some experience and knowledge of ice characteristics are
recommended.
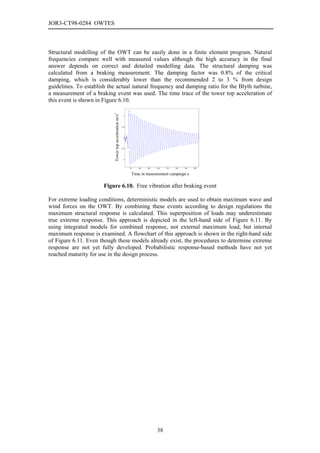
6.2.5 Structural loads
Massive structures, such as gravity base foundations, tend to be very stiff, hence there is
minimal dynamic coupling between the waves and the structure and the loads are straight
forward to calculate.
Slender structures, such as monopiles, are compliant and hence move dynamically to either
shed part of the wave loads or amplify them, depending on how close together the wave and
structural frequencies are. This is shown as the peak in Figure 6.7. It can also be seen that
there is very good agreement between the commercial package SESAM (Det Norske Veritas)
and DUWECS (a turbine design code). The response spectra due to a severe sea state are
shown in Figure 6.8. The results from the Bladed code (GH) are similar to DUWECS and a
proper representation of the wave and current loading has been established.
7.00E+07 3.0E+14
6.00E+07 DUWECS 2.5E+14
SESAM
DUWECS
SMM [N2 m2 s / rad]
5.00E+07 SESAM
2.0E+14
TRF [Nm/m]
4.00E+07
1.5E+14
3.00E+07
1.0E+14
2.00E+07
1.00E+07 5.0E+13
0.00E+00 0.0E+00
0 0.5 1 1.5 2 2.5 3 3.5 4 0 0.5 1 1.5 2 2.5 3
frequency [rad/s] frequency [rad/s]
Figure 6.7: Response transfer function Figure 6.8: Response spectra for a
severe sea state
6.2.6 Summary
For slender support structures, it is recommended that analyses involving a combination of
linear stochastic seas and non-linear regular waves should be performed, as is the current
practice. In shallow sea the non-linear wave model has the preference and it should always be
used in case of extreme wave loading. For stochastic waves the linear waves with Wheeler
stretching seems to be the best compromise because transformation of the non-linear model is
not solved yet. The difference in load predictions of load amplitude and shape of the variation
during passing should however be evaluated during the design process.
For compact structures, it is recommended that diffraction analyses be performed as well as
checks using the Froude-Krylov (or pressure integration) method. During conceptual
evaluation, Morison may be used but care must be taken how the forces on the base slab are
determined. Diffraction theories do not include the effect of the structure on the waves and
some uncertainties will still remain.
36](https://image.slidesharecdn.com/report020-121129010446-phpapp02/85/Report-020-42-320.jpg)


![FINAL REPORT
7 REVIEW OF CERTIFICATION RULES
Germanischer Lloyd’s Regulation for the Certification of Offshore Wind Energy Conversion
Systems [7.1], issued in 1995, is a result of the Joule 1 Offshore study [7.2] by merging the
GL Regulations for the Certification of Wind Energy Conversion Systems [7.3] and the Rules
for Offshore Installations [7.4]. In the meantime since the first issue of the regulation, new
knowledge has been gathered on offshore wind and wave conditions. The measurements on
the Blyth turbines have been used for critical evaluation of the regulations and adjustment to
practical experience.
The objective of this task is to review and, where appropriate, recommend revision of the
current Germanischer Lloyd certification rules for offshore wind turbines. The review
depends to a large extent on the interpretation of the measured data from Blyth (Task 2) as
well as the calculations undertaken for design tool verification (Task 3) and the parametric
study (Task 4).
In a first step a comparison of GL Regulation with other regulations and standards was
performed. In particular GL undertook a review of all existing design standards and
certification rules relating to offshore structures which might have relevance to offshore wind
turbine design. It is also important to note that a number of members of the project
consortium are playing an active role in the development of a new international design
standard for offshore wind turbines, IEC 61400-3. It is clear that the results of the OWTES
project will make a valuable contribution to the development of this new international
standard. Although there is considerably more work to be carried out for this task, the activity
is proceeding in accordance with the scope of work specified in contract JOR3-CT98-0284.
7.1 Review of GL regulations
A review of the certification rules raised questions which can summarized in the following:
• Is a generic design applicable? What should be the generic description?
• Are the descriptions of external conditions correct?
• Load cases sufficient, applicable?
• Load calculation procedures and methods?
• Safety factor strategy. Resolve differences in wind and offshore industry.
• Construction details to be included. Special provisions for offshore wind turbines.
These questions rely on the certification body view point and cannot be complete and
representative for the offshore wind industry. Comments of the project participants regarding
their general experience on the certification rules and the experience from their participation
in the different tasks are included in final report.
From the analysis performed on the site data, the design analysis of the Vestas turbine built up
in Blyth and the robustness analysis following points can be included and analysed:
• Review of the Certification Rules (user perspective)
General experience from the participants having used the GL-Regulation has often
resulted in many questions regarding the usage of the Regulation. This is often solved
by direct contact between user and the certification body engineers. A list of these
points will be drawn up.
• Review of the Certification Rules (scientific perspective)
41](https://image.slidesharecdn.com/report020-121129010446-phpapp02/85/Report-020-47-320.jpg)


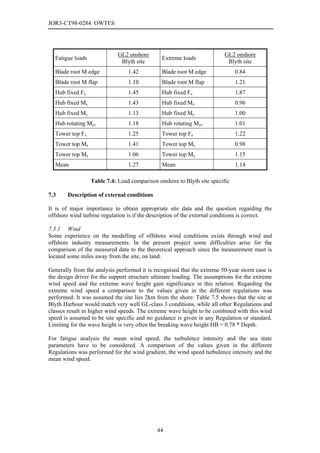
![FINAL REPORT
Regulation 10-min. extreme 3s-extreme comments
GL-OWT 50 61.2 Class 1
GL-OWT 42.5 52.2 Class 2
GL-OWT 37.5 45.9 Class 3
Danish recommendations 41.78 54.82
API 41.2 49.1 typical 31 m/s at 10m
GL-Offshore 46.1 54.0 sheltered waters
Offshore Study [7.2] 42.4
Blyth 36.7 43.45
Table 7.5: 50-year extreme wind speed according to different Regulations and at the Blyth
site
90
GL-Reg. Offshore wind Turbines
80 GL Offshore rules
Danish Recommendations
70 API
Height above MSL [m]
60
50
40
30
20
10
0
9 9.5 10 10.5 11 11.5 12 12.5 13 13.5
Wind speed (10-min- average) [m/s]
Figure 7.1: Wind profile
A comparison of the wind profile from different regulations is shown in Figure 7.1. The
diagram shows considerable difference in the wind gradient. While the GL Regulations for
offshore wind turbines uses an exponential model with an exponent α = 0.11 the offshore
regulations use exponential models with α = 1/8 = 0.125 (GL-Rules) or a logarithmic model
(API). The Danish recommendations for offshore wind turbines use a logarithmic model with
a roughness length of z0 = 0.001. The different approaches for the ambient turbulence
intensity are shown in the Figure 7.2.
45](https://image.slidesharecdn.com/report020-121129010446-phpapp02/85/Report-020-51-320.jpg)
![JOR3-CT98-0284 OWTES
0.2
GL DS IEC b
0.18
IEC c API
0.16
Turbulence intensity
0.14
0.12
0.1
0.08
0.06
0.04
0.02
0
0 5 10 15 20 25 30
Wind speed (10-min. average) [m/s]
Figure 7.2: Ambient wind speed turbulence intensity
It has to be pointed out that the IEC-values are design values to be used in generic design. The
value according to GL-Regulation I = 12% is a design value not including wind farm effects.
Including wind farm influence the turbulence intensity curve changes extremely. Semi
empirical methods are used to define artificial turbulence intensity for the increased loading in
wind farm configuration. In the GL-Regulation the application of those methods is
recommended. If no special analysis is performed in accordance with the site conditions a
constant turbulence intensity of 20% has to be used in fatigue analysis. At the Blyth turbines
measurements have been taken from the nacelle anemometers to calculate the turbulence
intensity at the turbine. These measurements are not very accurate since the influence of the
nacelle and rotor itself are essential. As an indication the measured values are compared to the
values using GL-Regulation in conjunction with the wind farm model developed by Sten
Frandsen.
0.20
Blyth anemometer data
0.19
Sten Frandsen
0.18
Turbulence intensity
0.17
0.16
0.15
0.14
0.13
0.12
0.11
0.10
0 5 10 15 20 25
Wind speed [m/s]
Figure 7.3: Turbulence intensity measured at the turbine nacelle compared to the Regulation
including wind farm influence
46](https://image.slidesharecdn.com/report020-121129010446-phpapp02/85/Report-020-52-320.jpg)
![FINAL REPORT
From the comparison it can be seen that the values assumed for the Blyth site load analysis
are conservative, even if big uncertainty is combined to the nacelle anemometer
measurements. A further decisive point is the mean annual wind speed at the site. The values
given in the different regulations, the assumed and the measured data at the Blyth Harbour
wind farm site are presented in Table 7.6. From the mean wind speed point of view the site
corresponds to GL class 2.
Regulation 10-min. k comments
GL-OT 10 2 Class 1
GL-OT 8.5 2 Class 2
GL-OT 7.5 2 Class 3
Danish
10 / 8.5 1.9 North Sea / Baltic Sea
recommendations
Offshore Study [7.2] 8.2 2.06
Vestas load analysis 8.0 2
Blyth measurement 7.7 2.07
Table 7.6: Annual mean wind speed comparison
7.3.2 Waves
Essential influence in the support structure fatigue design has the sea state and the
combination of the sea states to the wind speed. The waves are described by the long term
distribution of the sea state in the scatter diagram while the short term description is given by
wave spectral representations. The two in offshore industry most frequently used standard
formulations of the wave frequency spectrum in marine applications are the Pierson-
Moskowitz spectrum [7.1] for a fully developed sea and the JONSWAP spectrum (Joint North
Sea Wave Project) [7.5] for a developing sea. The Pierson-Moskowitz and the JONSWAP
spectra were developed for deep water situations. For finite water depth a self-similar spectral
shape, the TMA-Spectrum [7.6], was developed. This spectrum is an extension of the
JONSWAP spectrum and water depth dependant.
In the present case not only the water depth is limited but the distance to the coast is relatively
low. The result will be that the sea state is not fully developed and the wave heights are
limited by the finite water depth. In Figure 7.4 the TMA spectrum and the Pierson Moskowitz
spectrum are compared to representative lumped mean values from the site scatter diagram.
47](https://image.slidesharecdn.com/report020-121129010446-phpapp02/85/Report-020-53-320.jpg)
![JOR3-CT98-0284 OWTES
6.00
GL-Regulation
TMA-Spectrum
5.00
Blyth Scatter Diagram
Significant wave height Hs [m]
4.00
3.00
2.00
1.00
0.00
2.0 4.0 6.0 8.0 10.0 12.0 14.0 16.0 18.0
Wind speed [m/s]
Figure 7.4: Wind speed and significant wave height correlation
It can be seen, that the TMA-spectrum, for fetch and water depth limited sea states and the
PM-spectrum for fully developed sea are capable to cover measured data to a certain degree.
The lumped wind wave correlations contain wave heights for different fetches, wind
directions and wind duration as well as swell. For the lumped wave heights out of the scatter
diagram the site is next to the shore, so the direction of the wind plays an important role in the
wave height. The theoretical spectra also does not contain swell wave, which can be seen in
Figure 7.4 for low wind speeds. From the external data considered it is clear that the
importance of water depth, fetch and time should be taken into account.
In most cases the scatter diagram does not include any information about the wind speed to be
used in combination with the wave height. In these cases theoretical assumptions on the wind
wave correlation have to be built up, based on the JONSWAP equations. These combinations
have many uncertainties since parameters as storm duration, fetch, water depth have big
influence.
A simple method is to correlate the cumulative probability distribution functions of the wind
speed and the significant wave height. From the pairs of same probability of exceedance the
pairs of wind speed and significant wave height are derived. In this process caution has to be
taken for the existence of wind driven sea and swell waves. In this case the analysis has to be
performed for two different distributions of wave heights according to their overall
probability of occurrence.
In the GL-Regulation the original assumptions for the Pierson-Moskowitz spectrum are used.
A major drawback of the equations given in the GL-Regulation is that they do not take
account of the limited water depth at the site. It is clear that they result to extremely high
wave heights.
7.3.3 Wind and wave direction
Directionality of wind, wave and current may be considered if accurate data is available. In
this case not only the mean wind and wave direction have to be considered, but the
distribution of the wind and wave misalignment too. Generally, if no detailed information is
available, it is recommended to apply wind and wave data as unidirectional, acting from the
same direction for the turbines lifetime. In the regulation the wave direction is always the
48](https://image.slidesharecdn.com/report020-121129010446-phpapp02/85/Report-020-54-320.jpg)

![JOR3-CT98-0284 OWTES
In the offshore industry the 1-minute averaged wind speed is usually used in combination
with the extreme wave for the global structure analysis. In [1] a reduced wave height was
derived to be combined with the extreme gust wind speed (5s-average), having the same
probability of occurrence as the combination of maximum wave height with 1-minute
averaged wind speed.
To comply with the requirements of the dynamic analysis and the wave kinematics non-
linearity the present approach includes several realisations of the 50-year storm:
• Dynamic simulation using stochastic wind and waves. This approach uses linear wave
theory – often extended with Wheeler stretching -, and takes full account of the
structure dynamics.
• Simulation using constant (1-minute averaged) wind speed (vred), with correction for
dynamic amplification and deterministic non-linear extreme wave (Hmax = 1.86 Hs).
In this case the extreme wave influence for wave load dominated structures is
considered.
• Simulation using constant (5-second averaged) wind speed, with correction for
dynamic amplification and deterministic non-linear reduced extreme wave
(Hmax = 1.32 Hs). In this case the extreme non-linear wave influence for wind load
dominated structures is considered.
7.5 Summary
From the external data considered it is clear that a major drawback of the GL-Regulation is
the proposal only of the PM-spectrum. Even if in the regulation other spectra are allowed, the
importance of water depth, fetch and time should be mentioned in the regulation. A general
description of the JONSWAP and TMA spectra should be given.
A more detailed description of consideration of the 50 year storm load case and the method of
applying has to be included in the regulation.
A certification of the whole offshore wind turbine structure as in the onshore case,
independent of the site, is not possible. Since the influence of the wave loading on the
machinery is of minor importance, standardised machinery designs may be developed. The
machinery may be certified according to generic classes, as defined in GL´s Regulation for
the Certification for Offshore Wind Turbines. The influence of the site hydraulic and soil
conditions on the support structure is significant, resulting in site specific designs.
50](https://image.slidesharecdn.com/report020-121129010446-phpapp02/85/Report-020-56-320.jpg)


![FINAL REPORT
8.2 Results of gathered experience
Installation and operation of wind turbines in the offshore environment are relatively new
topics, and turbine design as well as concept and method developments are continuously
proceeding.
This section is a summary of design requirements, which primarily are identified through the
experience gained by persons, who are engaged with design, installation and operation of
offshore wind farms.
Edge moment (kNm) Tower bottom roll moment (kNm)
1 0.45
m=4 m=4
m=8 0.4 m=8
0.9
0.35
0.8 0.3
0.25
0.7
[-]
[-]
0.2
0.6 0.15
0.1
0.5
0.05
0.4 0
0 5 10 15 20 25 0 5 10 15 20 25
Wind speed [m/s] Wind speed [m/s]
Tower bottom roll moment (kNm)
0.45
m=4
The three figures represent:
0.4 m=8
Measured values and design values of
0.35
equivalent fatigue edge moment.
0.3
0.25
Measured values and design values of
[-]
0.2
equivalent fatigue roll moment at tower
bottom.
0.15
0.1
Measured values and design values of
0.05
equivalent fatigue downwind moment at tower
0
0 5 10 15
Wind speed [m/s]
20 25
bottom.
Figure 8.2: Comparison of equivalent fatigue loads
8.2.1 General requirements
Many of the interviewed persons have expressed their concern on procedures, activities and
approval related to an offshore wind farm. These concerns can be summarised to recommend
that:
• Scope of work and procedures for approval by certifying bodies and public
authorities should be early identified and scheduled in a phase wise programme.
• The organisational structure for handling the project should be identified at the
earliest possible stage of a project in order to ensure communication routines,
propagation of information, consensus to interfaces etc.
• Requirements set out by various national and international authorities as well as rules
and practices governed by stake holding organisations should be harmonised.
8.2.2 Hydrodynamics and Geotechnics
This section is concentrated on hydrodynamics, geotechnics, monopile foundations and
installation.
53](https://image.slidesharecdn.com/report020-121129010446-phpapp02/85/Report-020-59-320.jpg)


This document summarizes the key findings and recommendations from a research project on design methods for offshore wind turbines installed at exposed sites. The project involved detailed measurements and analysis of environmental conditions and structural loads on a turbine in the Blyth offshore wind farm. Key findings include: waves in shallow water require non-linear modeling; site-specific wave and wind data should be used; design tools were enhanced and validated; foundation models need to account for soil properties; hydrodynamic loading models were evaluated. Recommendations include: revising certification rules to specify wave modeling and extreme loads; developing standard machinery designs while customizing support structures; accounting for water depth and non-linear waves in design.


