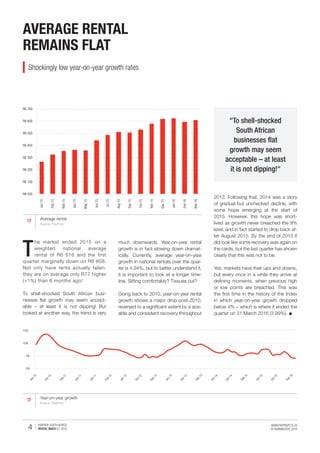
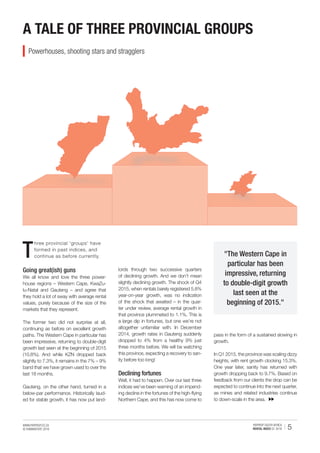
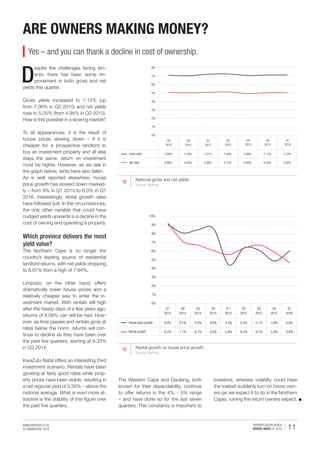
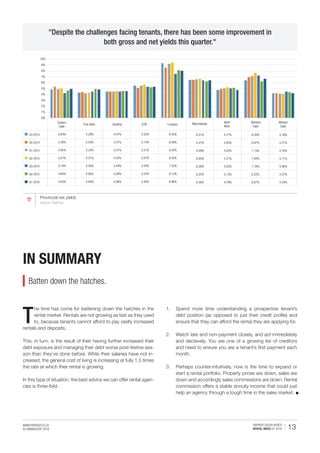
INCLUDING PROVINCIAL
TENANT RISK DATA
THE STATE OF THE RESIDENTIAL
RENTAL MARKET IN SOUTH AFRICA
Q1 2016 JAN - MAR
TENANTS: A RISKY
PROPOSITION
PAGE 7
ARE OWNERS
MAKING MONEY?
PAGE 11
BATTEN DOWN THE
HATCHES
PAGE 13
2 PAYPROP SOUTH AFRICA
RENTAL INDEX Q1 2016
WWW.PAYPROP.CO.ZA
© HUMANSTATE 2016
Darker clouds ahead for the rental market 3
Average rental remains flat 4
A tale of three provincial groups 5
Little cross-band movement 6
The science of tenant risk management 7
Are owners making money? 11
In summary 13
CONTENTS
Q1 2016
WWW.PAYPROP.CO.ZA
© HUMANSTATE 2016 3PAYPROP SOUTH AFRICA
RENTAL INDEX Q1 2016
There’s no getting away from the headlines: It’s bad news on the consumer front.
We were hoping to buck the trend in this first quarterly PayProp Rental Index for
2016, but sadly our view is not that much different. Luckily, there is a silver lining,
as our analysis shows.
The Index bases its findings and recommendations on our ongoing analysis of
actual rental transaction data relating to 80 000-plus properties registered on the
PayProp platform.
Since 2012 the Index has grown in size and innovation, and thousands of agents
rely on its insights to make vital business decisions about their rental portfolio
growth, tenant risk management, regional activities and much more. As usual,
Q1 2016 is packed with actionable insights and new additions, presented in
attractive, easy-to-digest form. Enjoy reading it and if there’s anything I can help
with, please drop me an email or give me a call!
Best regards,
DARKER CLOUDS AHEAD FOR
THE RENTAL MARKET
Louw Liebenberg
CEO
PayProp South Africa
087 820 7368
louw@payprop.co.za
4 PAYPROP SOUTH AFRICA
RENTAL INDEX Q1 2016
WWW.PAYPROP.CO.ZA
© HUMANSTATE 2016
2013. Following that, 2014 was a story
of gradual but unchecked decline, with
some hope emerging at the start of
2015. However, this hope was short-
lived as growth never breached the 8%
level, and in fact started to drop back af-
ter August 2015. By the end of 2015 it
did look like some recovery was again on
the cards, but the last quarter has shown
clearly that this was not to be.
Yes, markets have their ups and downs,
but every once in a while they arrive at
defining moments, when previous high
or low points are breached. This was
the first time in the history of the Index
in which year-on-year growth dropped
below 4% – which is where it ended the
quarter on 31 March 2016 (3.99%).
T
he market ended 2015 on a
weighted national average
rental of R6 616 and the first
quarter marginally down on R6 608.
Not only have rents actually fallen,
they are on average only R77 higher
(+1%) than 6 months ago!
To shell-shocked South African busi-
nesses flat growth may seem accept-
able – at least it is not dipping! But
looked at another way, the trend is very
much downwards. Year-on-year rental
growth is in fact slowing down dramat-
ically. Currently, average year-on-year
growth in national rentals over the quar-
ter is 4.94%, but to better understand it,
it is important to look at a longer time-
line. Sitting comfortably? Tissues out?
Going back to 2010, year-on-year rental
growth shows a major drop post-2010,
reversed to a significant extent by a size-
able and consistent recovery throughout
Year-on-year growth
Source: PayProp
AVERAGE RENTAL
REMAINS FLAT
Shockingly low year-on-year growth rates
"To shell-shocked
South African
businesses flat
growth may seem
acceptable – at least
it is not dipping!"
Average rental
Source: PayProp
R6 000
R6 100
R6 200
R6 300
R6 400
R6 500
R6 600
R6 700
Jan15
Feb15
Mar15
Apr15
May15
Jun15
Jul15
Aug15
Sep15
Oct15
Nov15
Dec15
Jan16
Feb16
Mar16
0%
5%
10%
15%
Jun10
Oct10
Feb11
Jun11
Oct11
Feb12
Jun12
Oct12
Feb13
Jun13
Oct13
Feb14
Jun 14
Oct14
Feb15
Jun15
Oct15
Feb16
WWW.PAYPROP.CO.ZA
© HUMANSTATE 2016 5PAYPROP SOUTH AFRICA
RENTAL INDEX Q1 2016
Going great(ish) guns
We all know and love the three power-
house regions – Western Cape, KwaZu-
lu-Natal and Gauteng – and agree that
they hold a lot of sway with average rental
values, purely because of the size of the
markets that they represent.
The former two did not surprise at all,
continuing as before on excellent growth
paths. The Western Cape in particular has
been impressive, returning to double-digit
growth last seen at the beginning of 2015
(10.8%). And while KZN dropped back
slightly to 7.3%, it remains in the 7% – 9%
band that we have grown used to over the
last 18 months.
Gauteng, on the other hand, turned in a
below-par performance. Historically laud-
ed for stable growth, it has now put land-
A TALE OF THREE PROVINCIAL GROUPS
"The Western Cape in
particular has been
impressive, returning
to double-digit growth
last seen at the
beginning of 2015."
T
hree provincial 'groups' have
formed in past indices, and
continue as before currently.
lords through two successive quarters
of declining growth. And we don’t mean
slightly declining growth. The shock of Q4
2015, when rentals barely registered 5.8%
year-on-year growth, was no indication
of the shock that awaited – in the quar-
ter under review, average rental growth in
that province plummeted to 1.1%. This is
a large dip in fortunes, but one we’re not
altogether unfamiliar with. In December
2014, growth rates in Gauteng suddenly
dropped to 4% from a healthy 9% just
three months before. We will be watching
this province, expecting a recovery to san-
ity before too long!
Declining fortunes
Well, it had to happen. Over our last three
indices we’ve been warning of an impend-
ing decline in the fortunes of the high-flying
Northern Cape, and this has now come to
Powerhouses, shooting stars and stragglers
pass in the form of a sustained slowing in
growth.
In Q1 2015, the province was scaling dizzy
heights, with rent growth clocking 15.3%.
One year later, sanity has returned with
growth dropping back to 9.7%. Based on
feedback from our clients the drop can be
expected to continue into the next quarter,
as mines and related industries continue
to down-scale in the area.
6 PAYPROP SOUTH AFRICA
RENTAL INDEX Q1 2016
WWW.PAYPROP.CO.ZA
© HUMANSTATE 2016
The Eastern Cape also seems to be
on the road to recovery and has grown
ahead of the national curve this quarter.
Joining it are the Free State and North
West, both of which are showing early
signs of a turn-around.
Mixed fortunes
Great news among the stragglers! Lim-
popo seems to have turned the corner
and has now notched up three consec-
utive quarters of positive growth, after as
many in negative territory.
T
here has been very little change in
the distribution of rental contracts
across the different price bands
since the last quarter. The bulk remain
in the R2 500 – R5 000 and R5 000 –
R7 500 categories. And while there has
been some growth in the >R15 000 cat-
egory, 85.8% of all rentals are still below
R10 000 per month.
LITTLE CROSS-BAND MOVEMENT
"While there has been some growth in the
>R15 000 category, 85.8% of all rentals are still
below R10 000 per month."
Stagnation amid flat rental growth
Provincial growth rates
Source: PayProp
Q1 2015 2.5% 4.3% 7.9% 6.8% - 5.1% - 0.8% 0.4% 15.3% 10.0%
Q2 2015 3.4% 7.1% 8.2% 8.0% - 2.7% - 0.4% - 0.4% 11.7% 10.9%
Q3 2015 3.6% 5.3% 8.6% 8.2% 2.6% - 2.2% 2.4% 10.8% 9.5%
Q4 2015 3.7% 5.5% 5.8% 9.4% 3.3% - 2.9% 5.4% 11.4% 8.4%
Q1 2016 6.5% 7.3% 1.1% 7.3% 4.5% - 0.3% 5.9% 9.7% 10.8%
- 10%
- 5%
0%
5%
10%
15%
20%
Eastern
Cape
Free State Gauteng KZN Limpopo Mpumalanga
North
West
Northern
Cape
Western
Cape
Mpumalanga, however, has not been as
fortunate. This region is experiencing its
fifth straight quarter of freefall, with rent-
als actually dropping in absolute terms
each month.
WWW.PAYPROP.CO.ZA
© HUMANSTATE 2016 7PAYPROP SOUTH AFRICA
RENTAL INDEX Q1 2016
E
vidence gathered over the past
quarter shows that damage deposits
could be under pressure.
Referring to the value of the security
deposit required to secure a property
relative to the rental payable for it, the
damage deposit ratio currently averages
1.39. This means the average tenant can
expect to fork out R9 185 before their
first rent payment even falls due! Includ-
ing rent, a new tenant will be required
to put down on average R15 793 before
taking occupancy of a rental property
(this figure excludes any other contract
fees, key deposits, etc.). 		
Fortunately (for the sake of securing
perfectly good tenants who simply can-
not afford paying the earth), this ratio is
declining (down from 1.43 over the last
quarter). Given the current state of the
economy, this is no surprise.
THE SCIENCE OF TENANT RISK
MANAGEMENT
Distribution of price bands
Source: PayProp
Dilution of damage deposit ratio
Q1 2015 Q2 2015 Q3 2015 Q4 2015 Q1 2016
> 15 000 4.0% 4.2% 4.7% 4.8% 5.1%
10 000 - 15 000 7.4% 7.9% 9.0% 9.1% 9.1%
7 500 - 10 000 12.3% 12.7% 13.8% 13.6% 13.6%
5 000 - 7 500 30.1% 30.4% 32.7% 31.7% 31.2%
2 500 - 5 000 37.2% 36.0% 35.7% 32.6% 32.4%
1 000 - 2 500 6.0% 5.8% 5.8% 5.2% 5.8%
< 1 000 3.1% 3.2% 3.2% 2.8% 2.8%
3.1% 3.2% 3.2% 2.8% 2.8%
6.0% 5.8% 5.8% 5.2% 5.8%
37.2% 36.0% 35.7% 32.6% 32.4%
30.1% 30.4% 32.7% 31.7% 31.2%
12.3% 12.7% 13.8% 13.6% 13.6%
7.4% 7.9% 9.0% 9.1% 9.1%
4.0% 4.2% 4.7% 4.8% 5.1%
0%
10%
20%
30%
40%
50%
60%
70%
80%
90%
100%
8 PAYPROP SOUTH AFRICA
RENTAL INDEX Q1 2016
WWW.PAYPROP.CO.ZA
© HUMANSTATE 2016
One explanation for it could be sea-
sonality – we noted a similar ‘post-fes-
tive season’ decline towards the end of
2014.
Fundamentally, it is a matter of afforda-
bility. With consumers under increasing
pressure, affordable deposit replacement
products such as the PayProp Capital
DepositGuarantee provide effective land-
lord protection at affordable monthly in-
surance premiums for tenants.
The post-festive season
hang-over
Thanks to continued strong uptake of
the PayProp Capital Tenant Assessment
Report, the Q1 2016 Index is the first in
which we have statistically significant
tenant credit profile data incorporating
affordability assessments. This allows
the current Index to better track and un-
derstand the seasonality of tenant finan-
cial behaviour.
The data used in the analysis below has
been drawn from more than 30 000 ten-
ants who have applied for tenancies with
PayProp clients (and whose suitability
was assessed at the hand of the Tenant
Assessment Report). The abstracted re-
sults have been used to understand how
the underlying ‘quality’ and behaviour of
tenants affect the market statistics that
we observe.
When looking back over the past two
quarters, the effect of seasonality has
now been reaffirmed with hard data. In
the build-up to the festive season, the
average tenant doubled their number of
NLR (National Loan Register) accounts
(i.e. credit cards, personal loans etc.)
from 3 to 6. Store accounts in the form
of CPA (Credit Provider Association) ac-
counts increased from an average of 7.5
to 8.3.
This would not have been a train smash
if tenants were able to manage their
credit well. Unfortunately, they haven’t
"The average tenant forks out R9 185 just on their deposit."
Damage deposit ratio
Source: PayProp
been doing that. In the ramp-up to the
festive season, prospective tenants in-
creased their exposure from 62% uti-
lisation of their available credit to 69%
at its peak just before December. This
is not the sharpest increase imaginable,
but the position has not returned to nor-
mal either. Currently at 68.4%, tenants’
debt exposure has clearly not recovered,
meaning they have not made a signifi-
cant dent in what they owe.
The distribution of the risk profile of ten-
ants across rental price categories is fur-
ther of interest. As expected, lower-rent-
CPA and NLR accounts
Source: PayProp Capital and Compuscan
Current balances as a percentage of max credit
Source: PayProp Capital and Compuscan
1.15
1.20
1.25
1.30
1.35
1.40
1.45
Jan14
Mar14
May14
Jul14
Sep14
Nov14
Jan15
Mar15
May15
Jul15
Sep15
Nov15
Jan16
Mar16
0
1
2
3
4
5
6
7
8
9
10
Jan15
Feb15
Mar15
Apr15
May15
Jun15
Jul15
Aug15
Sep15
Oct15
Nov15
Dec15
Jan16
Feb16
Mar16
Average number of CPA accounts Average number of NLR accounts
58%
60%
62%
64%
66%
68%
70%
72%
Q1 2015 Q2 2015 Q3 2015 Q4 2015 Q1 2016
To get started with PayProp, visit www.payprop.co.za or email
us at support@payprop.co.za.
PAYPROP – MAKING THE COMPLEX SIMPLE
In the fraction of a second that it takes to submit a payment and receive
approval, PayProp automates multiple complex processes, saving you
hours of work.
Submit payment
SAVES TO AUDIT LOGSETS UP OUTGOING
PAYMENTS
AGENT COMMISSION
CONTRACTORS
LANDLORDS
PAYS BENEFICIARIES
ON SAME DAY
TENANT STATEMENT
LANDLORD STATEMENT UPDATES PAYMENT
RECORDS
RECONCILES TRUST
ACCOUNT
CALCULATES COMMISSION
SENDS NOTIFICATIONS
CHECKS USER
PERMISSIONS
CHECKS PAYMENT
RULES
BENEFICIARY PAYMENT
CONFIRMATION
MUNICIPAL ACCOUNTS
UPDATES AGENT
COMMISSION REPORT
TENANT RECEIPT
CONFIRMATION
Transaction completed
Click... and done.
10 PAYPROP SOUTH AFRICA
RENTAL INDEX Q1 2016
WWW.PAYPROP.CO.ZA
© HUMANSTATE 2016
al tenants are higher-risk tenants – with
the exception of tenants who are renting
above R15  000 per month. Renters in
this band continue to be a riskier pros-
pect than their counterparts who rent in
the R10 000 – R15 000-per-month band.
Possibly, this points to the highest-flying
consumers living above their means.
Are salaries keeping up?
Increased debt exposure and paying
higher rents would not be a problem if
incomes increased at the same rate.
Sadly, this is not the case. Tenant in-
come has stagnated at R30 399 for the
past six months.
It is important to note that this is a pre-
tax self-declared figure for a very specific
sub-set of consumers – namely those
who use estate agents to find accommo-
dation. Even when taking income tax into
account, PayProp tenants’ average in-
come is almost double the average take-
home pay recorded by Mike Schüssler in
"Tenants’ debt
exposure has clearly
not recovered, meaning
they have not made a
significant dent in what
they owe."
High and very high risk
Source: PayProp Capital and Compuscan
Tenant debt and income
Source: PayProp Capital and Compuscan
Tenant financial analysis
Source: PayProp Capital and Compuscan
his BankServ salary review index.
It is only when we combine salary and
debt exposure that the full picture of ten-
ant affordability emerges – a fact that sets
PayProp’s Tenant Assessment Report
apart from other credit scoring mecha-
nisms. With reported tenant income flat-
tening off and increased debt levels, ten-
ants now pay a worrying 36.7% of their
income on settling their debts.
When plotting all of this on a basic ten-
ant income statement, it is clear that af-
ter debt, taxes and rental, tenants have
only R7 351 in disposable income to get
through the month. With inflation cur-
rently at 6.3%, cost of living pressure is
mounting.
65%
54%
42%
37%
30%
26% 27%
0%
10%
20%
30%
40%
50%
60%
70%
< R1 000 R1 000 -
R2 500
R2 500 -
R5 000
R5 000 -
R7 500
R7 500 -
R10 000
R10 000 -
R15 000
> R15 000
Average tenant income
Source: PayProp Capital and Compuscan
R24 000
R26 000
R28 000
R30 000
R32 000
R34 000
Jan15
Feb15
Mar15
Apr15
May15
Jun15
Jul15
Aug15
Sep15
Oct15
Nov15
Dec15
Jan16
Feb16
Mar16
0%
5%
10%
15%
20%
25%
30%
35%
40%
R20 000
R25 000
R30 000
R35 000
R40 000
R45 000
Q1 2015 Q2 2015 Q3 2015 Q4 2015 Q1 2016
% Average debt repayment Average income % Debt repayment relative to income
R30 723
R10 620
R6 608
R6 145
R7 351
R-
R5 000
R10 000
R15 000
R20 000
R25 000
R30 000
R35 000
Income Debt
repayments
Rent Tax Remaining
WWW.PAYPROP.CO.ZA
© HUMANSTATE 2016 11PAYPROP SOUTH AFRICA
RENTAL INDEX Q1 2016
ARE OWNERS MAKING MONEY?
D
espite the challenges facing ten-
ants, there has been some im-
provement in both gross and net
yields this quarter.
Gross yields increased to 7.12% (up
from 7.06% in Q3 2015) and net yields
rose to 5.05% (from 4.94% in Q3 2015).
How is this possible in a slowing market?
To all appearances, it is the result of
house prices slowing down – if it is
cheaper for a prospective landlord to
buy an investment property and all else
stays the same, return on investment
must be higher. However, as we see in
the graph below, rents have also fallen.
As is well reported elsewhere, house
price growth has slowed down marked-
ly – from 9% in Q1 2014 to 6.0% in Q1
2016. Interestingly, rental growth rates
have followed suit. In the circumstances,
the only other variable that could have
nudged yields upwards is a decline in the
cost of owning and operating a property.
Which province delivers the most
yield value?
The Northern Cape is no longer the
country’s leading source of residential
landlord returns, with net yields dropping
to 6.67% from a high of 7.64%.
Limpopo, on the other hand, offers
dramatically lower house prices and a
relatively cheaper way to enter the in-
vestment market. With rentals still high
after the heady days of a few years ago,
returns of 8.06% can still be had. How-
ever, as time passes and rentals grow at
rates below the norm, returns will con-
tinue to decline as they have been over
the past five quarters, starting at 9.33%
in Q3 2014.
KwaZulu-Natal offers an interesting third
investment scenario. Rentals have been
growing at fairly good rates while prop-
erty prices have been stable, resulting in
a net regional yield of 5.30% – above the
national average. What is even more at-
tractive is the stability of this figure over
the past five quarters.
Yes – and you can thank a decline in cost of ownership.
National gross and net yields
Source: PayProp
Q3
2014
Q4
2014
Q1
2015
Q2
2015
Q3
2015
Q4
2015
Q1
2016
Gross yield 7.09% 7.03% 7.21% 7.24% 7.06% 7.11% 7.12%
Net yield 5.08% 5.03% 5.08% 5.13% 4.94% 5.03% 5.05%
0%
1%
2%
3%
4%
5%
6%
7%
8%
Rental growth vs house price growth
Source: PayProp
Q1
2014
Q2
2014
Q3
2014
Q4
2014
Q 1
2015
Q2
2015
Q3
2015
Q4
2015
Q1
2016
House price growth 9.0% 8.1% 8.5% 8.6% 4.4% 6.4% 6.1% 4.9% 6.0%
Rental growth 9.2% 7.1% 6.7% 6.0% 5.6% 6.3% 6.7% 5.9% 4.6%
0%
1%
2%
3%
4%
5%
6%
7%
8%
9%
10%
The Western Cape and Gauteng, both
known for their dependability, continue
to offer returns in the 4% - 5% range
– and have done so for the last seven
quarters. This constancy is important to
investors, whereas volatility could have
the market suddenly turn on home own-
ers (as we expect it to do in the Northern
Cape), ruining the return owners expect.
PAYPROP DEPOSITGUARANTEE
FOR PROPERTY MANAGERS
THE EXCLUSIVE BENEFITS OF DEPOSITGUARANTEE
ONLY AVAILABLE TO PAYPROP AGENTS
Document uploads and payments are
processed through PayProp
SIMPLE NEXT STEP
For further information call us on
087 820 7260 or email us:
support@paypropcapital.com
Innovative insurance designed to
protect your business and your
clients’ needs
PROTECTION
Underwitten by RMB Structured
Insurance Limited
TRUST INTEGRATED
All applications and activations integrated
into your PayProp dashboard
Receive unlimited support from our
specialist team
SUPPORT
2.5 x the monthly rental amount,
covering loss of rental, damages,
utility and legal costs
COVER
Easy claims process that works exactly
like a damage deposit
CLAIMS
DepositGuarantee is available
exclusively to PayProp users
EXCLUSIVE
VIP
Once we’ve received all necessary
documentation, claims are paid out in
under 14 days
FAST
REWARDS
Good tenants get a 40% no-claim
bonus on their premiums
Affordable, scheduled premiums,
protecting tenants’ cashflow
AFFORDABLE
OFFICE 087 820 7260 | FAX 086 615 0176 | SUPPORT@PAYPROPCAPITAL.COM | WWW.PAYPROPCAPITAL.COM
PAYPROP CAPITAL (PTY) LTD IS AN AUTHORISED FINANCIAL SERVICES PROVIDER – FSP 43441
UNDERWRITTEN BY RMB STRUCTURED INSURANCE LIMITED – FSP 1027
WWW.PAYPROP.CO.ZA
© HUMANSTATE 2016 13PAYPROP SOUTH AFRICA
RENTAL INDEX Q1 2016
IN SUMMARY
T
he time has come for battening down the hatches in the
rental market. Rentals are not growing as fast as they used
to, because tenants cannot afford to pay vastly increased
rentals and deposits.
This, in turn, is the result of their having further increased their
debt exposure and managing their debt worse post-festive sea-
son than they’ve done before. While their salaries have not in-
creased, the general cost of living is increasing at fully 1.5 times
the rate at which their rental is growing.
In this type of situation, the best advice we can offer rental agen-
cies is three-fold:
Batten down the hatches.
"Despite the challenges facing tenants, there has been some improvement in
both gross and net yields this quarter."
Provincial net yields
Source: PayProp
Q3 2014 4.83% 4.29% 4.47% 5.52% 9.33% 6.51% 4.77% 6.35% 4.18%
Q4 2014 5.28% 4.43% 4.47% 5.14% 8.58% 6.47% 4.90% 6.97% 4.21%
Q1 2015 4.95% 4.24% 4.51% 5.51% 9.24% 6.59% 5.02% 7.13% 4.16%
Q2 2015 5.01% 4.31% 4.55% 5.67% 9.43% 6.65% 5.21% 7.64% 4.11%
Q3 2015 4.19% 4.50% 4.44% 5.29% 7.52% 6.38% 5.02% 7.16% 4.46%
Q4 2015 4.64% 4.95% 4.58% 5.22% 8.12% 6.25% 5.13% 6.22% 4.37%
Q1 2016 4.93% 4.83% 4.56% 5.30% 8.06% 6.38% 4.78% 6.67% 4.24%
0%
1%
2%
3%
4%
5%
6%
7%
8%
9%
10%
Eastern
Cape
Free State Gauteng KZN Limpopo Mpumalanga
West
Northern
Cape
Western
Cape
North
1.	 Spend more time understanding a prospective tenant’s
debt position (as opposed to just their credit profile) and
ensure that they can afford the rental they are applying for.
2.	 Watch late and non-payment closely, and act immediately
and decisively. You are one of a growing list of creditors
and need to ensure you are a tenant’s first payment each
month.
3.	 Perhaps counter-intuitively, now is the time to expand or
start a rental portfolio. Property prices are down, sales are
down and accordingly sales commissions are down. Rental
commission offers a stable annuity income that could just
help an agency through a tough time in the sales market.
14 PAYPROP SOUTH AFRICA
RENTAL INDEX Q1 2016
WWW.PAYPROP.CO.ZA
© HUMANSTATE 2016
PayProp Rental Index
The PayProp Rental Index is a quarterly guide on trends in the South African residential rental market, and is compiled from actual
transactional data collected by PayProp, the largest processor of residential letting transactions in South Africa. This edition details
market conditions for the first quarter of 2016.
Contact details
This publication has been produced by PayProp South Africa. PayProp South Africa is operated under licence from Humanstate.
PayProp and the PayProp logo are registered trademarks of Humanstate.
For enquiries, please contact:
Louw Liebenberg
CEO:	 Property Payment Solutions (Pty) Ltd
Email: 	 louw@payprop.co.za
Tel:	 087 820 7368
The PayProp Rental Index is available from the PayProp web site at www.payprop.co.za.
Sign up to PayProp
If you would like to know more about using PayProp to manage your rental portfolio, please visit www.payprop.co.za.
Disclaimer
This document is intended as a means for debate and discussion and should not be relied on as legal or professional advice. Whilst
every reasonable effort has been made to ensure the accuracy of the contents, no warranty is made with regard to that content.
PayProp will have no responsibility for any errors or omissions. PayProp recommends you seek professional, legal or technical
advice where necessary. PayProp cannot accept any liability for any loss or damage suffered by any person as a result of the
editorial content, or by any person acting or refraining to act as a result of the material included.
AUTOMATION
PayProp automates all your
outgoing payments. And best of
all, amounts are cleared daily.
Free leases
All PayProp clients have access to complimentary
lease agreements, mandates and tenant application
forms – for life.
Cloud-based
PayProp works on all devices, so you can
approve payments from your mobile device,
wherever you are.
Accounting, banking & portfolio management
rolled into one solution.
SECURE
Your clients’ money and
tenant deposits are safe in our
audited trust environment.
GROW
PayProp takes care of the
admin and allows you to focus
on what is important – growing
your business.
SAVE TIME
Complete overview of your
rental business. See who has
been paid, and who needs to
be paid.
TRUSTED
ACCOUNTING
Full transparency
of your trust account. Auditors
will love you for it.
EFFICIENT
Tenant invoices, receipts and
statements issued automatically
every month. Reconciling rent
payments is a breeze.
Tenant Assessment Report
PayProp Tenant Assessment Reports combine
tenants’ historic payment behaviour with their future
propensity to pay – delivering deeper insight into
tenant risk.
Training & support
PayProp clients enjoy access to free unlimited
training and webinars. We’ll help you get your rental
book on our system in no time, and our dedicated
support team is only a phone call away.
Regulatory compliance
Using PayProp ensures that your trust account
complies with EAAB requirements.
Unlimited users
PayProp allows you to customise user permissions for
as many users as you need, at no additional cost.
www.payprop.co.za | support@payprop.co.za | 087 820 7368PayProp South Africa

rental_index_2016_q1

  • 1.
    INCLUDING PROVINCIAL TENANT RISKDATA THE STATE OF THE RESIDENTIAL RENTAL MARKET IN SOUTH AFRICA Q1 2016 JAN - MAR TENANTS: A RISKY PROPOSITION PAGE 7 ARE OWNERS MAKING MONEY? PAGE 11 BATTEN DOWN THE HATCHES PAGE 13
  • 2.
    2 PAYPROP SOUTHAFRICA RENTAL INDEX Q1 2016 WWW.PAYPROP.CO.ZA © HUMANSTATE 2016 Darker clouds ahead for the rental market 3 Average rental remains flat 4 A tale of three provincial groups 5 Little cross-band movement 6 The science of tenant risk management 7 Are owners making money? 11 In summary 13 CONTENTS Q1 2016
  • 3.
    WWW.PAYPROP.CO.ZA © HUMANSTATE 20163PAYPROP SOUTH AFRICA RENTAL INDEX Q1 2016 There’s no getting away from the headlines: It’s bad news on the consumer front. We were hoping to buck the trend in this first quarterly PayProp Rental Index for 2016, but sadly our view is not that much different. Luckily, there is a silver lining, as our analysis shows. The Index bases its findings and recommendations on our ongoing analysis of actual rental transaction data relating to 80 000-plus properties registered on the PayProp platform. Since 2012 the Index has grown in size and innovation, and thousands of agents rely on its insights to make vital business decisions about their rental portfolio growth, tenant risk management, regional activities and much more. As usual, Q1 2016 is packed with actionable insights and new additions, presented in attractive, easy-to-digest form. Enjoy reading it and if there’s anything I can help with, please drop me an email or give me a call! Best regards, DARKER CLOUDS AHEAD FOR THE RENTAL MARKET Louw Liebenberg CEO PayProp South Africa 087 820 7368 louw@payprop.co.za
  • 4.
    4 PAYPROP SOUTHAFRICA RENTAL INDEX Q1 2016 WWW.PAYPROP.CO.ZA © HUMANSTATE 2016 2013. Following that, 2014 was a story of gradual but unchecked decline, with some hope emerging at the start of 2015. However, this hope was short- lived as growth never breached the 8% level, and in fact started to drop back af- ter August 2015. By the end of 2015 it did look like some recovery was again on the cards, but the last quarter has shown clearly that this was not to be. Yes, markets have their ups and downs, but every once in a while they arrive at defining moments, when previous high or low points are breached. This was the first time in the history of the Index in which year-on-year growth dropped below 4% – which is where it ended the quarter on 31 March 2016 (3.99%). T he market ended 2015 on a weighted national average rental of R6 616 and the first quarter marginally down on R6 608. Not only have rents actually fallen, they are on average only R77 higher (+1%) than 6 months ago! To shell-shocked South African busi- nesses flat growth may seem accept- able – at least it is not dipping! But looked at another way, the trend is very much downwards. Year-on-year rental growth is in fact slowing down dramat- ically. Currently, average year-on-year growth in national rentals over the quar- ter is 4.94%, but to better understand it, it is important to look at a longer time- line. Sitting comfortably? Tissues out? Going back to 2010, year-on-year rental growth shows a major drop post-2010, reversed to a significant extent by a size- able and consistent recovery throughout Year-on-year growth Source: PayProp AVERAGE RENTAL REMAINS FLAT Shockingly low year-on-year growth rates "To shell-shocked South African businesses flat growth may seem acceptable – at least it is not dipping!" Average rental Source: PayProp R6 000 R6 100 R6 200 R6 300 R6 400 R6 500 R6 600 R6 700 Jan15 Feb15 Mar15 Apr15 May15 Jun15 Jul15 Aug15 Sep15 Oct15 Nov15 Dec15 Jan16 Feb16 Mar16 0% 5% 10% 15% Jun10 Oct10 Feb11 Jun11 Oct11 Feb12 Jun12 Oct12 Feb13 Jun13 Oct13 Feb14 Jun 14 Oct14 Feb15 Jun15 Oct15 Feb16
  • 5.
    WWW.PAYPROP.CO.ZA © HUMANSTATE 20165PAYPROP SOUTH AFRICA RENTAL INDEX Q1 2016 Going great(ish) guns We all know and love the three power- house regions – Western Cape, KwaZu- lu-Natal and Gauteng – and agree that they hold a lot of sway with average rental values, purely because of the size of the markets that they represent. The former two did not surprise at all, continuing as before on excellent growth paths. The Western Cape in particular has been impressive, returning to double-digit growth last seen at the beginning of 2015 (10.8%). And while KZN dropped back slightly to 7.3%, it remains in the 7% – 9% band that we have grown used to over the last 18 months. Gauteng, on the other hand, turned in a below-par performance. Historically laud- ed for stable growth, it has now put land- A TALE OF THREE PROVINCIAL GROUPS "The Western Cape in particular has been impressive, returning to double-digit growth last seen at the beginning of 2015." T hree provincial 'groups' have formed in past indices, and continue as before currently. lords through two successive quarters of declining growth. And we don’t mean slightly declining growth. The shock of Q4 2015, when rentals barely registered 5.8% year-on-year growth, was no indication of the shock that awaited – in the quar- ter under review, average rental growth in that province plummeted to 1.1%. This is a large dip in fortunes, but one we’re not altogether unfamiliar with. In December 2014, growth rates in Gauteng suddenly dropped to 4% from a healthy 9% just three months before. We will be watching this province, expecting a recovery to san- ity before too long! Declining fortunes Well, it had to happen. Over our last three indices we’ve been warning of an impend- ing decline in the fortunes of the high-flying Northern Cape, and this has now come to Powerhouses, shooting stars and stragglers pass in the form of a sustained slowing in growth. In Q1 2015, the province was scaling dizzy heights, with rent growth clocking 15.3%. One year later, sanity has returned with growth dropping back to 9.7%. Based on feedback from our clients the drop can be expected to continue into the next quarter, as mines and related industries continue to down-scale in the area.
  • 6.
    6 PAYPROP SOUTHAFRICA RENTAL INDEX Q1 2016 WWW.PAYPROP.CO.ZA © HUMANSTATE 2016 The Eastern Cape also seems to be on the road to recovery and has grown ahead of the national curve this quarter. Joining it are the Free State and North West, both of which are showing early signs of a turn-around. Mixed fortunes Great news among the stragglers! Lim- popo seems to have turned the corner and has now notched up three consec- utive quarters of positive growth, after as many in negative territory. T here has been very little change in the distribution of rental contracts across the different price bands since the last quarter. The bulk remain in the R2 500 – R5 000 and R5 000 – R7 500 categories. And while there has been some growth in the >R15 000 cat- egory, 85.8% of all rentals are still below R10 000 per month. LITTLE CROSS-BAND MOVEMENT "While there has been some growth in the >R15 000 category, 85.8% of all rentals are still below R10 000 per month." Stagnation amid flat rental growth Provincial growth rates Source: PayProp Q1 2015 2.5% 4.3% 7.9% 6.8% - 5.1% - 0.8% 0.4% 15.3% 10.0% Q2 2015 3.4% 7.1% 8.2% 8.0% - 2.7% - 0.4% - 0.4% 11.7% 10.9% Q3 2015 3.6% 5.3% 8.6% 8.2% 2.6% - 2.2% 2.4% 10.8% 9.5% Q4 2015 3.7% 5.5% 5.8% 9.4% 3.3% - 2.9% 5.4% 11.4% 8.4% Q1 2016 6.5% 7.3% 1.1% 7.3% 4.5% - 0.3% 5.9% 9.7% 10.8% - 10% - 5% 0% 5% 10% 15% 20% Eastern Cape Free State Gauteng KZN Limpopo Mpumalanga North West Northern Cape Western Cape Mpumalanga, however, has not been as fortunate. This region is experiencing its fifth straight quarter of freefall, with rent- als actually dropping in absolute terms each month.
  • 7.
    WWW.PAYPROP.CO.ZA © HUMANSTATE 20167PAYPROP SOUTH AFRICA RENTAL INDEX Q1 2016 E vidence gathered over the past quarter shows that damage deposits could be under pressure. Referring to the value of the security deposit required to secure a property relative to the rental payable for it, the damage deposit ratio currently averages 1.39. This means the average tenant can expect to fork out R9 185 before their first rent payment even falls due! Includ- ing rent, a new tenant will be required to put down on average R15 793 before taking occupancy of a rental property (this figure excludes any other contract fees, key deposits, etc.). Fortunately (for the sake of securing perfectly good tenants who simply can- not afford paying the earth), this ratio is declining (down from 1.43 over the last quarter). Given the current state of the economy, this is no surprise. THE SCIENCE OF TENANT RISK MANAGEMENT Distribution of price bands Source: PayProp Dilution of damage deposit ratio Q1 2015 Q2 2015 Q3 2015 Q4 2015 Q1 2016 > 15 000 4.0% 4.2% 4.7% 4.8% 5.1% 10 000 - 15 000 7.4% 7.9% 9.0% 9.1% 9.1% 7 500 - 10 000 12.3% 12.7% 13.8% 13.6% 13.6% 5 000 - 7 500 30.1% 30.4% 32.7% 31.7% 31.2% 2 500 - 5 000 37.2% 36.0% 35.7% 32.6% 32.4% 1 000 - 2 500 6.0% 5.8% 5.8% 5.2% 5.8% < 1 000 3.1% 3.2% 3.2% 2.8% 2.8% 3.1% 3.2% 3.2% 2.8% 2.8% 6.0% 5.8% 5.8% 5.2% 5.8% 37.2% 36.0% 35.7% 32.6% 32.4% 30.1% 30.4% 32.7% 31.7% 31.2% 12.3% 12.7% 13.8% 13.6% 13.6% 7.4% 7.9% 9.0% 9.1% 9.1% 4.0% 4.2% 4.7% 4.8% 5.1% 0% 10% 20% 30% 40% 50% 60% 70% 80% 90% 100%
  • 8.
    8 PAYPROP SOUTHAFRICA RENTAL INDEX Q1 2016 WWW.PAYPROP.CO.ZA © HUMANSTATE 2016 One explanation for it could be sea- sonality – we noted a similar ‘post-fes- tive season’ decline towards the end of 2014. Fundamentally, it is a matter of afforda- bility. With consumers under increasing pressure, affordable deposit replacement products such as the PayProp Capital DepositGuarantee provide effective land- lord protection at affordable monthly in- surance premiums for tenants. The post-festive season hang-over Thanks to continued strong uptake of the PayProp Capital Tenant Assessment Report, the Q1 2016 Index is the first in which we have statistically significant tenant credit profile data incorporating affordability assessments. This allows the current Index to better track and un- derstand the seasonality of tenant finan- cial behaviour. The data used in the analysis below has been drawn from more than 30 000 ten- ants who have applied for tenancies with PayProp clients (and whose suitability was assessed at the hand of the Tenant Assessment Report). The abstracted re- sults have been used to understand how the underlying ‘quality’ and behaviour of tenants affect the market statistics that we observe. When looking back over the past two quarters, the effect of seasonality has now been reaffirmed with hard data. In the build-up to the festive season, the average tenant doubled their number of NLR (National Loan Register) accounts (i.e. credit cards, personal loans etc.) from 3 to 6. Store accounts in the form of CPA (Credit Provider Association) ac- counts increased from an average of 7.5 to 8.3. This would not have been a train smash if tenants were able to manage their credit well. Unfortunately, they haven’t "The average tenant forks out R9 185 just on their deposit." Damage deposit ratio Source: PayProp been doing that. In the ramp-up to the festive season, prospective tenants in- creased their exposure from 62% uti- lisation of their available credit to 69% at its peak just before December. This is not the sharpest increase imaginable, but the position has not returned to nor- mal either. Currently at 68.4%, tenants’ debt exposure has clearly not recovered, meaning they have not made a signifi- cant dent in what they owe. The distribution of the risk profile of ten- ants across rental price categories is fur- ther of interest. As expected, lower-rent- CPA and NLR accounts Source: PayProp Capital and Compuscan Current balances as a percentage of max credit Source: PayProp Capital and Compuscan 1.15 1.20 1.25 1.30 1.35 1.40 1.45 Jan14 Mar14 May14 Jul14 Sep14 Nov14 Jan15 Mar15 May15 Jul15 Sep15 Nov15 Jan16 Mar16 0 1 2 3 4 5 6 7 8 9 10 Jan15 Feb15 Mar15 Apr15 May15 Jun15 Jul15 Aug15 Sep15 Oct15 Nov15 Dec15 Jan16 Feb16 Mar16 Average number of CPA accounts Average number of NLR accounts 58% 60% 62% 64% 66% 68% 70% 72% Q1 2015 Q2 2015 Q3 2015 Q4 2015 Q1 2016
  • 9.
    To get startedwith PayProp, visit www.payprop.co.za or email us at support@payprop.co.za. PAYPROP – MAKING THE COMPLEX SIMPLE In the fraction of a second that it takes to submit a payment and receive approval, PayProp automates multiple complex processes, saving you hours of work. Submit payment SAVES TO AUDIT LOGSETS UP OUTGOING PAYMENTS AGENT COMMISSION CONTRACTORS LANDLORDS PAYS BENEFICIARIES ON SAME DAY TENANT STATEMENT LANDLORD STATEMENT UPDATES PAYMENT RECORDS RECONCILES TRUST ACCOUNT CALCULATES COMMISSION SENDS NOTIFICATIONS CHECKS USER PERMISSIONS CHECKS PAYMENT RULES BENEFICIARY PAYMENT CONFIRMATION MUNICIPAL ACCOUNTS UPDATES AGENT COMMISSION REPORT TENANT RECEIPT CONFIRMATION Transaction completed Click... and done.
  • 10.
    10 PAYPROP SOUTHAFRICA RENTAL INDEX Q1 2016 WWW.PAYPROP.CO.ZA © HUMANSTATE 2016 al tenants are higher-risk tenants – with the exception of tenants who are renting above R15  000 per month. Renters in this band continue to be a riskier pros- pect than their counterparts who rent in the R10 000 – R15 000-per-month band. Possibly, this points to the highest-flying consumers living above their means. Are salaries keeping up? Increased debt exposure and paying higher rents would not be a problem if incomes increased at the same rate. Sadly, this is not the case. Tenant in- come has stagnated at R30 399 for the past six months. It is important to note that this is a pre- tax self-declared figure for a very specific sub-set of consumers – namely those who use estate agents to find accommo- dation. Even when taking income tax into account, PayProp tenants’ average in- come is almost double the average take- home pay recorded by Mike Schüssler in "Tenants’ debt exposure has clearly not recovered, meaning they have not made a significant dent in what they owe." High and very high risk Source: PayProp Capital and Compuscan Tenant debt and income Source: PayProp Capital and Compuscan Tenant financial analysis Source: PayProp Capital and Compuscan his BankServ salary review index. It is only when we combine salary and debt exposure that the full picture of ten- ant affordability emerges – a fact that sets PayProp’s Tenant Assessment Report apart from other credit scoring mecha- nisms. With reported tenant income flat- tening off and increased debt levels, ten- ants now pay a worrying 36.7% of their income on settling their debts. When plotting all of this on a basic ten- ant income statement, it is clear that af- ter debt, taxes and rental, tenants have only R7 351 in disposable income to get through the month. With inflation cur- rently at 6.3%, cost of living pressure is mounting. 65% 54% 42% 37% 30% 26% 27% 0% 10% 20% 30% 40% 50% 60% 70% < R1 000 R1 000 - R2 500 R2 500 - R5 000 R5 000 - R7 500 R7 500 - R10 000 R10 000 - R15 000 > R15 000 Average tenant income Source: PayProp Capital and Compuscan R24 000 R26 000 R28 000 R30 000 R32 000 R34 000 Jan15 Feb15 Mar15 Apr15 May15 Jun15 Jul15 Aug15 Sep15 Oct15 Nov15 Dec15 Jan16 Feb16 Mar16 0% 5% 10% 15% 20% 25% 30% 35% 40% R20 000 R25 000 R30 000 R35 000 R40 000 R45 000 Q1 2015 Q2 2015 Q3 2015 Q4 2015 Q1 2016 % Average debt repayment Average income % Debt repayment relative to income R30 723 R10 620 R6 608 R6 145 R7 351 R- R5 000 R10 000 R15 000 R20 000 R25 000 R30 000 R35 000 Income Debt repayments Rent Tax Remaining
  • 11.
    WWW.PAYPROP.CO.ZA © HUMANSTATE 201611PAYPROP SOUTH AFRICA RENTAL INDEX Q1 2016 ARE OWNERS MAKING MONEY? D espite the challenges facing ten- ants, there has been some im- provement in both gross and net yields this quarter. Gross yields increased to 7.12% (up from 7.06% in Q3 2015) and net yields rose to 5.05% (from 4.94% in Q3 2015). How is this possible in a slowing market? To all appearances, it is the result of house prices slowing down – if it is cheaper for a prospective landlord to buy an investment property and all else stays the same, return on investment must be higher. However, as we see in the graph below, rents have also fallen. As is well reported elsewhere, house price growth has slowed down marked- ly – from 9% in Q1 2014 to 6.0% in Q1 2016. Interestingly, rental growth rates have followed suit. In the circumstances, the only other variable that could have nudged yields upwards is a decline in the cost of owning and operating a property. Which province delivers the most yield value? The Northern Cape is no longer the country’s leading source of residential landlord returns, with net yields dropping to 6.67% from a high of 7.64%. Limpopo, on the other hand, offers dramatically lower house prices and a relatively cheaper way to enter the in- vestment market. With rentals still high after the heady days of a few years ago, returns of 8.06% can still be had. How- ever, as time passes and rentals grow at rates below the norm, returns will con- tinue to decline as they have been over the past five quarters, starting at 9.33% in Q3 2014. KwaZulu-Natal offers an interesting third investment scenario. Rentals have been growing at fairly good rates while prop- erty prices have been stable, resulting in a net regional yield of 5.30% – above the national average. What is even more at- tractive is the stability of this figure over the past five quarters. Yes – and you can thank a decline in cost of ownership. National gross and net yields Source: PayProp Q3 2014 Q4 2014 Q1 2015 Q2 2015 Q3 2015 Q4 2015 Q1 2016 Gross yield 7.09% 7.03% 7.21% 7.24% 7.06% 7.11% 7.12% Net yield 5.08% 5.03% 5.08% 5.13% 4.94% 5.03% 5.05% 0% 1% 2% 3% 4% 5% 6% 7% 8% Rental growth vs house price growth Source: PayProp Q1 2014 Q2 2014 Q3 2014 Q4 2014 Q 1 2015 Q2 2015 Q3 2015 Q4 2015 Q1 2016 House price growth 9.0% 8.1% 8.5% 8.6% 4.4% 6.4% 6.1% 4.9% 6.0% Rental growth 9.2% 7.1% 6.7% 6.0% 5.6% 6.3% 6.7% 5.9% 4.6% 0% 1% 2% 3% 4% 5% 6% 7% 8% 9% 10% The Western Cape and Gauteng, both known for their dependability, continue to offer returns in the 4% - 5% range – and have done so for the last seven quarters. This constancy is important to investors, whereas volatility could have the market suddenly turn on home own- ers (as we expect it to do in the Northern Cape), ruining the return owners expect.
  • 12.
    PAYPROP DEPOSITGUARANTEE FOR PROPERTYMANAGERS THE EXCLUSIVE BENEFITS OF DEPOSITGUARANTEE ONLY AVAILABLE TO PAYPROP AGENTS Document uploads and payments are processed through PayProp SIMPLE NEXT STEP For further information call us on 087 820 7260 or email us: support@paypropcapital.com Innovative insurance designed to protect your business and your clients’ needs PROTECTION Underwitten by RMB Structured Insurance Limited TRUST INTEGRATED All applications and activations integrated into your PayProp dashboard Receive unlimited support from our specialist team SUPPORT 2.5 x the monthly rental amount, covering loss of rental, damages, utility and legal costs COVER Easy claims process that works exactly like a damage deposit CLAIMS DepositGuarantee is available exclusively to PayProp users EXCLUSIVE VIP Once we’ve received all necessary documentation, claims are paid out in under 14 days FAST REWARDS Good tenants get a 40% no-claim bonus on their premiums Affordable, scheduled premiums, protecting tenants’ cashflow AFFORDABLE OFFICE 087 820 7260 | FAX 086 615 0176 | SUPPORT@PAYPROPCAPITAL.COM | WWW.PAYPROPCAPITAL.COM PAYPROP CAPITAL (PTY) LTD IS AN AUTHORISED FINANCIAL SERVICES PROVIDER – FSP 43441 UNDERWRITTEN BY RMB STRUCTURED INSURANCE LIMITED – FSP 1027
  • 13.
    WWW.PAYPROP.CO.ZA © HUMANSTATE 201613PAYPROP SOUTH AFRICA RENTAL INDEX Q1 2016 IN SUMMARY T he time has come for battening down the hatches in the rental market. Rentals are not growing as fast as they used to, because tenants cannot afford to pay vastly increased rentals and deposits. This, in turn, is the result of their having further increased their debt exposure and managing their debt worse post-festive sea- son than they’ve done before. While their salaries have not in- creased, the general cost of living is increasing at fully 1.5 times the rate at which their rental is growing. In this type of situation, the best advice we can offer rental agen- cies is three-fold: Batten down the hatches. "Despite the challenges facing tenants, there has been some improvement in both gross and net yields this quarter." Provincial net yields Source: PayProp Q3 2014 4.83% 4.29% 4.47% 5.52% 9.33% 6.51% 4.77% 6.35% 4.18% Q4 2014 5.28% 4.43% 4.47% 5.14% 8.58% 6.47% 4.90% 6.97% 4.21% Q1 2015 4.95% 4.24% 4.51% 5.51% 9.24% 6.59% 5.02% 7.13% 4.16% Q2 2015 5.01% 4.31% 4.55% 5.67% 9.43% 6.65% 5.21% 7.64% 4.11% Q3 2015 4.19% 4.50% 4.44% 5.29% 7.52% 6.38% 5.02% 7.16% 4.46% Q4 2015 4.64% 4.95% 4.58% 5.22% 8.12% 6.25% 5.13% 6.22% 4.37% Q1 2016 4.93% 4.83% 4.56% 5.30% 8.06% 6.38% 4.78% 6.67% 4.24% 0% 1% 2% 3% 4% 5% 6% 7% 8% 9% 10% Eastern Cape Free State Gauteng KZN Limpopo Mpumalanga West Northern Cape Western Cape North 1. Spend more time understanding a prospective tenant’s debt position (as opposed to just their credit profile) and ensure that they can afford the rental they are applying for. 2. Watch late and non-payment closely, and act immediately and decisively. You are one of a growing list of creditors and need to ensure you are a tenant’s first payment each month. 3. Perhaps counter-intuitively, now is the time to expand or start a rental portfolio. Property prices are down, sales are down and accordingly sales commissions are down. Rental commission offers a stable annuity income that could just help an agency through a tough time in the sales market.
  • 14.
    14 PAYPROP SOUTHAFRICA RENTAL INDEX Q1 2016 WWW.PAYPROP.CO.ZA © HUMANSTATE 2016 PayProp Rental Index The PayProp Rental Index is a quarterly guide on trends in the South African residential rental market, and is compiled from actual transactional data collected by PayProp, the largest processor of residential letting transactions in South Africa. This edition details market conditions for the first quarter of 2016. Contact details This publication has been produced by PayProp South Africa. PayProp South Africa is operated under licence from Humanstate. PayProp and the PayProp logo are registered trademarks of Humanstate. For enquiries, please contact: Louw Liebenberg CEO: Property Payment Solutions (Pty) Ltd Email: louw@payprop.co.za Tel: 087 820 7368 The PayProp Rental Index is available from the PayProp web site at www.payprop.co.za. Sign up to PayProp If you would like to know more about using PayProp to manage your rental portfolio, please visit www.payprop.co.za. Disclaimer This document is intended as a means for debate and discussion and should not be relied on as legal or professional advice. Whilst every reasonable effort has been made to ensure the accuracy of the contents, no warranty is made with regard to that content. PayProp will have no responsibility for any errors or omissions. PayProp recommends you seek professional, legal or technical advice where necessary. PayProp cannot accept any liability for any loss or damage suffered by any person as a result of the editorial content, or by any person acting or refraining to act as a result of the material included.
  • 15.
    AUTOMATION PayProp automates allyour outgoing payments. And best of all, amounts are cleared daily. Free leases All PayProp clients have access to complimentary lease agreements, mandates and tenant application forms – for life. Cloud-based PayProp works on all devices, so you can approve payments from your mobile device, wherever you are. Accounting, banking & portfolio management rolled into one solution. SECURE Your clients’ money and tenant deposits are safe in our audited trust environment. GROW PayProp takes care of the admin and allows you to focus on what is important – growing your business. SAVE TIME Complete overview of your rental business. See who has been paid, and who needs to be paid. TRUSTED ACCOUNTING Full transparency of your trust account. Auditors will love you for it. EFFICIENT Tenant invoices, receipts and statements issued automatically every month. Reconciling rent payments is a breeze. Tenant Assessment Report PayProp Tenant Assessment Reports combine tenants’ historic payment behaviour with their future propensity to pay – delivering deeper insight into tenant risk. Training & support PayProp clients enjoy access to free unlimited training and webinars. We’ll help you get your rental book on our system in no time, and our dedicated support team is only a phone call away. Regulatory compliance Using PayProp ensures that your trust account complies with EAAB requirements. Unlimited users PayProp allows you to customise user permissions for as many users as you need, at no additional cost. www.payprop.co.za | support@payprop.co.za | 087 820 7368PayProp South Africa