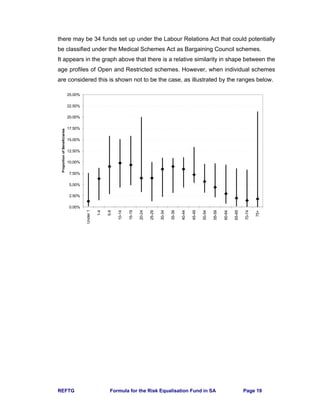
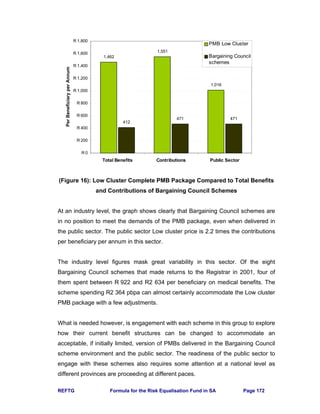
This document summarizes the work of the Formula Consultative Task Team in South Africa to determine an appropriate formula for the country's Risk Equalisation Fund (REF). The REF aims to promote equity and solidarity in South Africa's transition to a social health insurance system with mandatory membership. The Task Team considered evidence and principles for choosing risk factors to include in the REF formula. Key risk factors identified were age, gender, births/first year of life, chronic diseases, and last year of life. The document also discusses defining the scope of benefits to be equalized and guidelines for REF operations and inclusion of different medical scheme types. The goal was to establish a formula that fairly allocates risk across schemes based on member characteristics.


![REFTG Formula for the Risk Equalisation Fund in SA Page 60
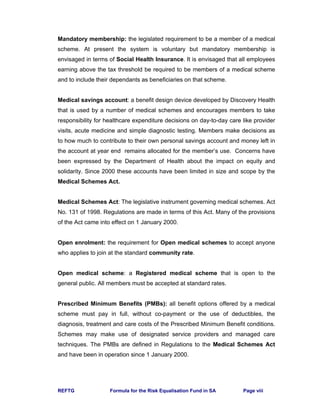
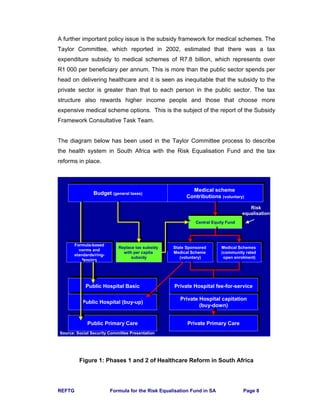
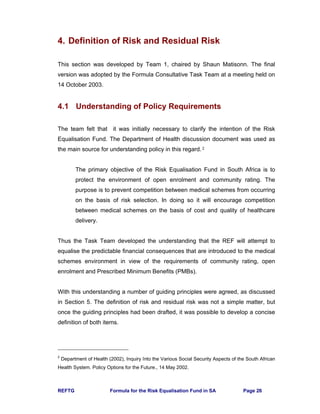
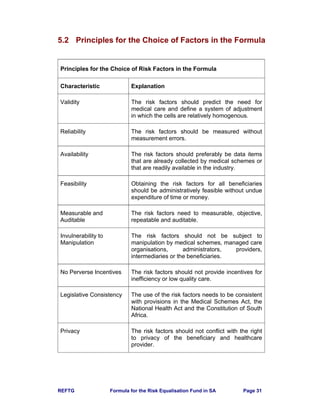
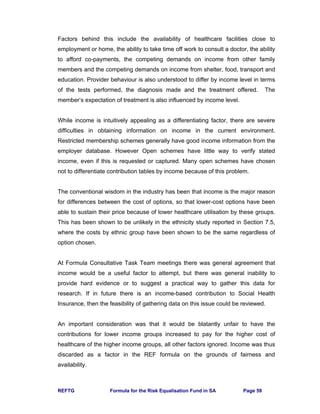
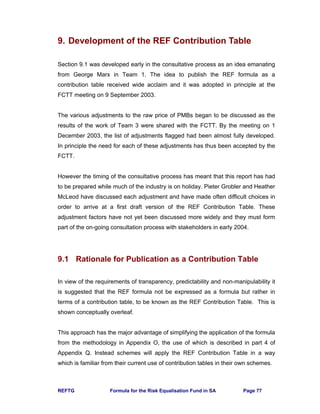
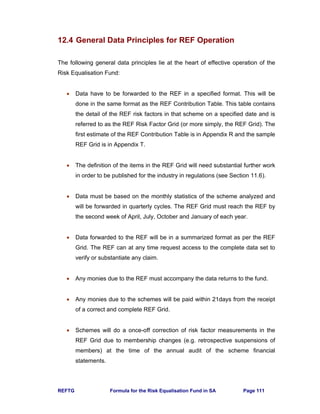
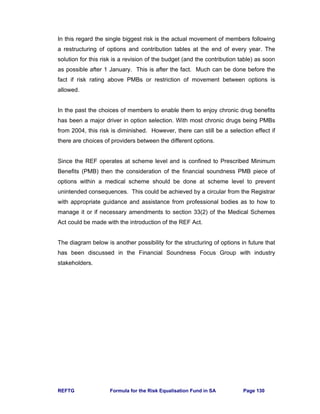
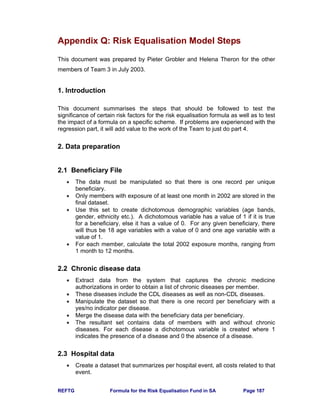
7.9 Chronic Diseases
“Clearly, a healthy 30 year old [male] represents a better business prospect
for an insurer than a 30 year old [male] with a chronic medical condition.”
(White Paper, Ireland, reported in Osburn & McLeod (2003))
Early in the consultative process it was strongly felt that using age and gender (or
deliveries) would be insufficient for risk equalisation and thus some measure of
chronic disease burden would be necessary.
Osburn & McLeod (2003) reported that various studies have shown that major
improvements can be achieved by extending the set of risk adjustors with
measures of prior utilisation or measures of chronic health status. Indirect
measures of health status may perhaps be measured more reliably than direct
indicators of health status such as the presence or absence of certain chronic
conditions. They considered various health proxies, including prior costs, chronic
health indicators, inpatient diagnostic information and self-reported health status.
In South Africa there are several over-riding considerations: the lack of or poor
status of coding of health events and the need for a predominantly prospective
approach that will incentivise efficiency. The use of prior costs, actual expenditure
on prescription medicine or previous hospitalisations, as well as in-patient
diagnostic information are thus ruled out for consideration. Self-reported health
status was not considered a reliable instrument and it was feared this could be
subject to manipulation. In the longer term a preference has been expressed for
the use of Diagnosis Related Groupings (DRGs). However the coding required for
analysis by DRGs is not fully implemented at present.
With the introduction in 2004 of the Chronic Disease List conditions as part of
Prescribed Minimum Benefits (see Appendix P for list), attention is focused on
these chronic diseases. It was resolved to explore the possibility of using the
numbers of beneficiaries with the 25 CDL conditions.](https://image.slidesharecdn.com/0be10427-a5c9-48c4-9c99-ccd10d50222e-160112150100/85/REF_Task_Group_Jan_2004-74-320.jpg)


![REFTG Formula for the Risk Equalisation Fund in SA Page 87
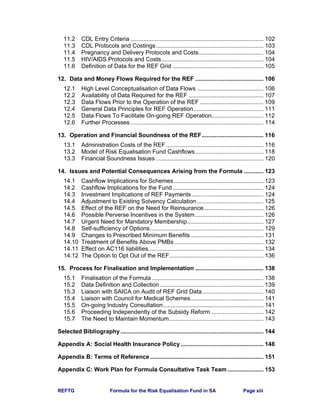
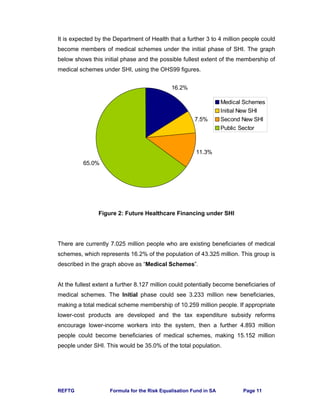
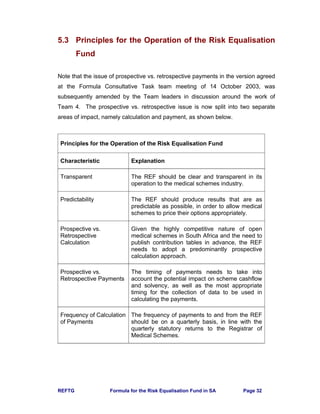
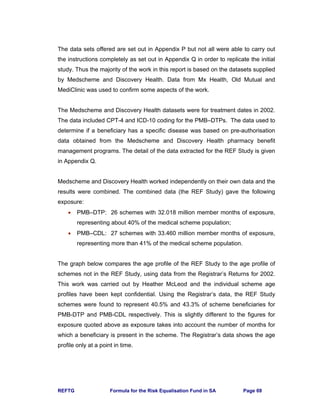
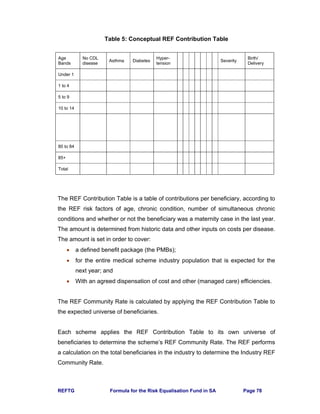
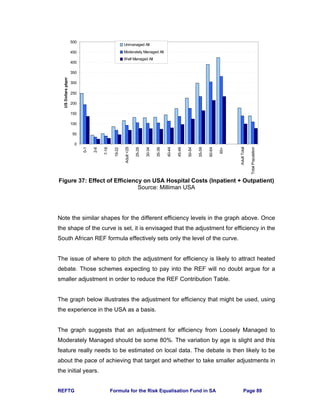
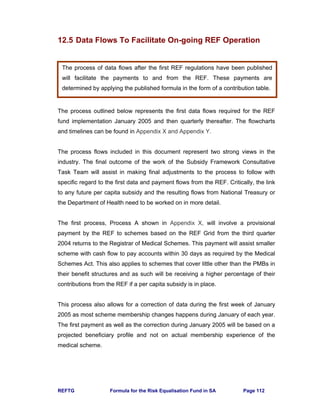
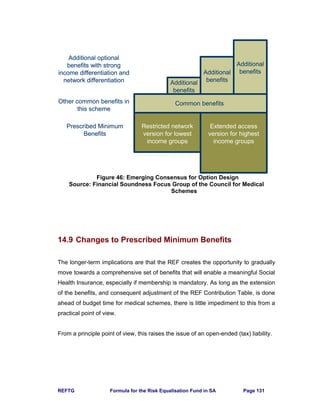
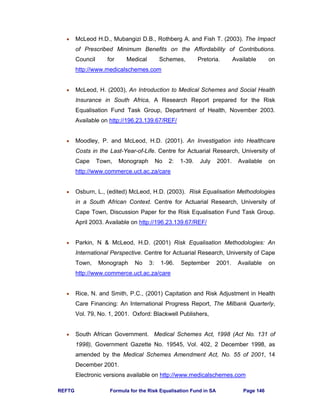
The inflation estimates allow for both price inflation and a utilisation component
because of factors other than changes in the demographic profile (such as new
technology). The recommended inflation adjustments are given in the below.
Table 7: Inflation Adjustment for REF Contribution Table
Year PMB-DTP PMB-CDL
2002 – 2003 11.3% 10.0%
2003 – 2004 9.4% 10.5%
2004 - 2005 9.3% 9.0%
Note that this first estimate of the REF Contribution Table has been prepared using
data from 2002, adjusted to 2004 to facilitate comparison to scheme contribution
tables during 2004. This is described as the REF Contribution Table [Base 2002,
Use 2004].
The first REF Contribution Table for implementation in 2005 would use 2003 data
and be adjusted for inflation to 2005. This would be known as the REF Contribution
Table [Base 2003, Use 2005] to avoid confusion. A first estimate of the inflation for
that Table is suggested above.
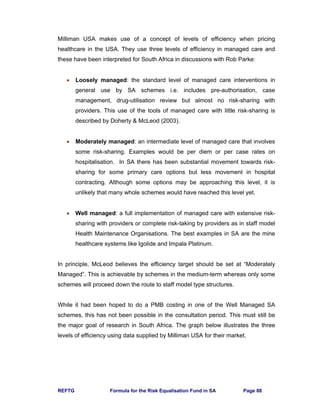
9.6 Adjustment for Efficiency
The Formula Consultative Task team is deeply grateful to Rob Parke and Mark
Litow of Milliman USA, the major actuarial and clinical consulting firm in the USA,
for their assistance on this aspect of the work.
Section 4.2 and Section 5.1 require that the REF seeks to equalise the “most
reasonably achievable efficient cost” of PMBs. The FCTT has considered two ways
to measure this.](https://image.slidesharecdn.com/0be10427-a5c9-48c4-9c99-ccd10d50222e-160112150100/85/REF_Task_Group_Jan_2004-101-320.jpg)


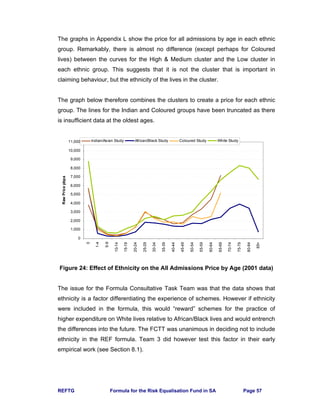
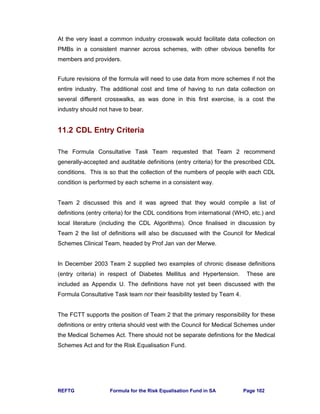
![REFTG Formula for the Risk Equalisation Fund in SA Page 93
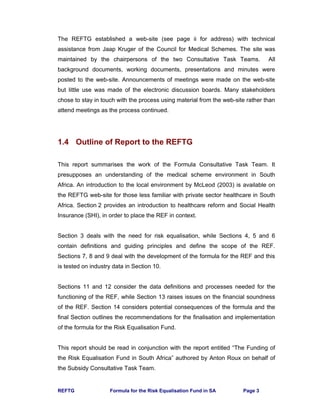
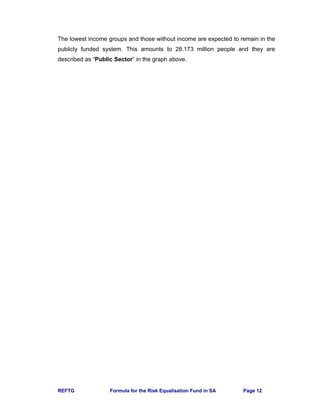
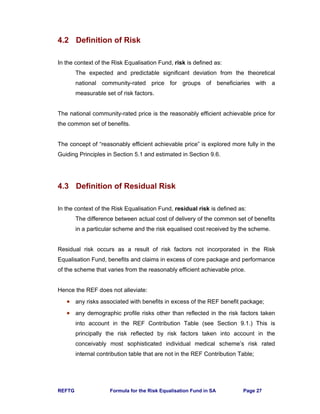
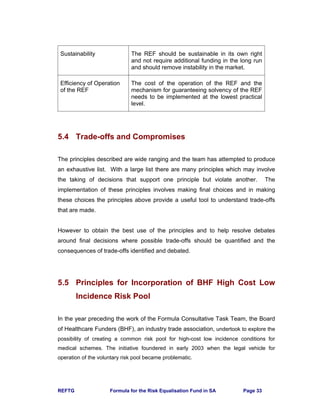
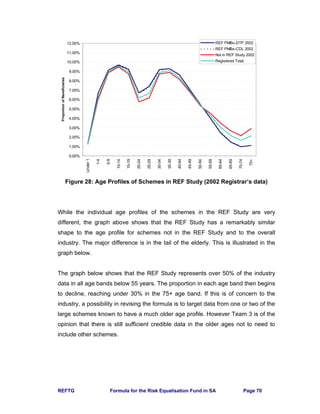
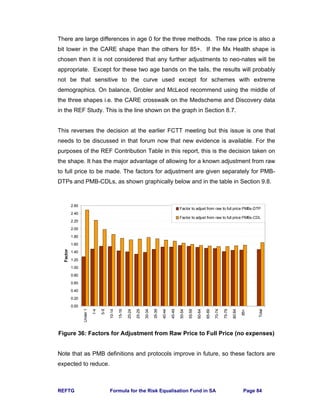
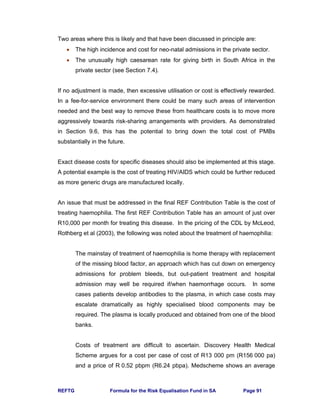
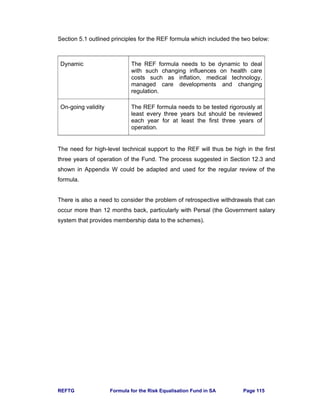
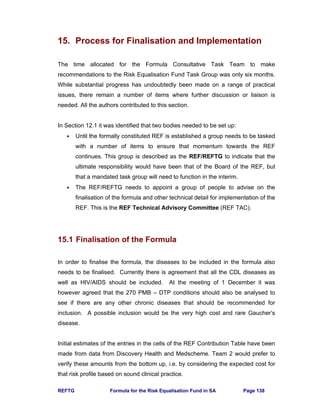
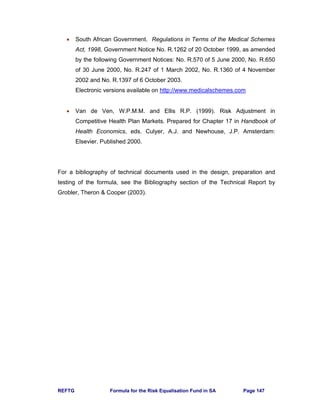
Table 8: Factors for Adjustments to Obtain the REF Contribution Table
9.9 First Estimate of the REF Contribution Table
Using the adjustments discussed above, the raw price of PMBs is adjusted to
obtain the REF Contribution Table [Base 2002, Use 2004] which is given in
Appendix R. Stakeholders are encouraged to use this table to ascertain the impact
on their own schemes. Feedback and comment should be provided to Heather
McLeod to collate for the Risk Equalisation Fund Task Group (see page iii for
contact details).
Factor to
adjust
ethnicity of
raw data
Factor to
adjust from
raw to full
price PMBs-
DTP
Factor to
adjust from
raw to full
price PMBs-
CDL
Factor to
adjust to
Target
Population
Factor to
adjust for
inflation
from 2002
to 2004
Factor to
adjust for
inflation
from 2002
to 2004
Factor for
Efficiency
Factor for
policy
overlay
Section of
report
S 9.2 S 9.3 S 9.3 S 9.4 S 9.5 S 9.5 S 9.6 S 9.7
Apply to Raw data
Raw price
DTP
Raw price
CDL
Industry
age profile
Raw price
DTP
Raw price
CDL
Raw Price Raw Price
Age Bands
not
implemented
this version
none in this
version
Under 1 1.0000 1.2757 2.4901 1.4904 1.2176 1.2155 0.8000 1.0000
1-4 1.0000 1.4785 2.2194 1.4689 1.2176 1.2155 0.8000 1.0000
5-9 1.0000 1.5464 1.9830 1.4790 1.2176 1.2155 0.8000 1.0000
10-14 1.0000 1.5411 1.8563 1.4795 1.2176 1.2155 0.8000 1.0000
15-19 1.0000 1.4326 1.7571 1.4680 1.2176 1.2155 0.8000 1.0000
20-24 1.0000 1.4036 1.7142 1.6746 1.2176 1.2155 0.8000 1.0000
25-29 1.0000 1.3425 1.7327 1.5619 1.2176 1.2155 0.8000 1.0000
30-34 1.0000 1.3908 1.7739 1.4190 1.2176 1.2155 0.8000 1.0000
35-39 1.0000 1.4687 1.7451 1.4168 1.2176 1.2155 0.8000 1.0000
40-44 1.0000 1.5319 1.7115 1.4185 1.2176 1.2155 0.8000 1.0000
45-49 1.0000 1.5313 1.6816 1.4058 1.2176 1.2155 0.8000 1.0000
50-54 1.0000 1.5690 1.6314 1.4936 1.2176 1.2155 0.8000 1.0000
55-59 1.0000 1.5502 1.5951 1.3771 1.2176 1.2155 0.8000 1.0000
60-64 1.0000 1.5238 1.5711 1.3263 1.2176 1.2155 0.8000 1.0000
65-69 1.0000 1.4960 1.5538 1.2361 1.2176 1.2155 0.8000 1.0000
70-74 1.0000 1.4925 1.5409 1.1979 1.2176 1.2155 0.8000 1.0000
75-79 1.0000 1.4130 1.5428 1.3695 1.2176 1.2155 0.8000 1.0000
80-84 1.0000 1.4425 1.5607 1.3155 1.2176 1.2155 0.8000 1.0000
85+ 1.0000 1.4512 1.5750 1.2200 1.2176 1.2155 0.8000 1.0000
Total 1.0000 1.4618 1.6442 1.4602 1.2176 1.2155 0.8000 1.0000](https://image.slidesharecdn.com/0be10427-a5c9-48c4-9c99-ccd10d50222e-160112150100/85/REF_Task_Group_Jan_2004-107-320.jpg)

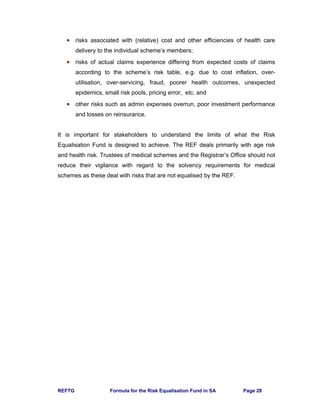
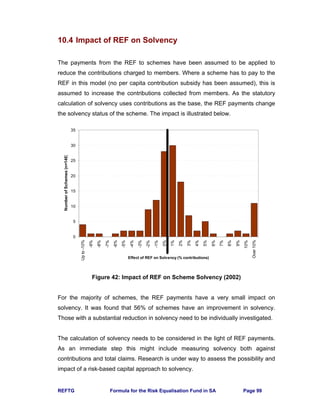
![REFTG Formula for the Risk Equalisation Fund in SA Page 95
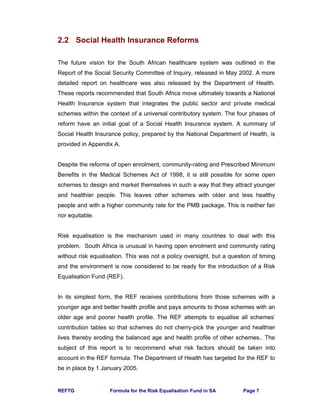
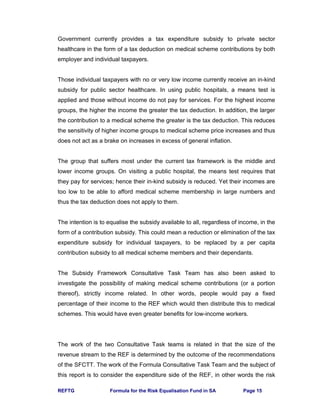
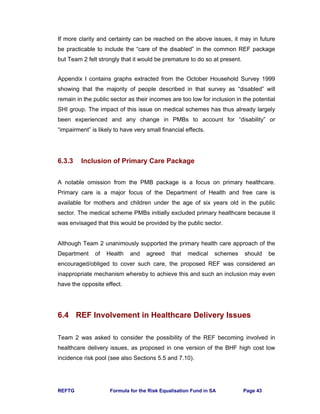
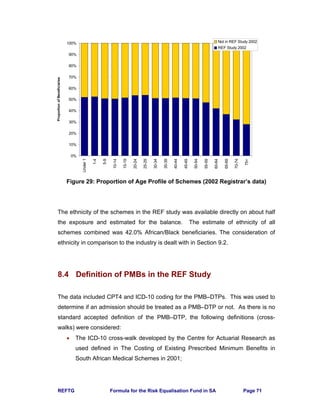
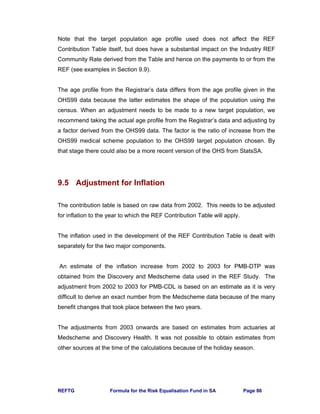
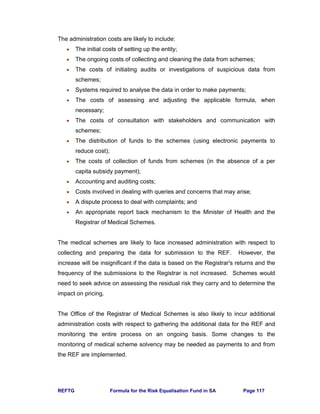
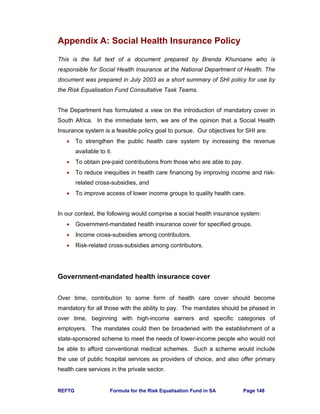
10. Impact of the Risk Equalisation Fund on
Medical Schemes
This section uses data from the Registrar’s Returns for 2002 in order to assess the
impact of the REF on each scheme and hence on the industry. In order to do this
comparison, the REF Contribution Table has been used but without the inflation
adjustment from 2002 to 2004, in other words [Base 2002 Use 2002]. The Industry
REF Community Rate for this Table is calculated using the Registered scheme age
profile as R148.66 per month.
Note that in practice the REF Contribution Table uses not only age, but
confinements, numbers with CDL conditions and numbers with multiple CDL
conditions. The Registrar's Returns for 2002 were the source of age profile
information. As there was no data collected on these other factors, the analysis
that follows uses age only.
The analysis is done using only Registered medical schemes.
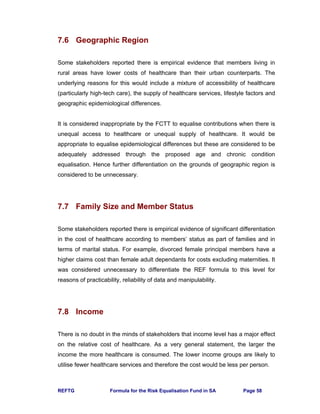
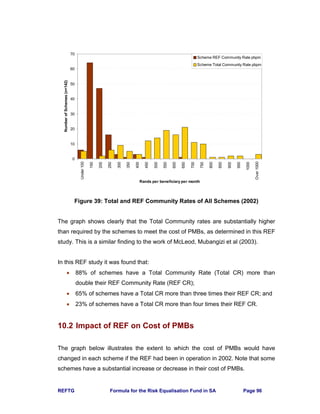
10.1 Scheme REF Community Rate
The REF Community Rate for each scheme is calculated using the age profile and
a version of the REF Contribution Table that has age as the only risk factor.
The Total Community Rate for each scheme is total contributions for that scheme
divided by the number of beneficiaries. Thus this measure includes non-healthcare
costs and an allowance for the solvency margin. Extreme outliers may be due to
small schemes with a large change in membership during year.
The graph below compares the scheme REF Community Rates to Total
Community Rates.](https://image.slidesharecdn.com/0be10427-a5c9-48c4-9c99-ccd10d50222e-160112150100/85/REF_Task_Group_Jan_2004-109-320.jpg)


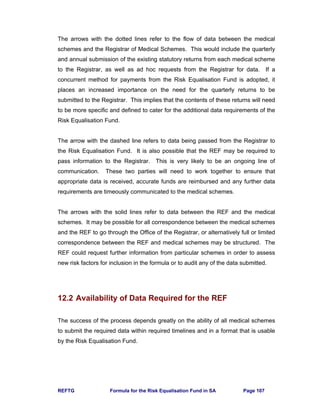


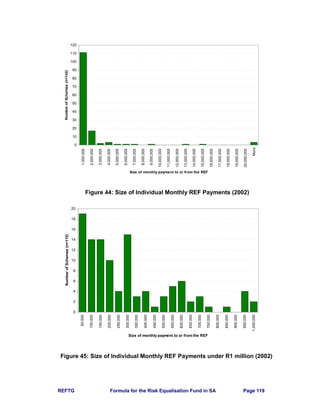
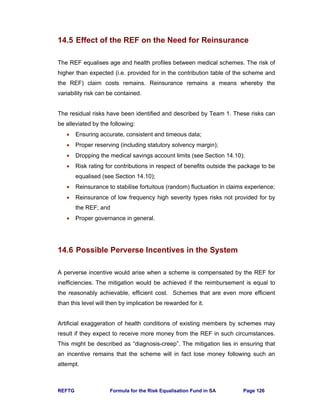
![REFTG Formula for the Risk Equalisation Fund in SA Page 120
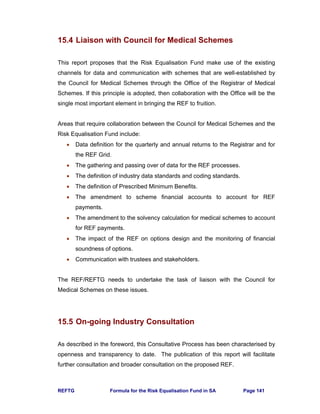
It was found in the REF study that:
• 78% of payments (111 schemes) are less than R1 million per month.
• 23% of payments (33 schemes) are less than R100,000 per month.
• Largest payment is from the REF to a scheme for R27.6 million per month.
• Largest payment by a scheme to the REF is R22.5 million per month.
The total cashflow in each direction is R97.4 million per month or R1.169 billion per
annum. Double this amount, i.e. R2.337 billion, is the first estimate of the size of
the payment needed to ensure that all schemes receive money from the REF,
instead of some schemes paying in and others receiving payments. Note that in
this example, the total cost of PMBs to the industry for 2002 is R998 million per
month or R11.977 billion per annum.
If the 2002 age profiles are applied to the REF Contribution Table [Base 2002, Use
2004] given in Appendix R, then the total cashflow in each direction is estimated to
be R118.5 million per month or R1.422 billion per annum. The amount needed to
ensure that all schemes receive money from the REF is thus R2.844 billion. The
total cost of PMBs to the industry for 2004 is estimated to be R1 215 million per
month or R14.576 billion per annum. These estimates need to be integrated with
the subsidy framework discussions.
13.3 Financial Soundness Issues
The concepts in this section were developed by Shaun Matisonn for Team 6. The
preliminary modelling work was done by Heather McLeod.
The size of payments is very sensitive to the Industry REF Community Rate used.
If for 2002 this is set using the target population for the initial phase of SHI (instead
of the current medical scheme profile, see Section 9.4) the amount is R142.66
pbpm instead of R148.66 pbpm. The largest payment from the REF increases to
R28.8 from R27.6 million and the largest payment by a scheme reduces from
R22.5 to R18.4 million per month.](https://image.slidesharecdn.com/0be10427-a5c9-48c4-9c99-ccd10d50222e-160112150100/85/REF_Task_Group_Jan_2004-134-320.jpg)


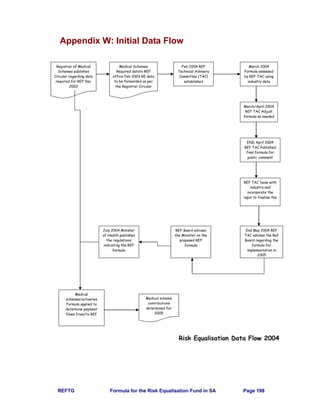
![REFTG Formula for the Risk Equalisation Fund in SA Page 139
At the meeting of 1 December, it was proposed that a subset of the data used in
the REF study be used to compare against hospital data provided by MediClinic.
The hospitals should have a complete clinical record of each admission and this
additional information could be used to verify the shape of the PMB curve.
Some stakeholders feel strongly that an objective party will need to be appointed to
certify the rates.
Once the 2003 data has been run off (by end April 2004), the formula should be
fitted on this more recent data set. It is not essential to gather data from additional
schemes as over half the industry is already represented. Additional sources of
data that can be supplied in the common format are of course appreciated. The
adjustments in Section 9 should then be applied to these new results to obtain the
REF Contribution Table [Base 2003, Use 2005]. This would need to be published
for comment and then revised in time to publish by 31 July 2004 so that schemes
can use it in pricing for January 2005.
The REF Technical Advisory Committee should be set up as soon as possible to
continue the work on the finalisation of the formula, to make decisions in this
regard and to oversee the process. The appointment of an objective party to certify
the work may be a part of this responsibility.
15.2 Data Definition and Collection
A specific area of work that still requires substantial resources is in the definition of
data for collection. The final definition of the data is however dependent on the
definitions of entry criteria for the chronic conditions and maternity. Although this is
primarily of concern for the on-going running of the REF, the definitions of course
also affect the work on the finalisation of the formula discussed above.](https://image.slidesharecdn.com/0be10427-a5c9-48c4-9c99-ccd10d50222e-160112150100/85/REF_Task_Group_Jan_2004-153-320.jpg)


![REFTG Formula for the Risk Equalisation Fund in SA Page 154
Formula Consultative Task Team
Team 1: Definition of Risk and Principles for Choice of Formula
Terms of Reference and Work Plan
1. Develop a definition of the term “risk” as it applies to the Risk Equalisation
Fund.
2. Develop a definition of “residual risk” which needs to be measured to determine
the effectiveness of any particular risk equalisation formula.
3. Develop a set of guiding principles for the final choice of a formula. Suggested
starting points: see CARE discussion document and source documents in that
bibliography; Irish Society of Actuaries document; document by Pieter Grobler.
[Documents on REF Task Team web-site]
4. Consider whether risk equalisation can proceed independently of the subsidy
reform.
5. Present document for discussion at a meeting of Formula Task Team on
Tuesday 9 September 2003.
Note that this team needs to complete work by early September to enable the other
teams to progress their efforts. This team may then be given additional tasks or
may disband at that point with work shifting to other teams in the months
thereafter.
Chair: Shaun Matisonn
Adrian Baskir
Sarah Bennet
Colin Bullen
David Green
George Marx
Penni Putman
Mike Settas
Carel Stadler
Penny Thlabi
REFTG and Heather McLeod
06 August 2003](https://image.slidesharecdn.com/0be10427-a5c9-48c4-9c99-ccd10d50222e-160112150100/85/REF_Task_Group_Jan_2004-168-320.jpg)

![REFTG Formula for the Risk Equalisation Fund in SA Page 156
Formula Consultative Task Team
Team 3: Risk Factors to be Used in Formula
Terms of Reference and Work Plan
1. Identify risk factors not yet in suggested formula by Pieter Grobler. Provide
evidence of impact on risk and residual risks remaining if they are not included
in the formula. [NB. For meeting on 9 September 2003, so that further work can
be initiated if necessary]
2. Test the significance of currently defined risk factors on data in own
environment and share the results. [For 9 September if possible]
3. Test the impact of the Grobler formula on specific schemes in own environment
and share the results. [For 9 September if possible]
4. Consider the evidence for conditions suggested for the BHF high risk pool and
provide evidence of impact on risk and residual risk if not included in formula.
5. Consider the particular issues on risk equalisation as a result of the progression
of the HIV/AIDS epidemic.
6. Make recommendations on the extent of the population to be equalised and the
determination of the risk factors for that population.
7. Recommend the process for the finalisation of the formula in the first half of
2004.
Chair: Pieter Grobler
Corene Agenbach
Thiru Appasamy
Adrian Baskir
Colin Bullen
Barry Childs
Dawid du Plooy
Niyaaz Ebrahim
Mark Ferreira
Dan Krige
Lettie Le Grange
Leon Liedeman
George Marx
Brett Mill
Susan Mynhardt
Richard Parsons
Mike Settas
Helena Theron
Boshoff Steenekamp
Tony Warner
REFTG and Heather McLeod
Saturday, 27 September 2003](https://image.slidesharecdn.com/0be10427-a5c9-48c4-9c99-ccd10d50222e-160112150100/85/REF_Task_Group_Jan_2004-170-320.jpg)


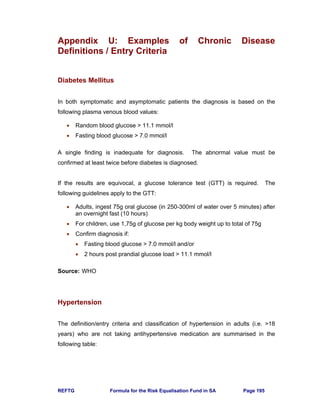
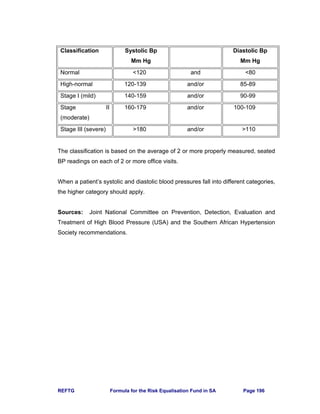
![REFTG Formula for the Risk Equalisation Fund in SA Page 184
Appendix O: Risk Equalisation Fund Payment
Formula
This is a verbatim extract from Technical Report: Risk Equalisation in South African
Medical Schemes by Grobler, Theron and Cooper (2003).
6.1 The general formula
A generic formula for obtaining the subsidy per beneficiary is given below:
∑∑∑ ∑∑∑∑∑ +−+=
i j
ij
i i j
ij
j
ijijij
i j
ijij MTSMMWWMACSub /}]1*))(/[(**{
Subij = The subsidy per annum for beneficiaries with disease i and age band j;
AC = The average cost of the PMB conditions for the total population per
beneficiary per annum;
Wij = The cost weighting given to beneficiaries with disease i and age band j;
Mij = The total number of beneficiaries with disease i and age band j across all
schemes
TS = The total subsidy available for all beneficiaries in all schemes.
Deliveries could be treated as an additional disease for the purpose of making this
formula generic.
It can be seen that the formula is dependant upon the cost of treating the PMB
conditions. The subsidy per scheme obtained will therefore depend on the base
used, namely either private or state hospital costs.
The derivation of the above formula is set out in Appendix A [of the Technical
Report – reproduced overleaf]](https://image.slidesharecdn.com/0be10427-a5c9-48c4-9c99-ccd10d50222e-160112150100/85/REF_Task_Group_Jan_2004-198-320.jpg)
![REFTG Formula for the Risk Equalisation Fund in SA Page 185
Appendix A
A derivation of the formula set out in 6.1 follows below.
Subij = The subsidy per annum for beneficiaries with disease i and age band j;
AC = The average cost for the PMB conditions for the total population under
consideration per beneficiary per annum;
Wij = The cost weighting given to beneficiaries with disease i and age band j;
Mij = The total number of beneficiaries with disease i and age band j across all
schemes
TS = The total subsidy available for all beneficiaries in all schemes;
Cij = The expected cost for the PMB conditions for a beneficiary with disease i
and age band j;
C’ij = The expected cost for the PMB conditions for a beneficiary with disease i
and age band j, net of any Risk Equalisation subsidy.
Now:
ijij WACC *= if ACMMWAC
i j
ijijij
i j
=∑∑∑∑ /)*(* . (1)
In the more general case where the condition in (1) is not met:
∑∑∑∑=
i j
ijijij
i j
ijij MMWWACC *)*(/* . (2)
Per definition:
ijijij CCSub '−= . (3)
Per definition, after the application of Risk Equalisation, all members will have the
same expected cost for the PMB conditions, net of any Risk Equalisation subsidy.
∑∑ ∑∑====∴
i j i j
ijijnm MCCCC /''......'' 1211 (4)
substituting (3) into (4) then gives:
∑∑−=
i j
ijij MTSACC /' (5)
Substituting (2) and (5) into (3) and simplifying gives:
∑∑∑ ∑∑∑∑∑ +−=
i j
ij
i i j
ij
j
ijijij
i j
ijij MTSMMWWMACSub /}]1*))*(/[(**{](https://image.slidesharecdn.com/0be10427-a5c9-48c4-9c99-ccd10d50222e-160112150100/85/REF_Task_Group_Jan_2004-199-320.jpg)

![REFTG Formula for the Risk Equalisation Fund in SA Page 188
• Link hospital pre-authorization data to this dataset to obtain ICD and or CPT
codes applicable to the hospital event.
• Use the list of PMB ICD codes [or another defined crosswalk] to identify
PMB hospital admissions.
• Calculate the total cost of PMB admissions per beneficiary and annualize
through dividing by exposure months and multiplying by 12.
• Identify hospital events with obstetric deliveries (CPTs can be used).
• Merge this dataset with the dataset as created in 2.2. The resultant dataset
will now have an annualized 2002 PMB cost per beneficiary added for
beneficiaries where this cost is applicable. Beneficiaries with no PMB cost
should have a value of 0.
• Create a dichotomous obstetric delivery indicator where 1 indicates that
there was a hospital event where a delivery CPT was identified and 0
indicates that an obstetric delivery was not applicable.
2.4 NAPPI data
• Isolate all NAPPIs claimed by the beneficiaries with at least one CDL
condition.
• Subset NAPPIs further by only using the Primary NAPPIs as defined in The
Costing of the Proposed Chronic Disease List Benefits in South African
Medical Schemes in 2001 (McLeod H et al. 2001).
• Determine compliance per disease. If a primary NAPPI that is applicable to
a certain disease was claimed, but the beneficiary was not identified as
having that disease then the NAPPI is excluded. Also, if a member is
identified with a certain disease (through the authorization of chronic
medicine) but never claimed a primary NAPPI for that disease, then it is
assumed that the beneficiary does not really have the disease.
• Summarize the costs of all disease compliant primary NAPPIs per
beneficiary. Use the tariff or “Blue Book amount since the paid amount may
be influenced by limits and co-payments. This total 2002 CDL cost is
annualized through dividing by exposure months and multiplying by 12.
• Merge the total CDL cost per beneficiary with the dataset as created in step
2.3.
3. Regression methodology
• Obtain statistical software that has the function of stepwise regression
modelling.
• The regression methodology of the PMB and CDL models is similar. In the
case of the PMB model (dataset resultant from 2.3) the dependent variable
is the annualized PMB cost and in the case of the CDL model (dataset
resultant from 2.4) it is the annualized CDL cost. Different sets of
independent variables can be used to obtain different types of models that
can be compared.
• Divide the dataset that is now in the format of one record per beneficiary
randomly into two sets.](https://image.slidesharecdn.com/0be10427-a5c9-48c4-9c99-ccd10d50222e-160112150100/85/REF_Task_Group_Jan_2004-202-320.jpg)
![REFTG Formula for the Risk Equalisation Fund in SA Page 189
• Apply a stepwise regression on the first dataset with the significance level
for entry and staying in the model equal to 0.01 (these probabilities can be
changed depending on the significance levels required).
• Apply a stepwise regression on the second dataset using only independent
variables significant from the model done on the first dataset.
• Apply regression on the total dataset using only independent variables
significant from the model done on the second dataset. Specify that each
record (beneficiary) be weighted by the 2002 exposure months of that
beneficiary.
• Record the goodness of fit measures so that models can be compared.
• Determine the expected cost per beneficiary by applying the final regression
model to the dataset. Observed to expected cost ratios per risk group can
now be determined to further compare various models.
• Scale the regression parameters to obtain final model weights.
4. Testing the subsidy formula [directly]
• Summarise the data per age band and disease combination (taking
deliveries as just another disease), with the beneficiary months as the
variable.
• Calculate the expected cost per age band and disease combination, based
on the formula (see formulae on pages 36 and 37 of the report by Grobler,
Theron & Cooper (2003)).
• Calculate the subsidy per age band and disease combination from the
following:
(i) expected cost per age band and disease combination (calculated
above) divided by (/) the average number of beneficiaries for the
period under review for that combination minus (this gives an
expected cost per beneficiary per annum)
(ii) the average cost per beneficiary per annum of the benefit
package being equalised (one can refer to the PMB costing reports
by McLeod et al. for an indication).
(iii) Take the tax subsidy as 0 at this stage, as this is just a constant
that is added. (This is a simplified version of the formula on page 38
of the Grobler et al report).
• The subsidy per age band and disease combination for the year is then: [(i)
– (ii)] * the average number of beneficiaries for the period under review.
• Sum this over all age band and disease combinations to get the subsidy for
the scheme for the year, assuming a tax subsidy of R0.
Note that Part 4 has been simplified for general industry use by the decision to
publish the formula in the form of a contribution table.](https://image.slidesharecdn.com/0be10427-a5c9-48c4-9c99-ccd10d50222e-160112150100/85/REF_Task_Group_Jan_2004-203-320.jpg)
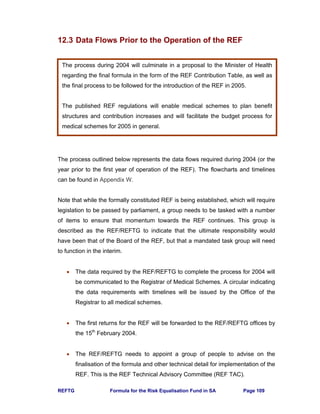
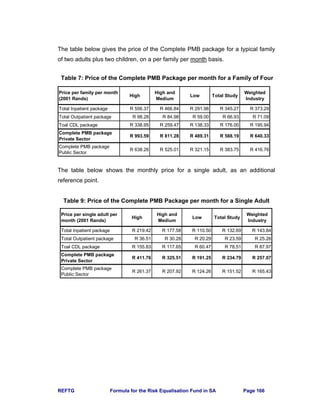
![REFTG Formula for the Risk Equalisation Fund in SA Page 190
Appendix R: REF Contribution Table
ADS AST BCE BMD CHF CMY COP CRF CSD DBI
Column 1 2 3 4 5 6 7 8 9 10 11
Under 1 430.89 680.13 835.38 673.79 1,384.40 1,586.74 1,801.75 1,254.42 5,781.48 2,066.09 1,683.40
1-4 43.51 292.75 448.00 286.41 997.02 1,199.36 1,414.37 867.04 5,394.10 1,678.71 1,296.02
5-9 17.54 266.78 422.03 260.44 971.05 1,173.39 1,388.40 841.07 5,368.13 1,652.74 1,270.05
10-14 16.86 266.10 421.35 259.76 970.37 1,172.71 1,387.72 840.39 5,367.45 1,652.06 1,269.37
15-19 23.06 272.30 427.55 265.96 976.57 1,178.91 1,393.92 846.59 5,373.65 1,658.26 1,275.57
20-24 38.66 287.90 443.15 281.56 992.17 1,194.51 1,409.52 862.19 5,389.25 1,673.86 1,291.17
25-29 54.39 303.63 458.88 297.29 1,007.90 1,210.24 1,425.25 877.92 5,404.98 1,689.59 1,306.90
30-34 62.57 311.81 467.06 305.47 1,016.08 1,218.42 1,433.43 886.10 5,413.16 1,697.77 1,315.08
35-39 74.19 323.43 478.68 317.09 1,027.70 1,230.04 1,445.05 897.72 5,424.78 1,709.39 1,326.70
40-44 81.42 330.66 485.91 324.32 1,034.93 1,237.27 1,452.28 904.95 5,432.01 1,716.62 1,333.93
45-49 96.33 345.57 500.82 339.23 1,049.84 1,252.18 1,467.19 919.86 5,446.92 1,731.53 1,348.84
50-54 123.42 372.66 527.91 366.32 1,076.93 1,279.27 1,494.28 946.95 5,474.01 1,758.62 1,375.93
55-59 156.82 406.06 561.31 399.72 1,110.33 1,312.67 1,527.68 980.35 5,507.41 1,792.02 1,409.33
60-64 244.29 493.53 648.78 487.19 1,197.80 1,400.14 1,615.15 1,067.82 5,594.88 1,879.49 1,496.80
65-69 309.80 559.04 714.29 552.70 1,263.31 1,465.65 1,680.66 1,133.33 5,660.39 1,945.00 1,562.31
70-74 388.61 637.85 793.10 631.51 1,342.12 1,544.46 1,759.47 1,212.14 5,739.20 2,023.81 1,641.12
75-79 410.84 660.08 815.33 653.74 1,364.35 1,566.69 1,781.70 1,234.37 5,761.43 2,046.04 1,663.35
80-84 416.25 665.49 820.74 659.15 1,369.76 1,572.10 1,787.11 1,239.78 5,766.84 2,051.45 1,668.76
85+ 356.98 606.22 761.47 599.88 1,310.49 1,512.83 1,727.84 1,180.51 5,707.57 1,992.18 1,609.49
DM1 DM2 DYS EPL GLC HAE HYL HYP IBD IHD MSS
Column 12 13 14 15 16 17 18 19 20 21 22
Under 1 1,412.08 670.09 893.21 1,263.61 635.98 10,449.66 790.34 713.00 1,371.60 1,291.84 1,669.19
1-4 1,024.70 282.71 505.83 876.23 248.60 10,062.28 402.96 325.62 984.22 904.46 1,281.81
5-9 998.73 256.74 479.86 850.26 222.63 10,036.31 376.99 299.65 958.25 878.49 1,255.84
10-14 998.05 256.06 479.18 849.58 221.95 10,035.63 376.31 298.97 957.57 877.81 1,255.16
15-19 1,004.25 262.26 485.38 855.78 228.15 10,041.83 382.51 305.17 963.77 884.01 1,261.36
20-24 1,019.85 277.86 500.98 871.38 243.75 10,057.43 398.11 320.77 979.37 899.61 1,276.96
25-29 1,035.58 293.59 516.71 887.11 259.48 10,073.16 413.84 336.50 995.10 915.34 1,292.69
30-34 1,043.76 301.77 524.89 895.29 267.66 10,081.34 422.02 344.68 1,003.28 923.52 1,300.87
35-39 1,055.38 313.39 536.51 906.91 279.28 10,092.96 433.64 356.30 1,014.90 935.14 1,312.49
40-44 1,062.61 320.62 543.74 914.14 286.51 10,100.19 440.87 363.53 1,022.13 942.37 1,319.72
45-49 1,077.52 335.53 558.65 929.05 301.42 10,115.10 455.78 378.44 1,037.04 957.28 1,334.63
50-54 1,104.61 362.62 585.74 956.14 328.51 10,142.19 482.87 405.53 1,064.13 984.37 1,361.72
55-59 1,138.01 396.02 619.14 989.54 361.91 10,175.59 516.27 438.93 1,097.53 1,017.77 1,395.12
60-64 1,225.48 483.49 706.61 1,077.01 449.38 10,263.06 603.74 526.40 1,185.00 1,105.24 1,482.59
65-69 1,290.99 549.00 772.12 1,142.52 514.89 10,328.57 669.25 591.91 1,250.51 1,170.75 1,548.10
70-74 1,369.80 627.81 850.93 1,221.33 593.70 10,407.38 748.06 670.72 1,329.32 1,249.56 1,626.91
75-79 1,392.03 650.04 873.16 1,243.56 615.93 10,429.61 770.29 692.95 1,351.55 1,271.79 1,649.14
80-84 1,397.44 655.45 878.57 1,248.97 621.34 10,435.02 775.70 698.36 1,356.96 1,277.20 1,654.55
85+ 1,338.17 596.18 819.30 1,189.70 562.07 10,375.75 716.43 639.09 1,297.69 1,217.93 1,595.28
2 3 4 or more
PAR RHA SCZ SLE TDH HIV MAT CC2 CC3 CC4
Column 23 24 25 26 27 28 29 30 31 32
Under 1 1,256.53 737.50 1,190.20 682.26 480.71 1,902.51 1,398.84 367.30 800.97 1,496.09
1-4 869.15 350.12 802.82 294.88 93.33 1,515.13 1,398.84 367.30 800.97 1,496.09
5-9 843.18 324.15 776.85 268.91 67.36 1,489.16 1,398.84 367.30 800.97 1,496.09
10-14 842.50 323.47 776.17 268.23 66.68 1,488.48 1,398.84 367.30 800.97 1,496.09
15-19 848.70 329.67 782.37 274.43 72.88 1,494.68 1,398.84 367.30 800.97 1,496.09
20-24 864.30 345.27 797.97 290.03 88.48 1,510.28 1,398.84 367.30 800.97 1,496.09
25-29 880.03 361.00 813.70 305.76 104.21 1,526.01 1,398.84 367.30 800.97 1,496.09
30-34 888.21 369.18 821.88 313.94 112.39 1,534.19 1,398.84 367.30 800.97 1,496.09
35-39 899.83 380.80 833.50 325.56 124.01 1,545.81 1,398.84 367.30 800.97 1,496.09
40-44 907.06 388.03 840.73 332.79 131.24 1,553.04 1,398.84 367.30 800.97 1,496.09
45-49 921.97 402.94 855.64 347.70 146.15 1,567.95 1,398.84 367.30 800.97 1,496.09
50-54 949.06 430.03 882.73 374.79 173.24 1,595.04 1,398.84 367.30 800.97 1,496.09
55-59 982.46 463.43 916.13 408.19 206.64 1,628.44 1,398.84 367.30 800.97 1,496.09
60-64 1,069.93 550.90 1,003.60 495.66 294.11 1,715.91 1,398.84 367.30 800.97 1,496.09
65-69 1,135.44 616.41 1,069.11 561.17 359.62 1,781.42 1,398.84 367.30 800.97 1,496.09
70-74 1,214.25 695.22 1,147.92 639.98 438.43 1,860.23 1,398.84 367.30 800.97 1,496.09
75-79 1,236.48 717.45 1,170.15 662.21 460.66 1,882.46 1,398.84 367.30 800.97 1,496.09
80-84 1,241.89 722.86 1,175.56 667.62 466.07 1,887.87 1,398.84 367.30 800.97 1,496.09
85+ 1,182.62 663.59 1,116.29 608.35 406.80 1,828.60 1,398.84 367.30 800.97 1,496.09
REF Contribution Table [Base 2002, Use 2004]
Per Beneficiary Per Month
Industry REF Community Rate R180.69
Age
Bands
Age
Bands
Age
Bands
Modifiers
HIV/AIDSCDL Conditions (continued)
CDL Conditions
CDL Conditions (continued)
No CDL
Diseases
NON
Additions to amounts from Columns 1 to 28
Number of chronic conditions
Maternity](https://image.slidesharecdn.com/0be10427-a5c9-48c4-9c99-ccd10d50222e-160112150100/85/REF_Task_Group_Jan_2004-204-320.jpg)


![REFTG Formula for the Risk Equalisation Fund in SA Page 197
Appendix V: Definition of Data for REF Grid
Important Note: This Appendix is not complete. Further input from Team 2 is
awaited before Team 4 can complete this task.
Data is to be collected monthly, for quarterly submission in the REF Grid (see
Appendix T).
1. Age
Age last birthday as at 01 January of the calendar year of the period of
reporting. A beneficiary is to be counted as 1 for the month if he/she was a
beneficiary for any period during that month.
Age bands are to be interpreted as follows:
“20 to 24” means greater than or equal to age 20 and less than age 25.
“25 to 29” means greater than or equal to age 25 and less than age 30, etc.
2. Maternity/ Delivery
[to be completed]
3. Chronic disease
[to be completed]](https://image.slidesharecdn.com/0be10427-a5c9-48c4-9c99-ccd10d50222e-160112150100/85/REF_Task_Group_Jan_2004-211-320.jpg)