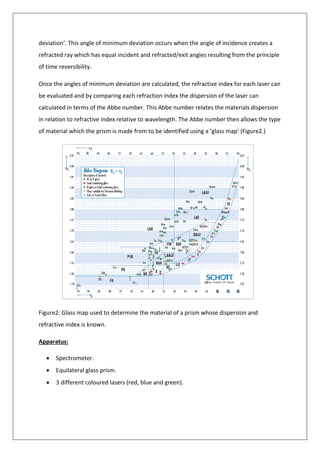
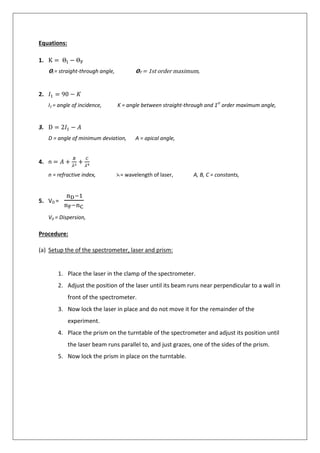
This document summarizes an experiment to determine the refractive index of an unknown prism material. Measurements were taken of the prism's apical angle and angles of minimum deviation for three laser wavelengths. These values were used to calculate the refractive index for each wavelength. Constants A, B, and C were then determined, allowing calculation of the refractive index and dispersion for additional wavelengths. The material was identified as glass using a glass map based on its dispersion and refractive index values. Sources of error and their effects on the results are also discussed.


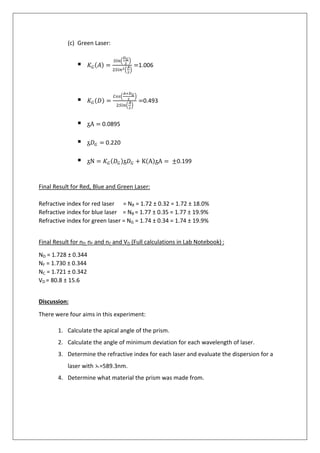
![(c.) Evaluation of the refractive index:
Refractive Index = n =
𝑆𝑖𝑛�
𝐴+𝐷
2
�
𝑆𝑖𝑛�
𝐴
2
�
A + D (Degrees) (A + D)/2 (Radians) A/2 (Radians) Sin [(A + D)/2] Sin(A/2)
Red 119.26724 1.040803014 0.52483505 0.862810451 0.501070263
Blue 125.0684 1.091427685 0.52483505 0.887286294 0.501070263
Green 120.82 1.054353401 0.52483505 0.869581125 0.501070263
{Sin[(A+D)/2]}/{Sin(A/2)} Refractive Index (N)
Red 1.721935055 1.722
Blue 1.770782183 1.771
Green 1.73544748 1.735
(c) Calculation of A, B and C:
(Calculations done in Lab Notebook, with simultaneous equations solved on
www.wolframalpha.com ). Summary of answers as follows:
A = 1.69945nm
B = 8104.74nm2
C = 5.89806*108
nm4
nD =1.728
nF = 1.729
nC = 1.721
VD = 80.8
(d) Error Analysis:
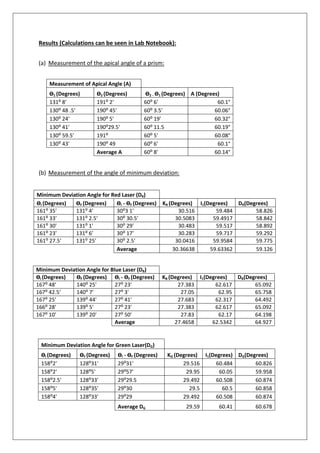
Apical Angle = A = 60.142°
Minimum Deviation Angle for Red Laser = DR = 59.126°
Minimum Deviation Angle for Blue Laser = DB = 64.927°
Minimum Deviation Angle for Green Laser = DG = 60.678°
Wavelength of Red Laser = λR = 650 ± 10 x 10-9
m
Wavelength of Blue Laser = λB = 405 ± 10 x 10-9
m](https://image.slidesharecdn.com/9e9f5f8e-e1c1-4e22-ac3f-269bbb7612b8-160907124631/85/Refractive-Index-Lab-7-320.jpg)