Recipient Site Analysis - CSFR
•
1 like•1,060 views

This document analyzes potential sites for a food redistribution nonprofit in Colorado Springs. GIS mapping shows the sites are located primarily in census tracts with high percentages of impoverished and minority residents who lack nearby grocery stores. Statistical analysis found the tracts containing sites without nearby groceries had significantly higher average rates of poverty and minority populations compared to tracts without sites or with sites near groceries. This suggests expanding the nonprofit's services to these areas could help address health inequities from limited geographic food access.

Recommended
More Related Content
Similar to Recipient Site Analysis - CSFR
Similar to Recipient Site Analysis - CSFR (20)
Recently uploaded
Recently uploaded (20)
Recipient Site Analysis - CSFR
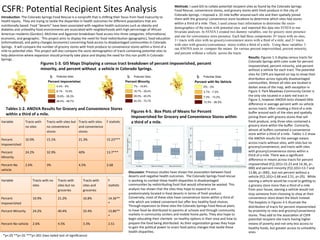
- 1. CSFR: Poten,al Recipient Sites Analysis Introduc)on: The Colorado Springs Food Rescue is a nonprofit that is shi<ing their focus from food insecurity to health equity. They are trying to tackle the dispari,es in health outcomes for different popula,ons that are nutri,onally based. Food “deserts” have been associated with nega,ve health outcomes such as obesity and diabetes and unhealthy food environments are associated with neighborhoods with high percentage of African American residents (Gordon). McEntee and Agyeman breakdown food access into three categories: informa,onal, economic, and geographic. This project aims to display the need for food redistribu,on (geographic), food educa,on (informa,onal), and policy changes (economic) concerning food access to disadvantaged communi,es in Colorado Springs. It will compare the number of grocery stores with fresh produce to convenience stores within a third of a mile to poten,al sites. This project will also compare the socio-‐demographics of tracts containing poten,al sites to help determine where expansion should primarily take place and display the need for this non profit in Colorado Springs . Methods: I used GIS to collate poten,al recipient sites as found by the Colorado Springs Food Rescue, convenience stores, and grocery stores with fresh produce in the city of Colorado Springs. I imposed a .33 mile buffer around each site and then spa,ally joined them with the grocery/ convenience store loca,ons to determine which sites had stores within a third of a mile. Then, I used census tract information to determine the socio- demographics of the tracts with potential sites and imported this data into STATA to run bivariate analyses. In STATA I created two dummy variables, one for grocery store presence and one for convenience store presence. Each had three components: 0= tracts with no sites, 1= tracts with sites with no grocery/convenience stores with a third of a mile, and 2= tracts with sites with grocery/convenience stores within a third of a mile. Using these variables I ran ANOVA tests to compare the means for various percent impoverished, percent minority, and percent without a vehicle across the tracts. Variable Tracts with no sites Tracts with sites but no groceries Tracts with sites and groceries F sta,s,c Percent Impoverished 10.9% 21.2% 16.8% 14.36** * Percent Minority 24.2% 40.4% 33.4% 13.86** * Percent No vehicle 2.6% 4.5% 3.3% 2.51 Variable Tracts with no sites Tracts with sites but no convenience stores Tracts with sites and convenience stores F sta,s,c Percent Impoverished 10.9% 15.1% 21.3% 15.23*** Percent Minority 24.2% 32.9% 40% 13.7*** Percent No vehicle 2.6% 3% 4.5% 2.68 b Potential Sites Percent Impoverished 0.4% - 8% 8.1% - 15.5% 15.6% - 28.3% 28.4% - 48.7% b Potential Sites Percent Minority 7% - 18.6% 18.7% - 29.4% 29.5% - 45.2% 45.3% - 75.7% b Potential Sites Percent with No Vehicle 0% - 3% 3.1% - 7.2% 7.3% - 13.2% 13.3% - 26.2% Figures 1-‐3. GIS Maps Displaying a census tract breakdown of percent impoverished, percent minority, and percent without a vehicle in Colorado Springs. Tables 1-‐2. ANOVA Results for Grocery and Convenience Stores within a third of a mile. Figures 4-‐5. Box Plots of Means for Percent Impoverished for Grocery and Convenience Stores within a third of a mile. Results: Figures 1-‐3 display census tracts for Colorado Springs with color scale for percent impoverished, percent minority, and percent without a vehicle for each tract. The poten,al sites for CSFR are layered on top to show their distribu,on across typically disadvantaged communi,es. Almost all sites are located in darker areas of the map, with excep,on in Figure 3. Park Meadows Community Center is the only site located in a dark red tract in Figure 3, however ANOVA tests showed lible difference in average percent with no vehicle across tracts. A<er crea,ng a third of a mile buffer around each of the sites and spa,ally joining them with grocery stores that sell fresh produce, only three sites contained a grocery store within the buffer. Contrarily, almost all buffers contained a convenience store within a third of a mile. Tables 1-‐2 show the ANOVA results for the average means across tracts without sites, with sites but no grocery/convenience, and tracts with sites with grocery/convenience stores within a third of a mile. There was a significant difference in means across tracts for percent impoverished (F(2,101)=15.23 and 14.36, p=. 000) and percent minority (F(2,101)=13.7 and 13.86, p=.000)., but not percent without a vehicle (F(2,101)=2.68 and 2.51, p>.05). While owning a vehicle would be crucial to gefng to a grocery store more than a third of a mile from your house, owning a vehicle would not stop someone from choosing to shop at their convenience store down the block instead. The boxplots in Figures 4-‐5 illustrate the distribu,on of tracts for percent impoverished by proximity to sites and grocery/convenience stores. They add to the associa,on of CSFR poten,al recipient site tracts having higher means of poverty and not only less access to healthy foods, but greater access to unhealthy ones. Discussion: Previous studies have shown the associa,on between food deserts and nega,ve health outcomes. The Colorado Springs Food rescue is working to combat these health dispari,es in disadvantaged communi,es by redistribu,ng food that would otherwise be wasted. This analysis has shown that the sites they hope to expand to are predominately located in food deserts in terms of fresh produce. Conversely, most of these sites have convenience stores within a third of mile which are indeed convenient but offer less healthy food choices. Through expansion to these sites the Colorado Springs Food Rescue plans to have food be distributed to parents at schools and through community markets in community centers and mobile home parks. They also hope to begin educa,ng their clientele on healthy op,ons in their area and how to prepare the food being distributed. As their organiza,on grows they hope to gain the poli,cal power to enact food policy changes that tackle these health dispari,es. *p<.05 **p<.01 ***p<.001 (two-‐tailed test of significance)