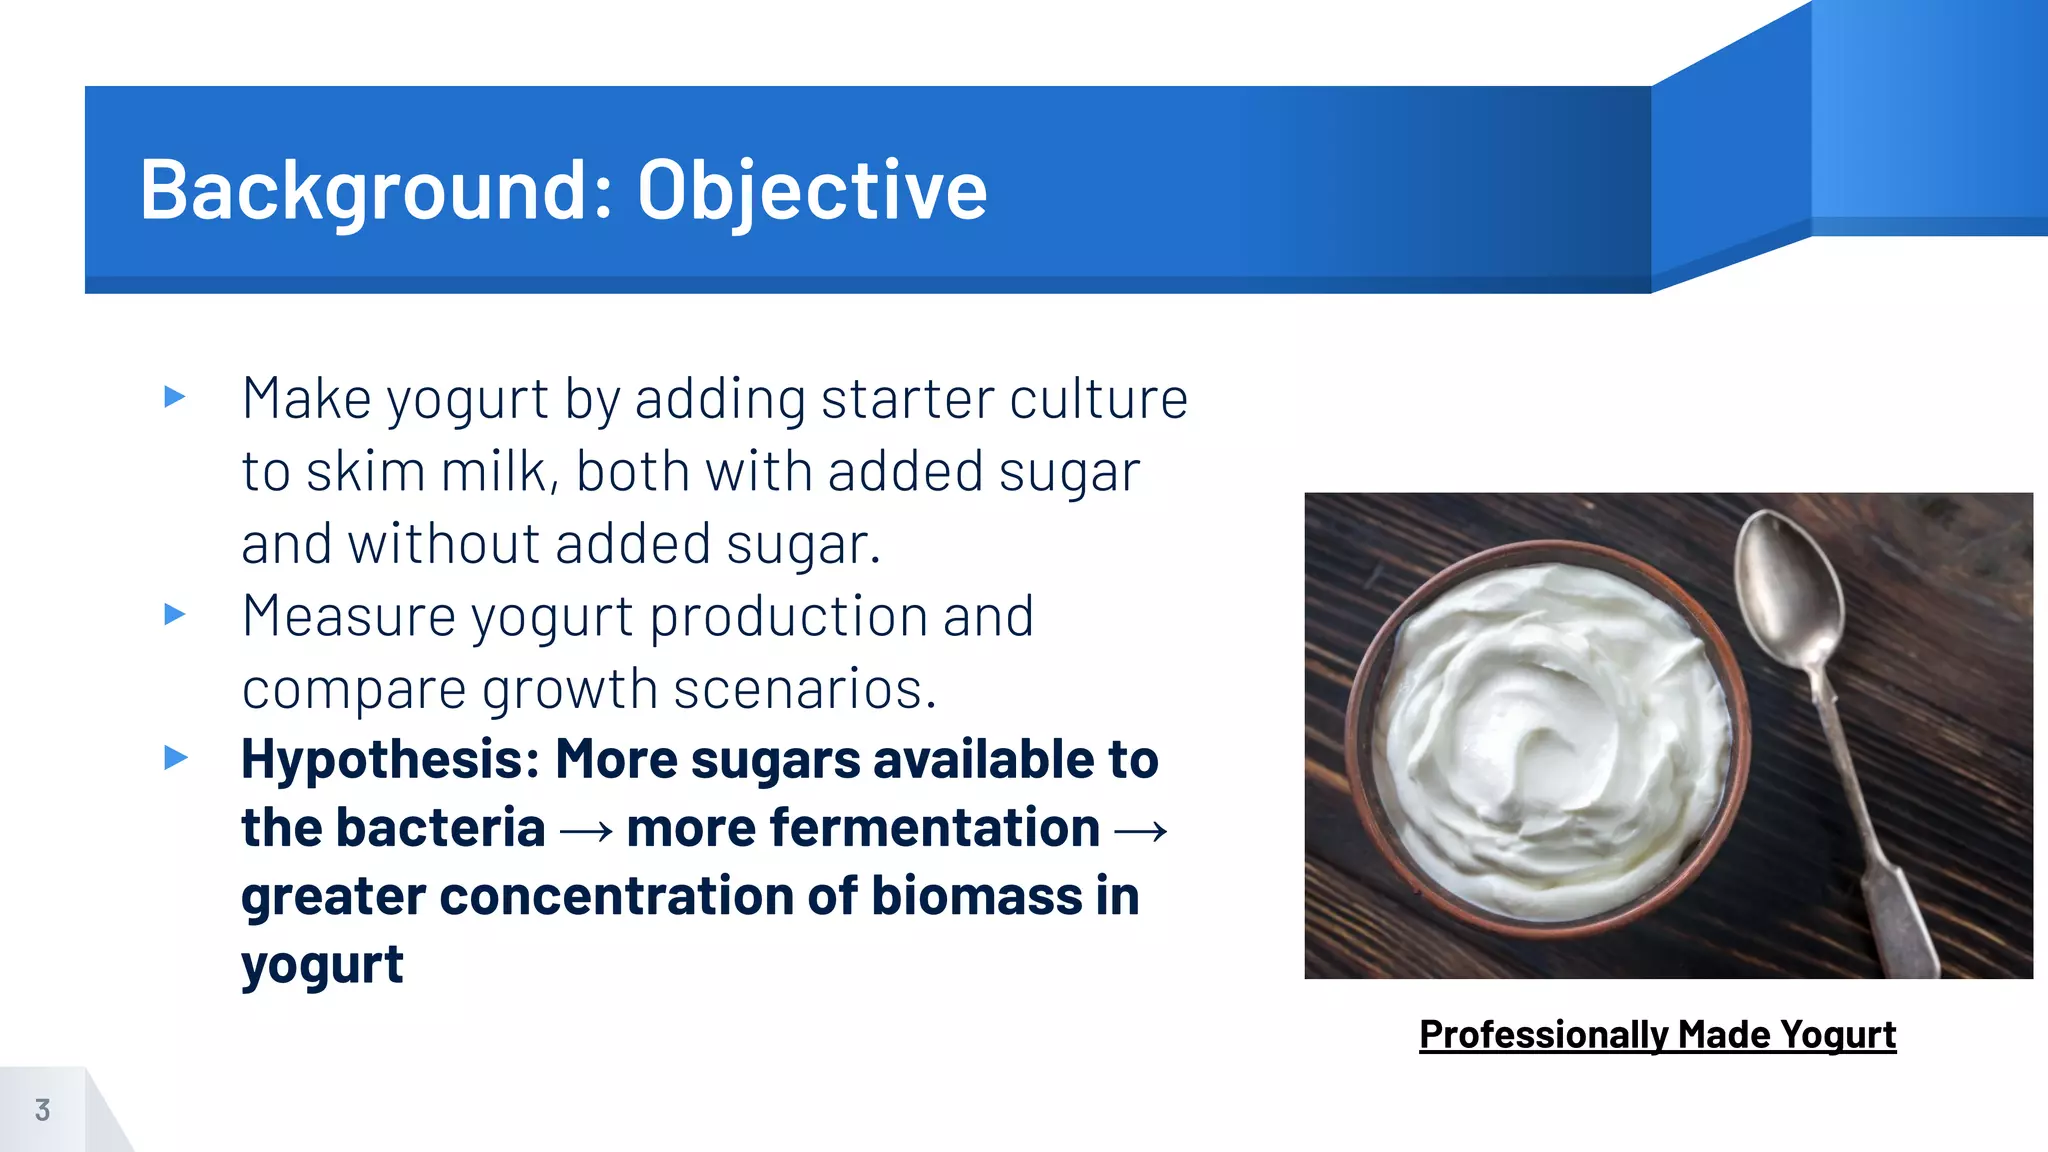
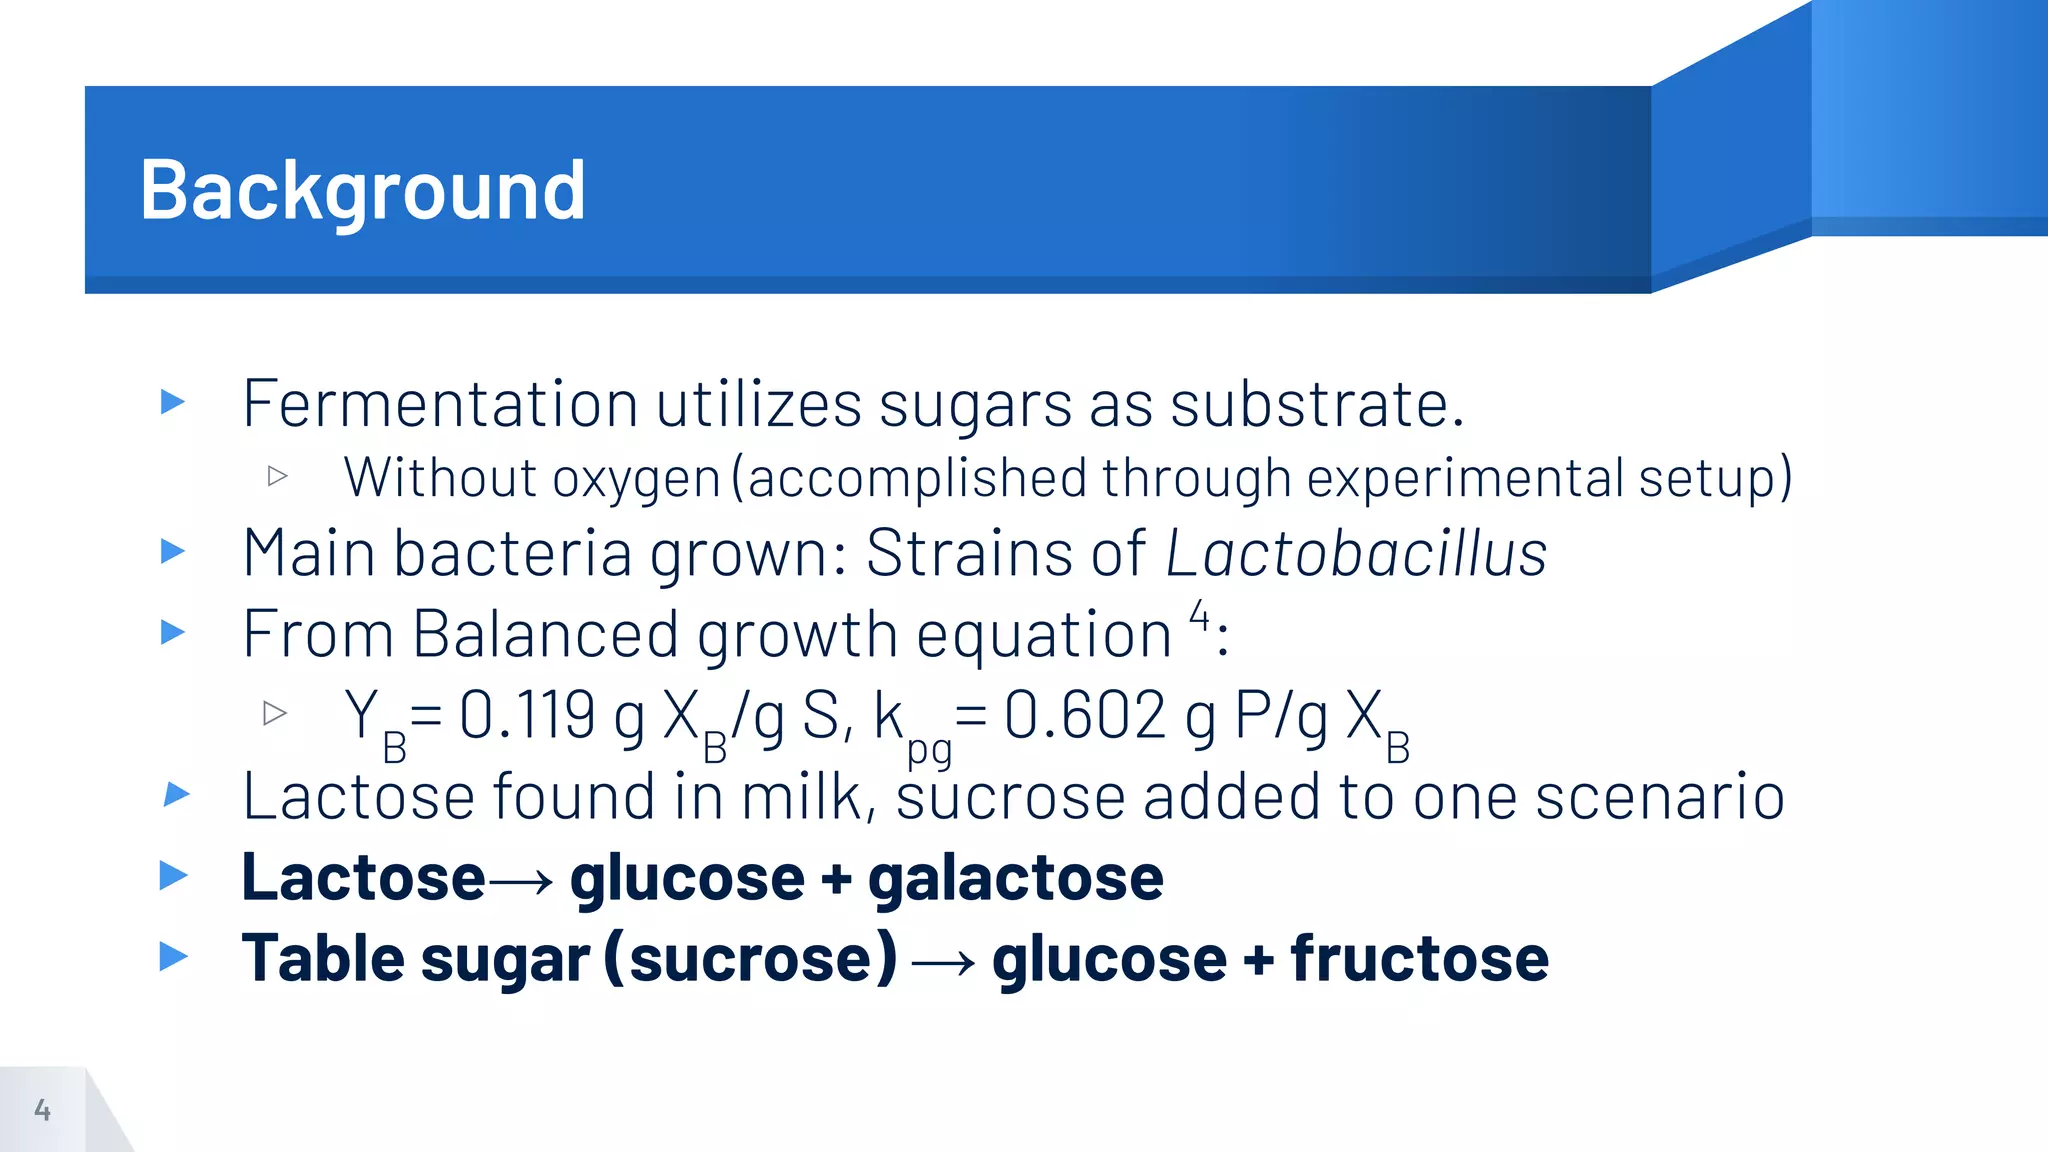
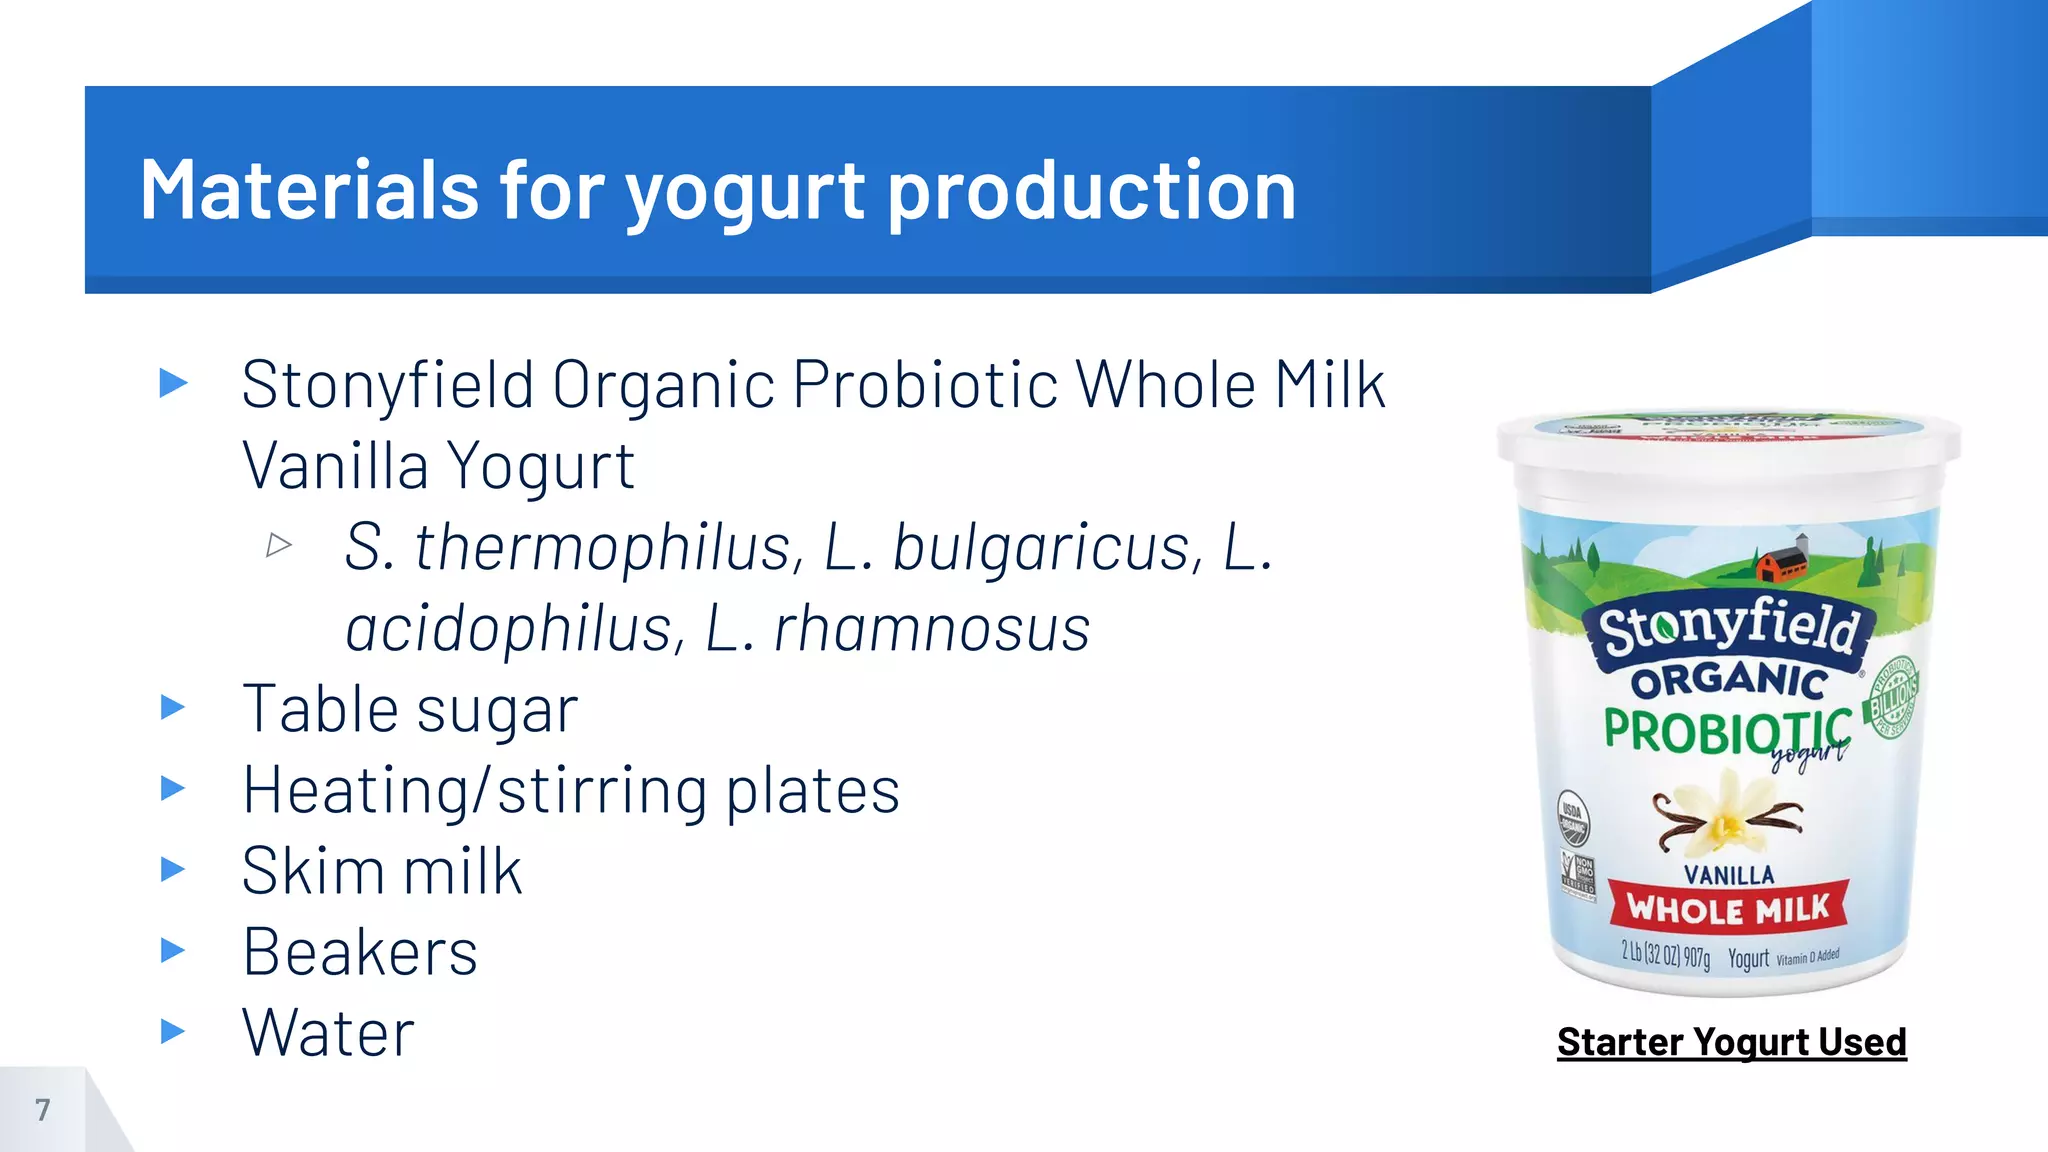
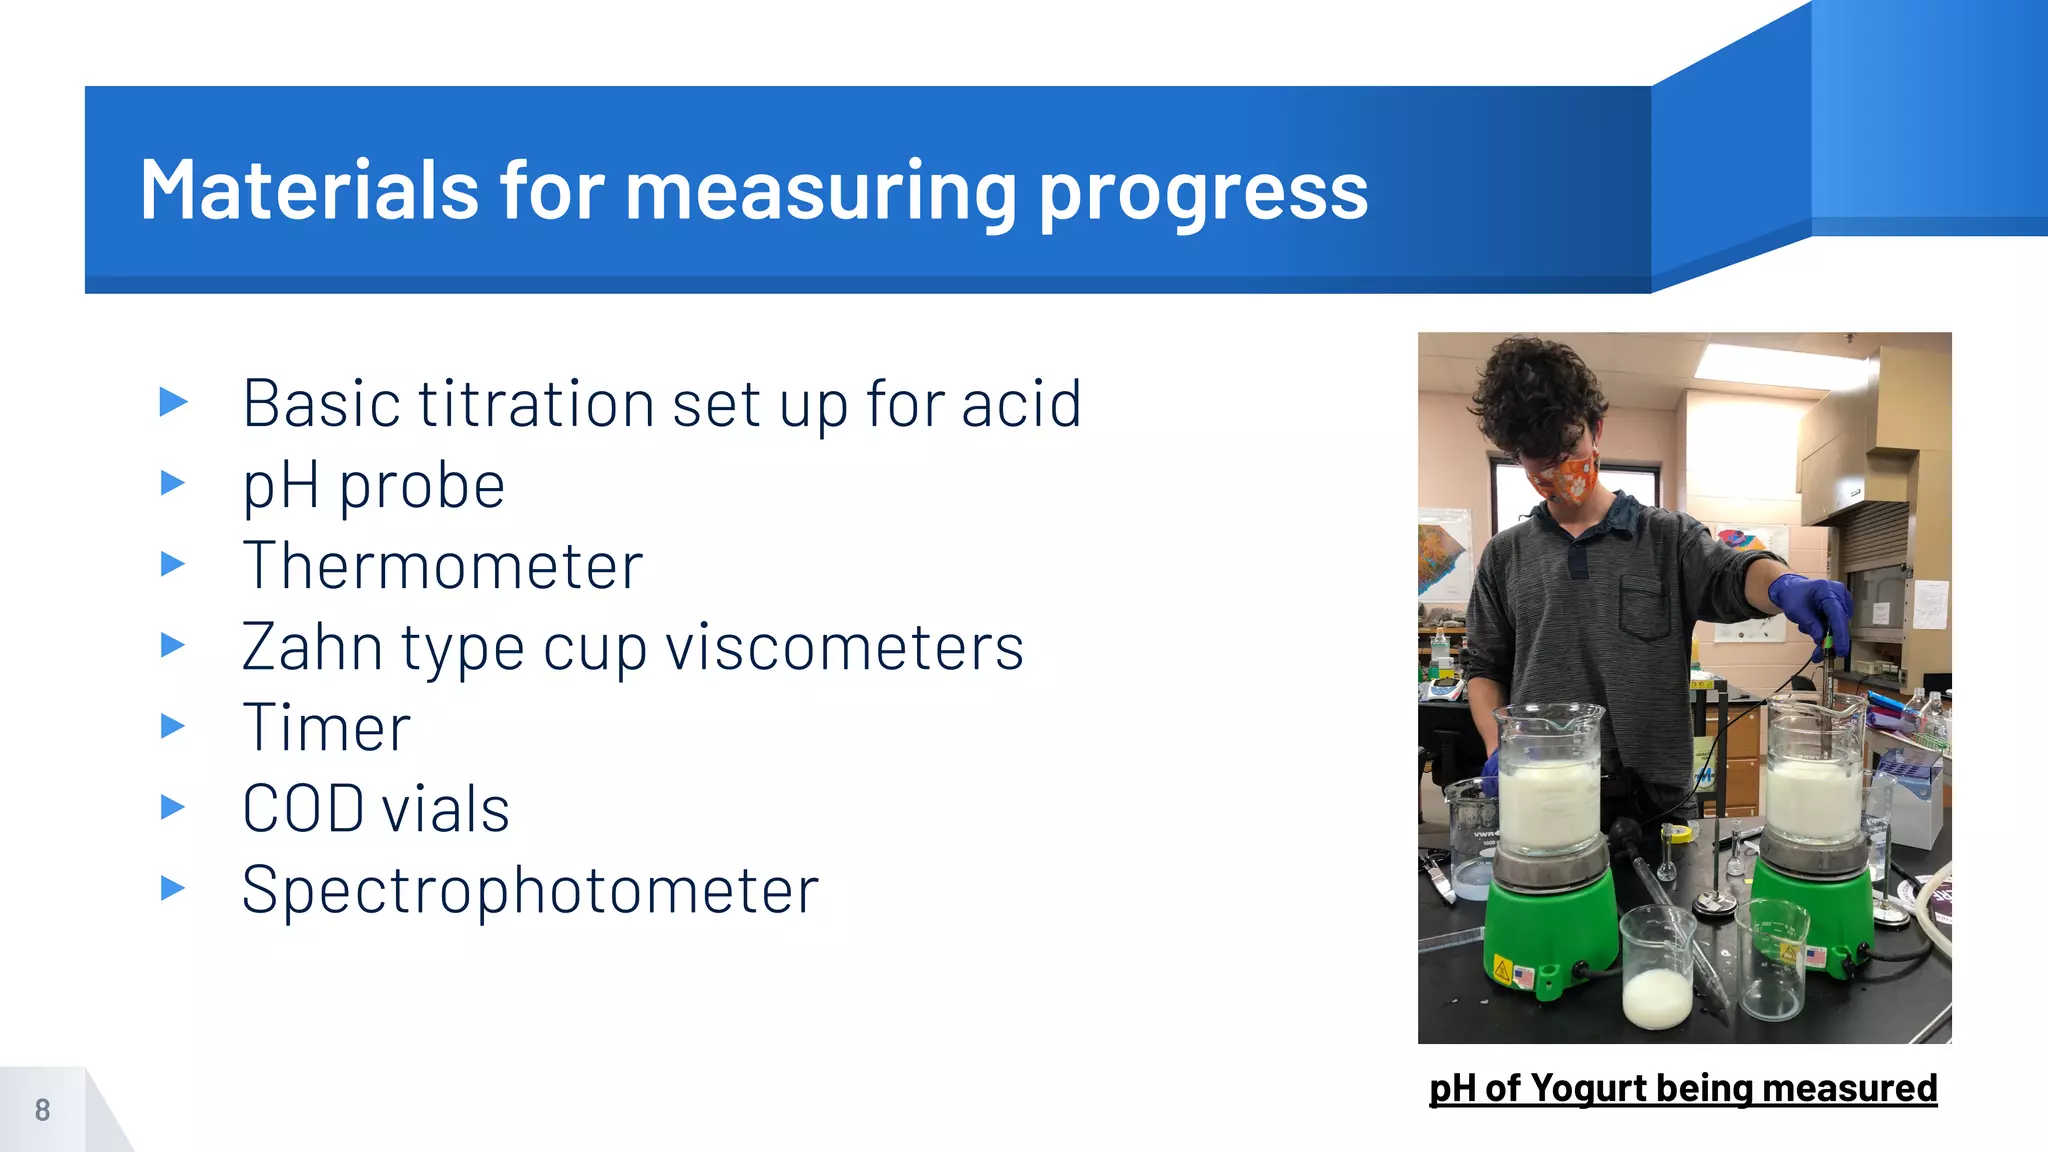
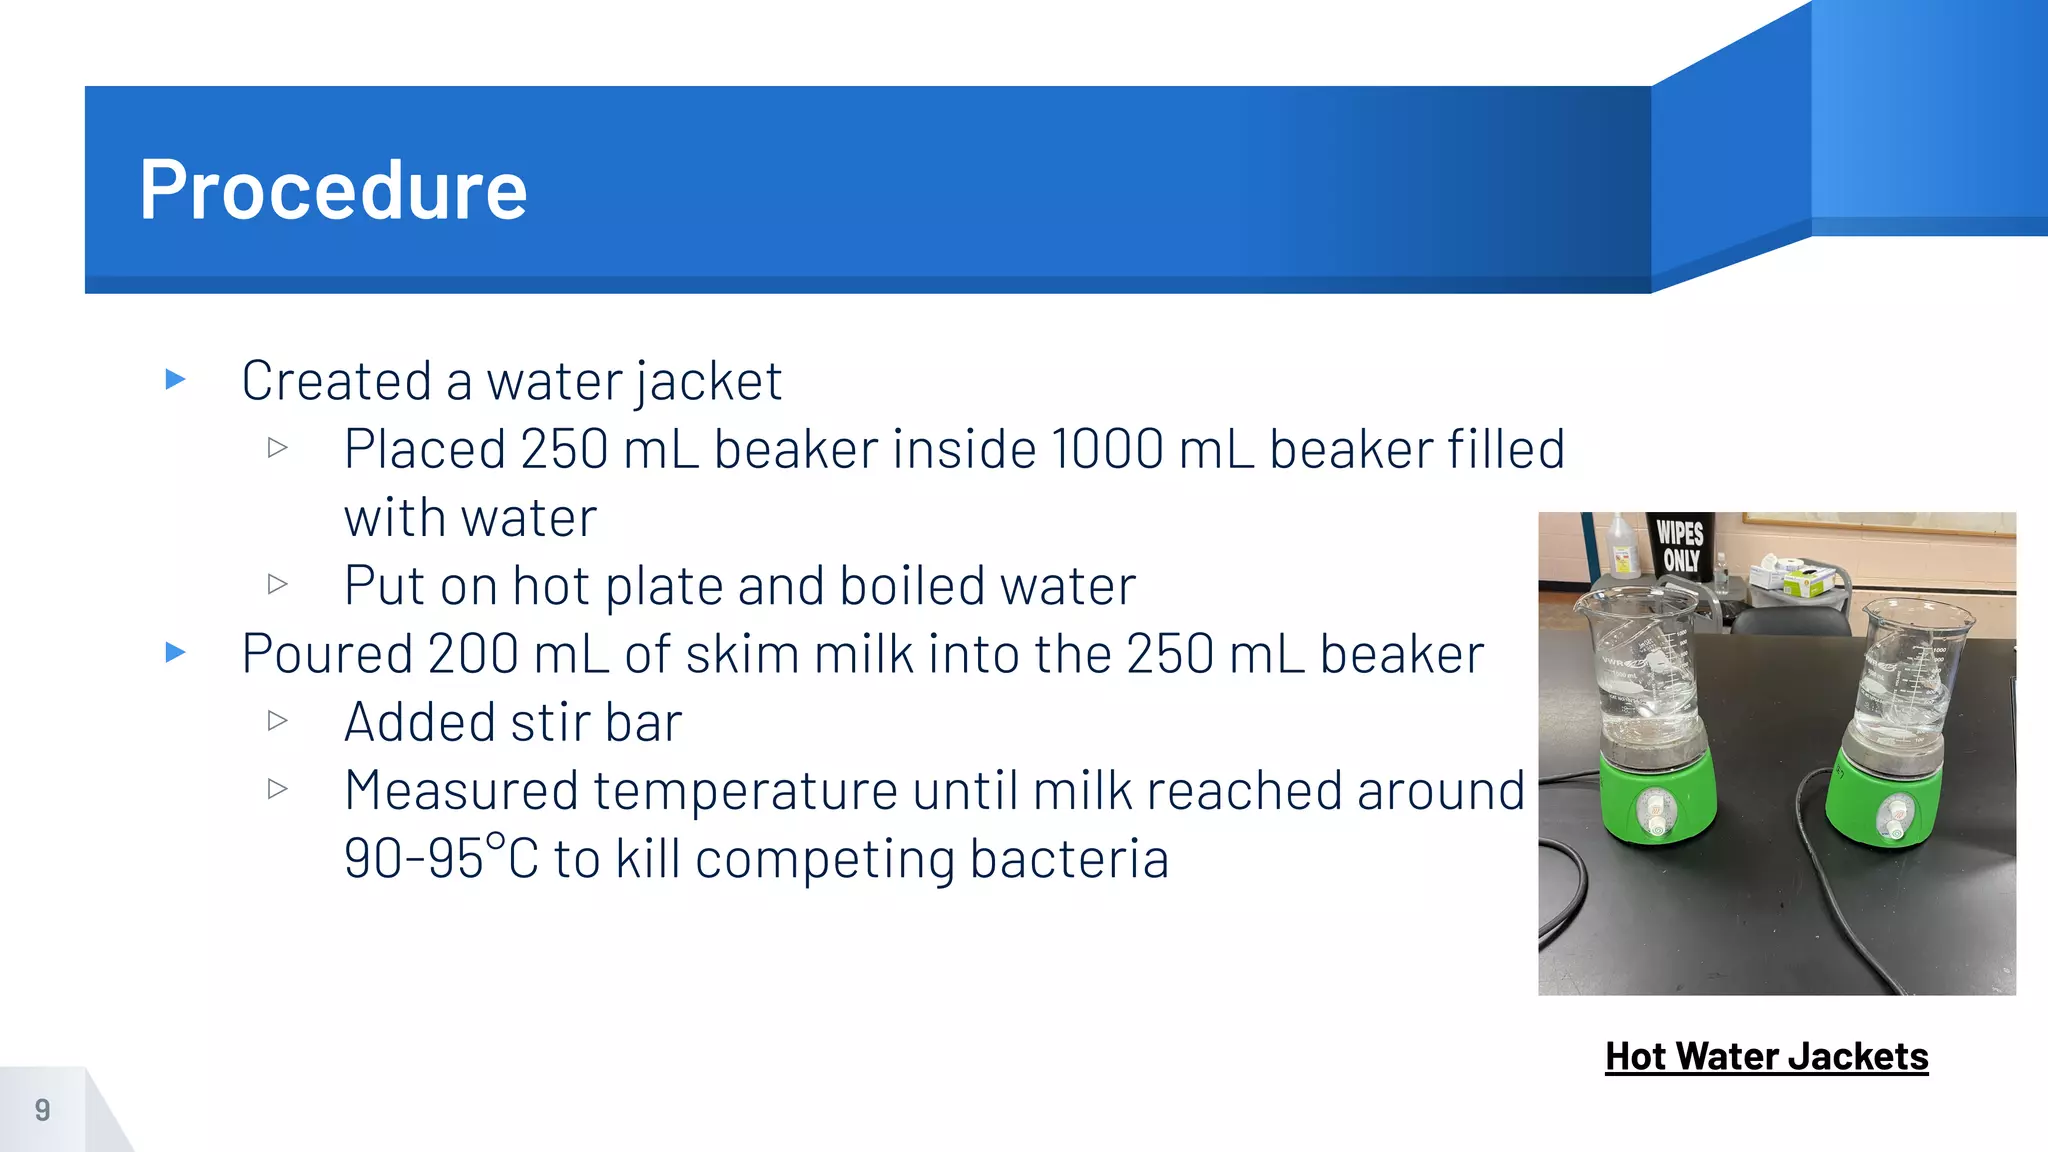
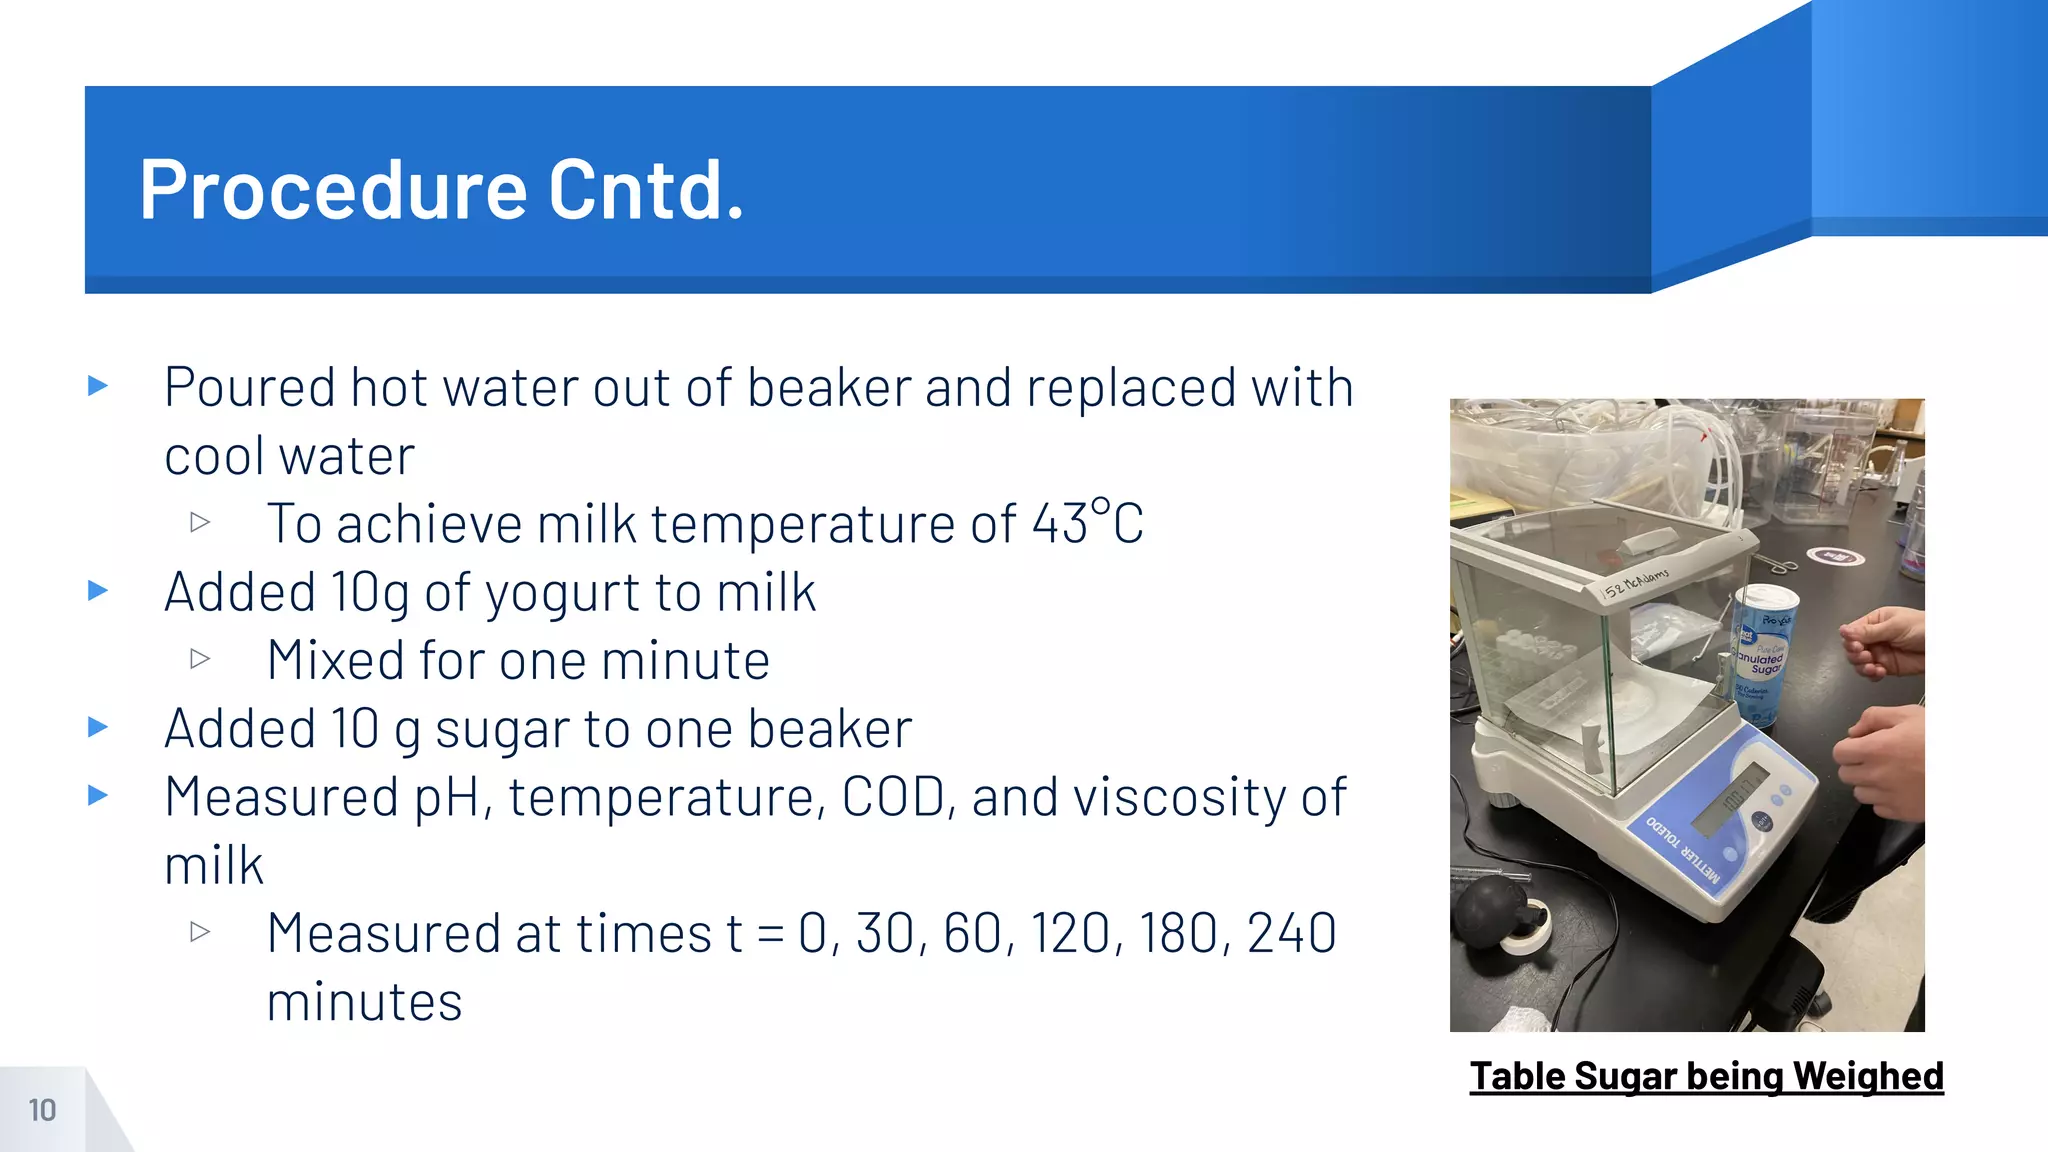
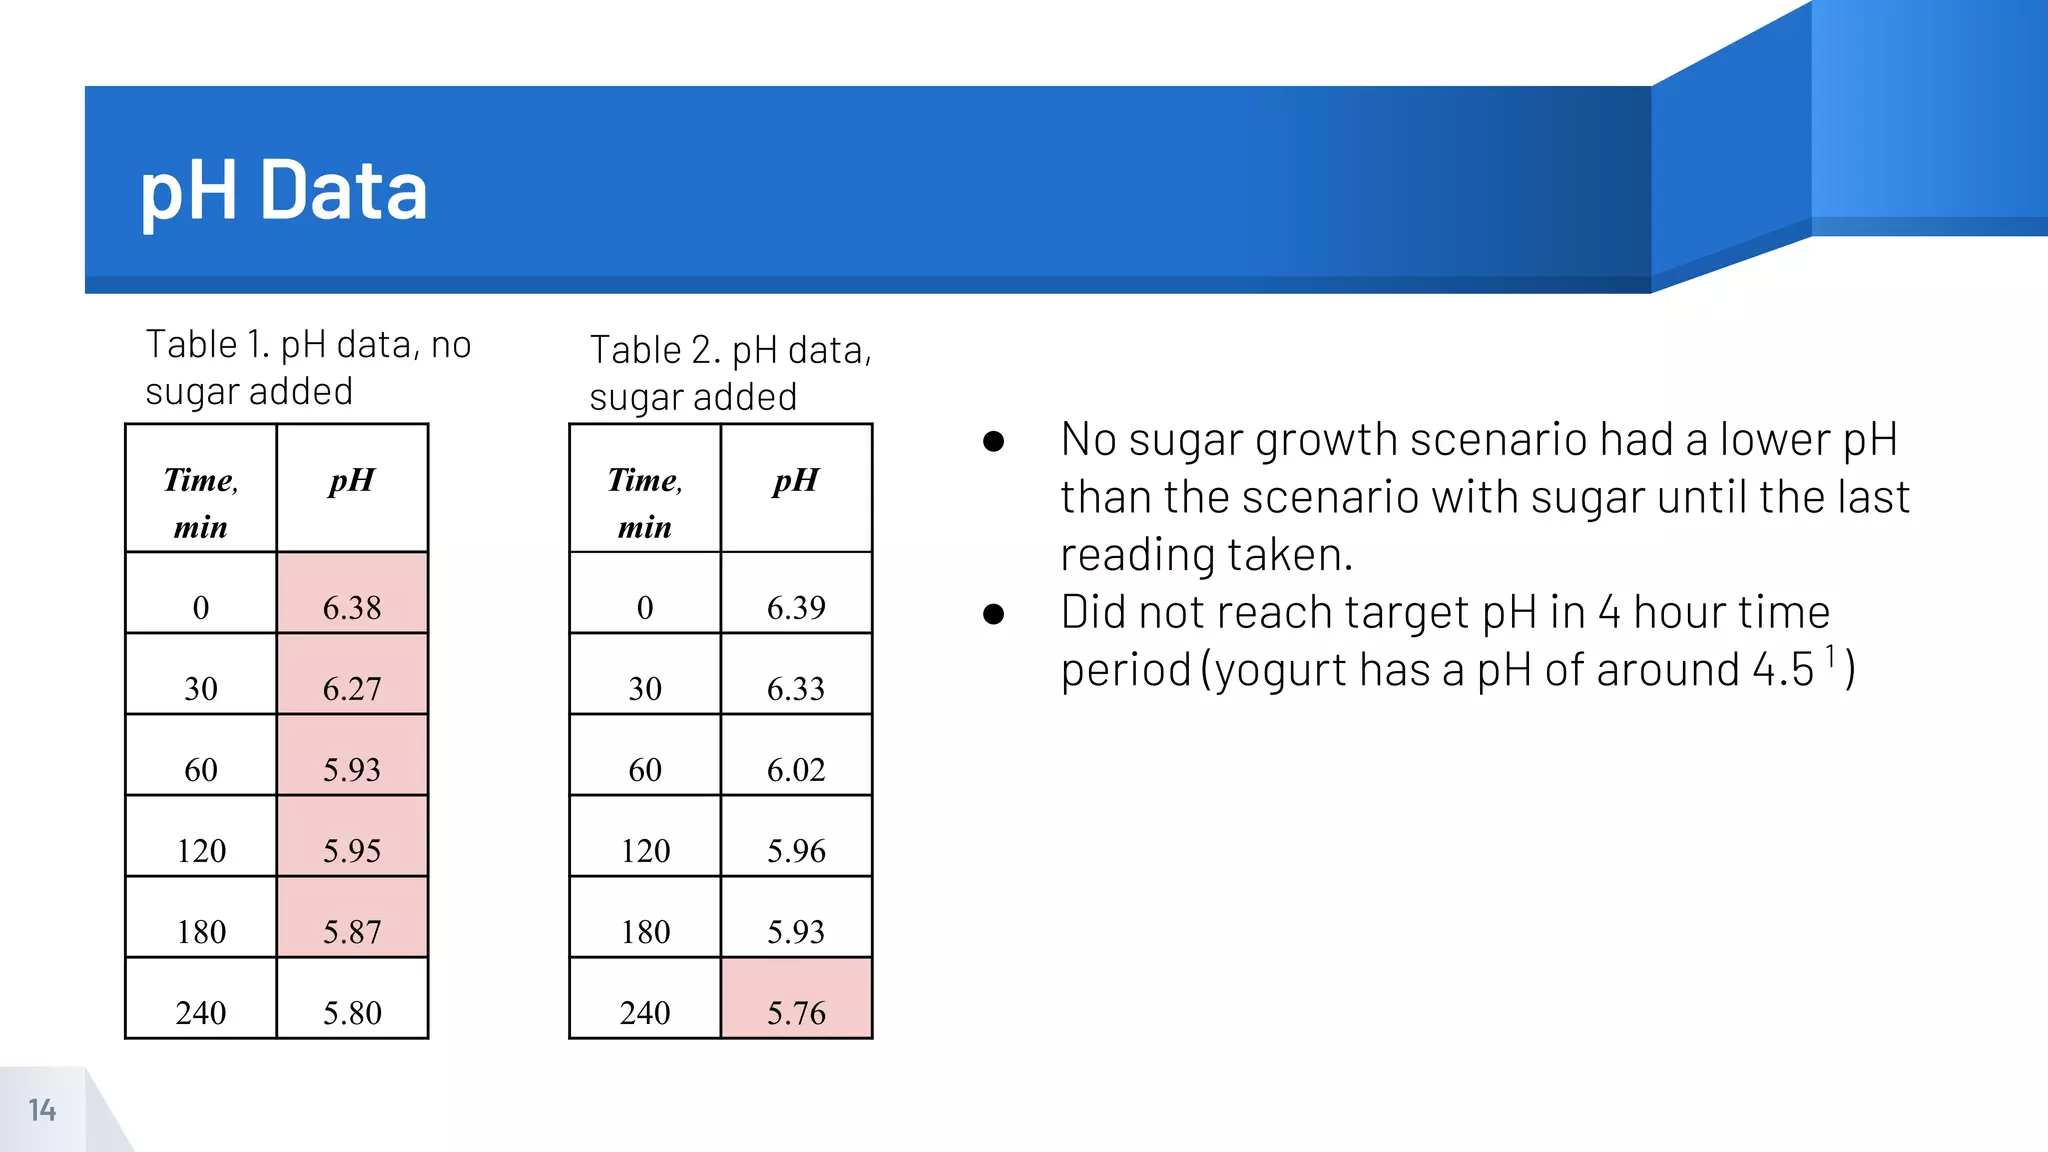
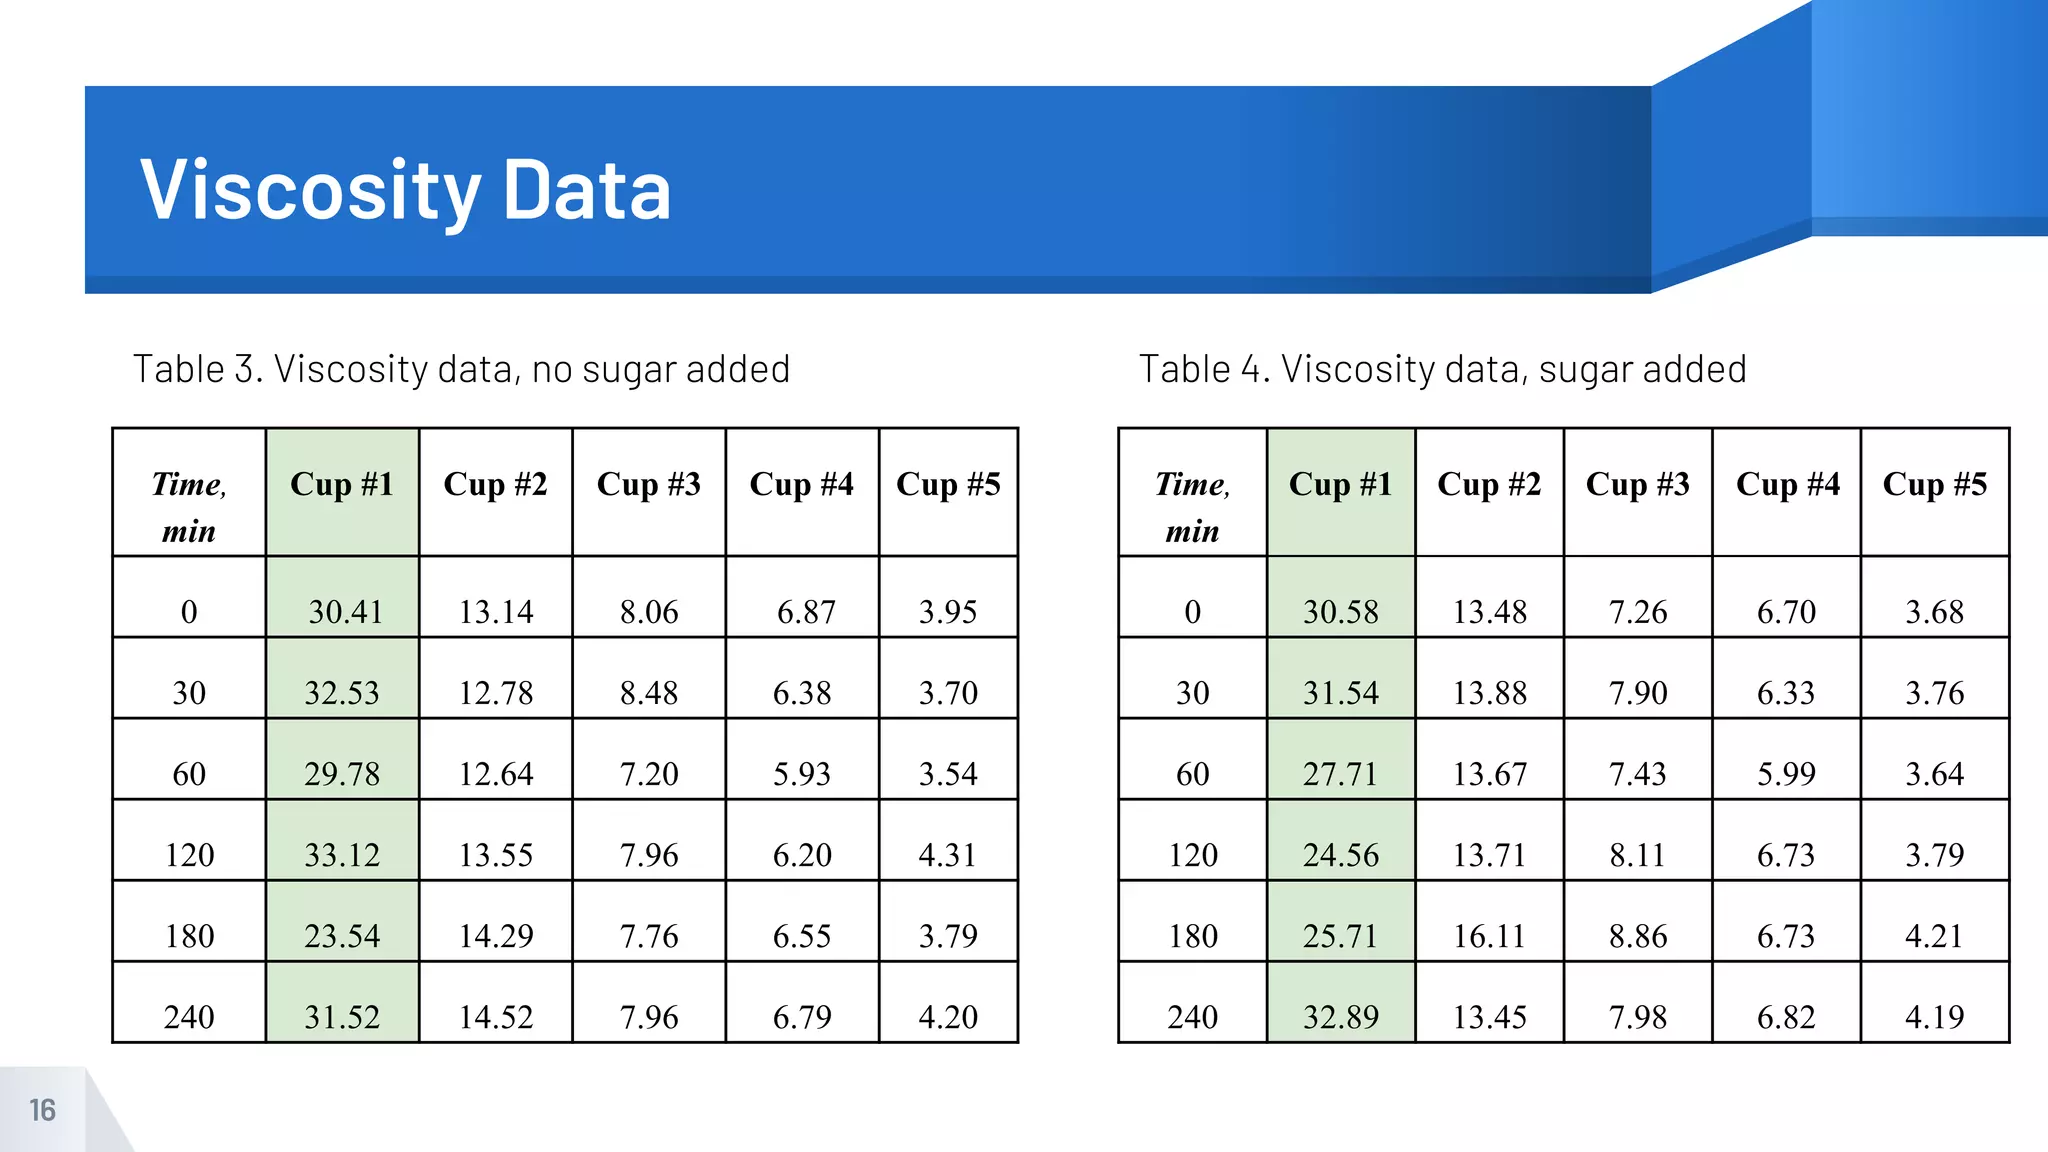
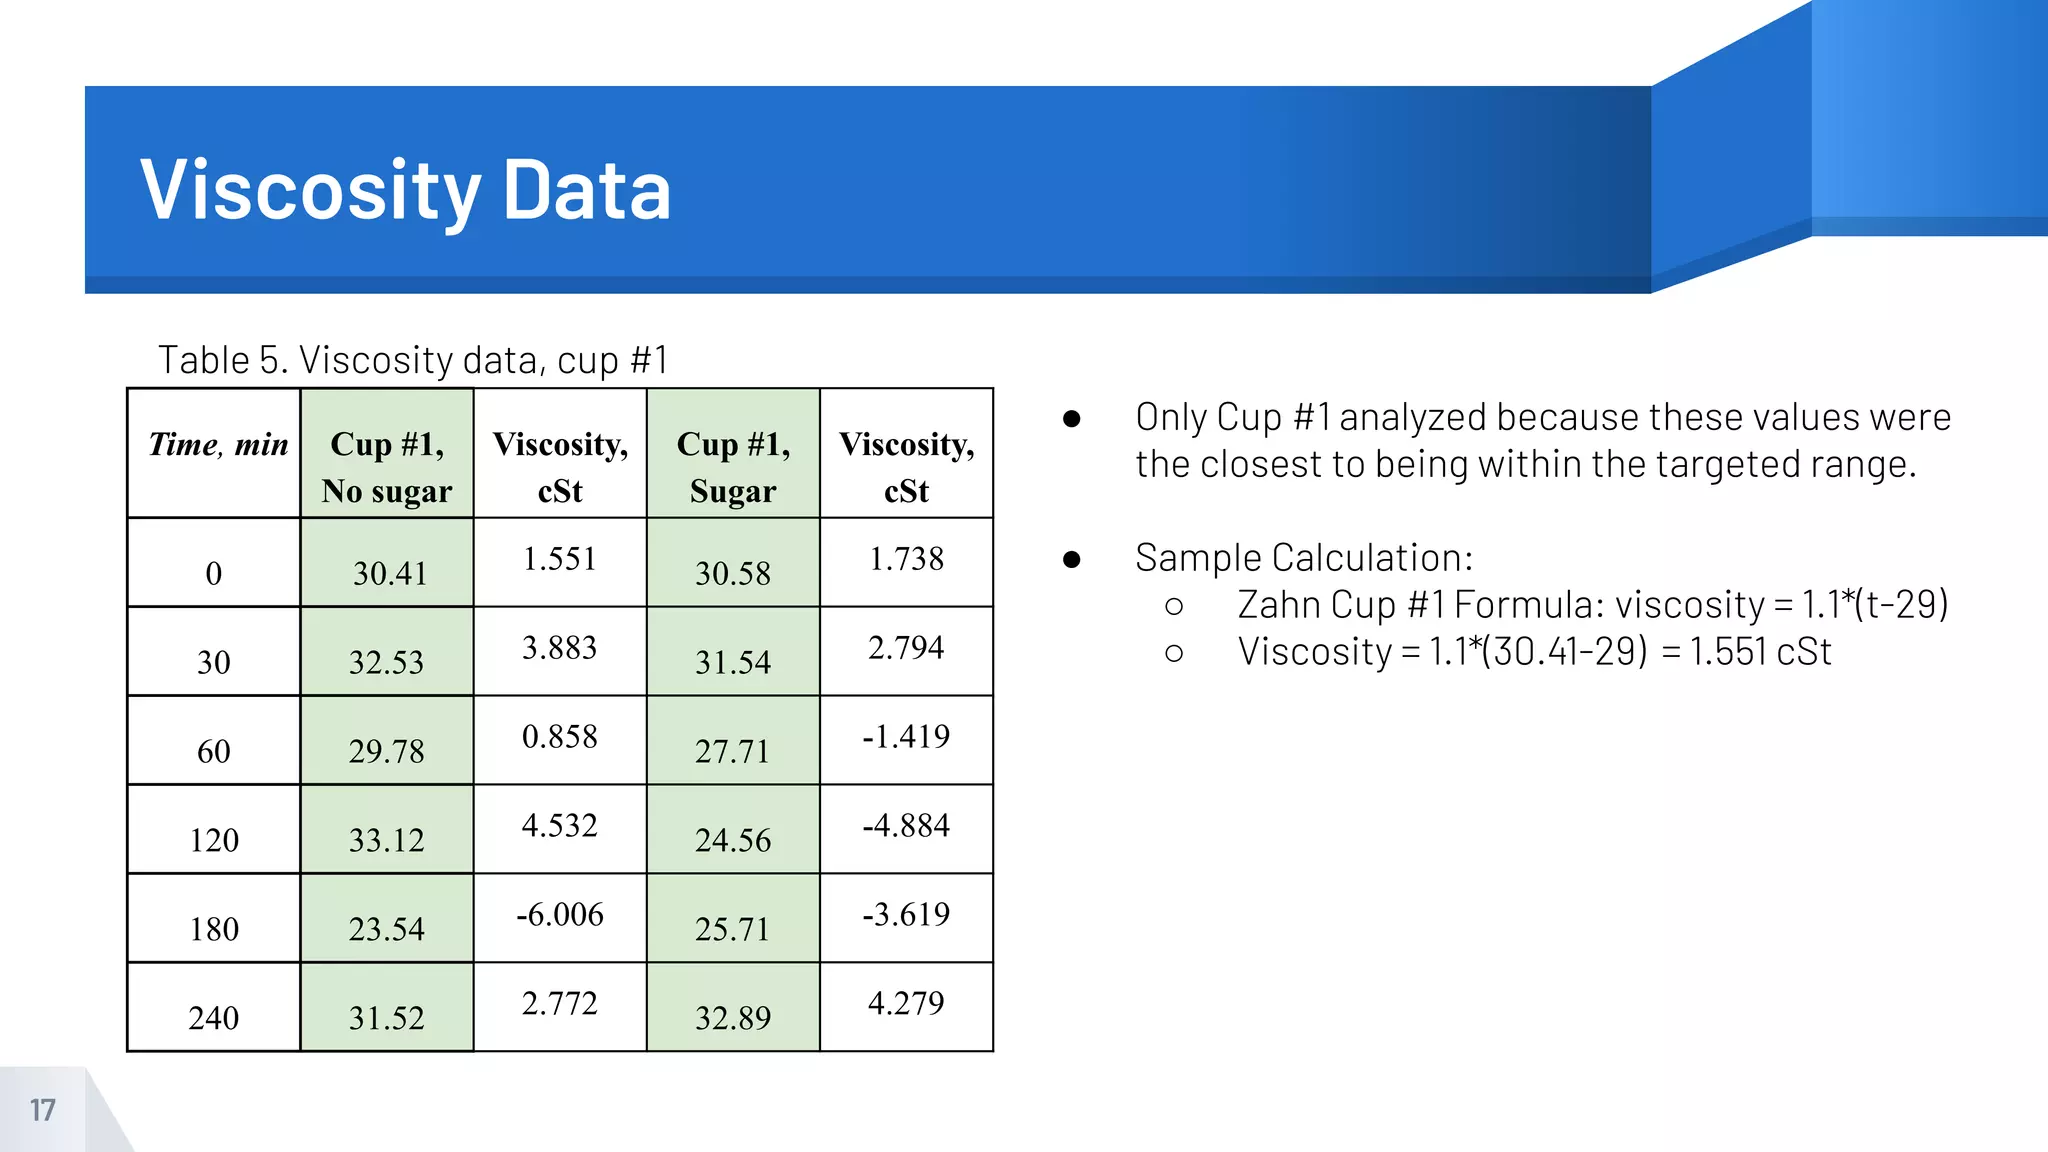
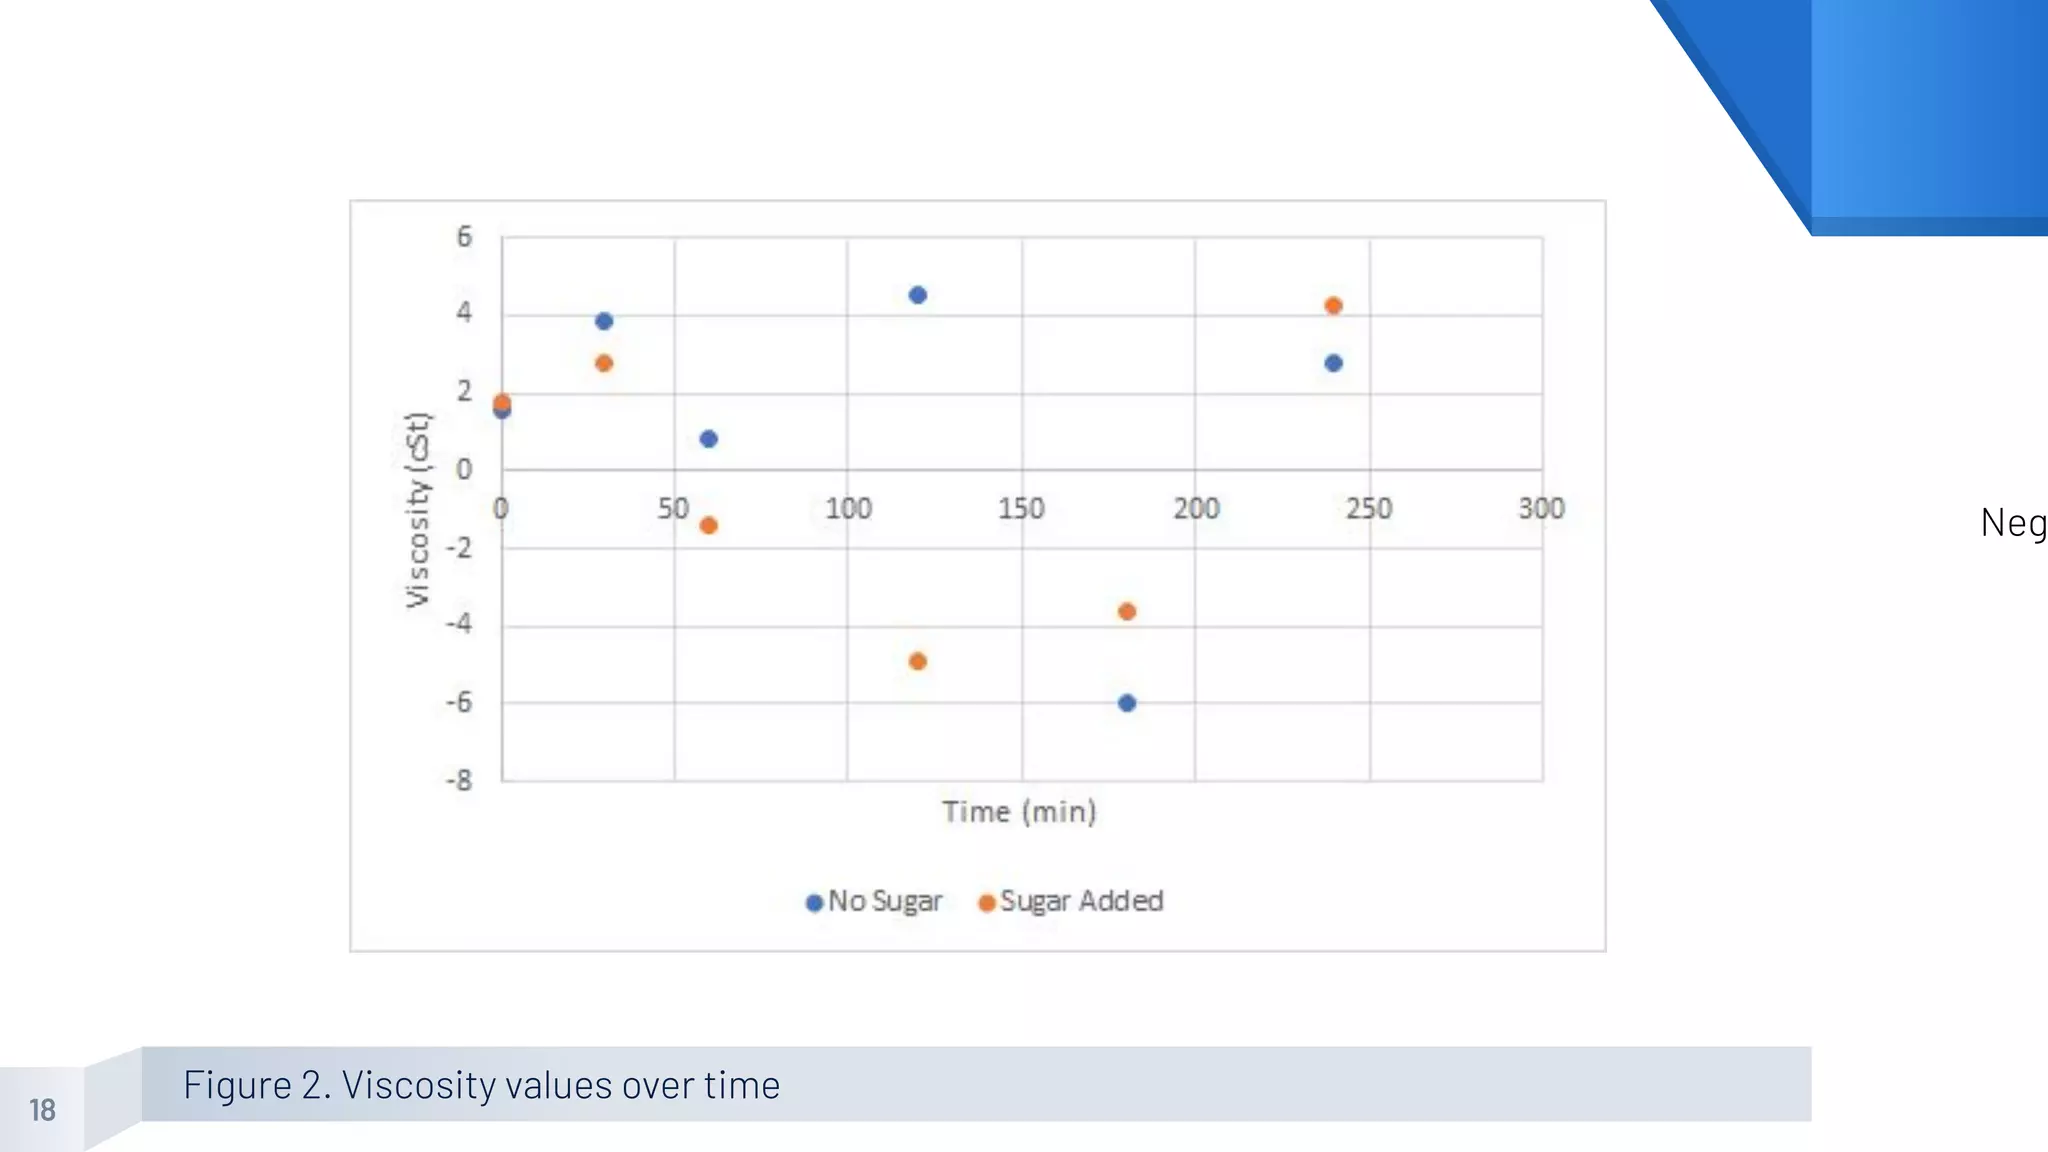
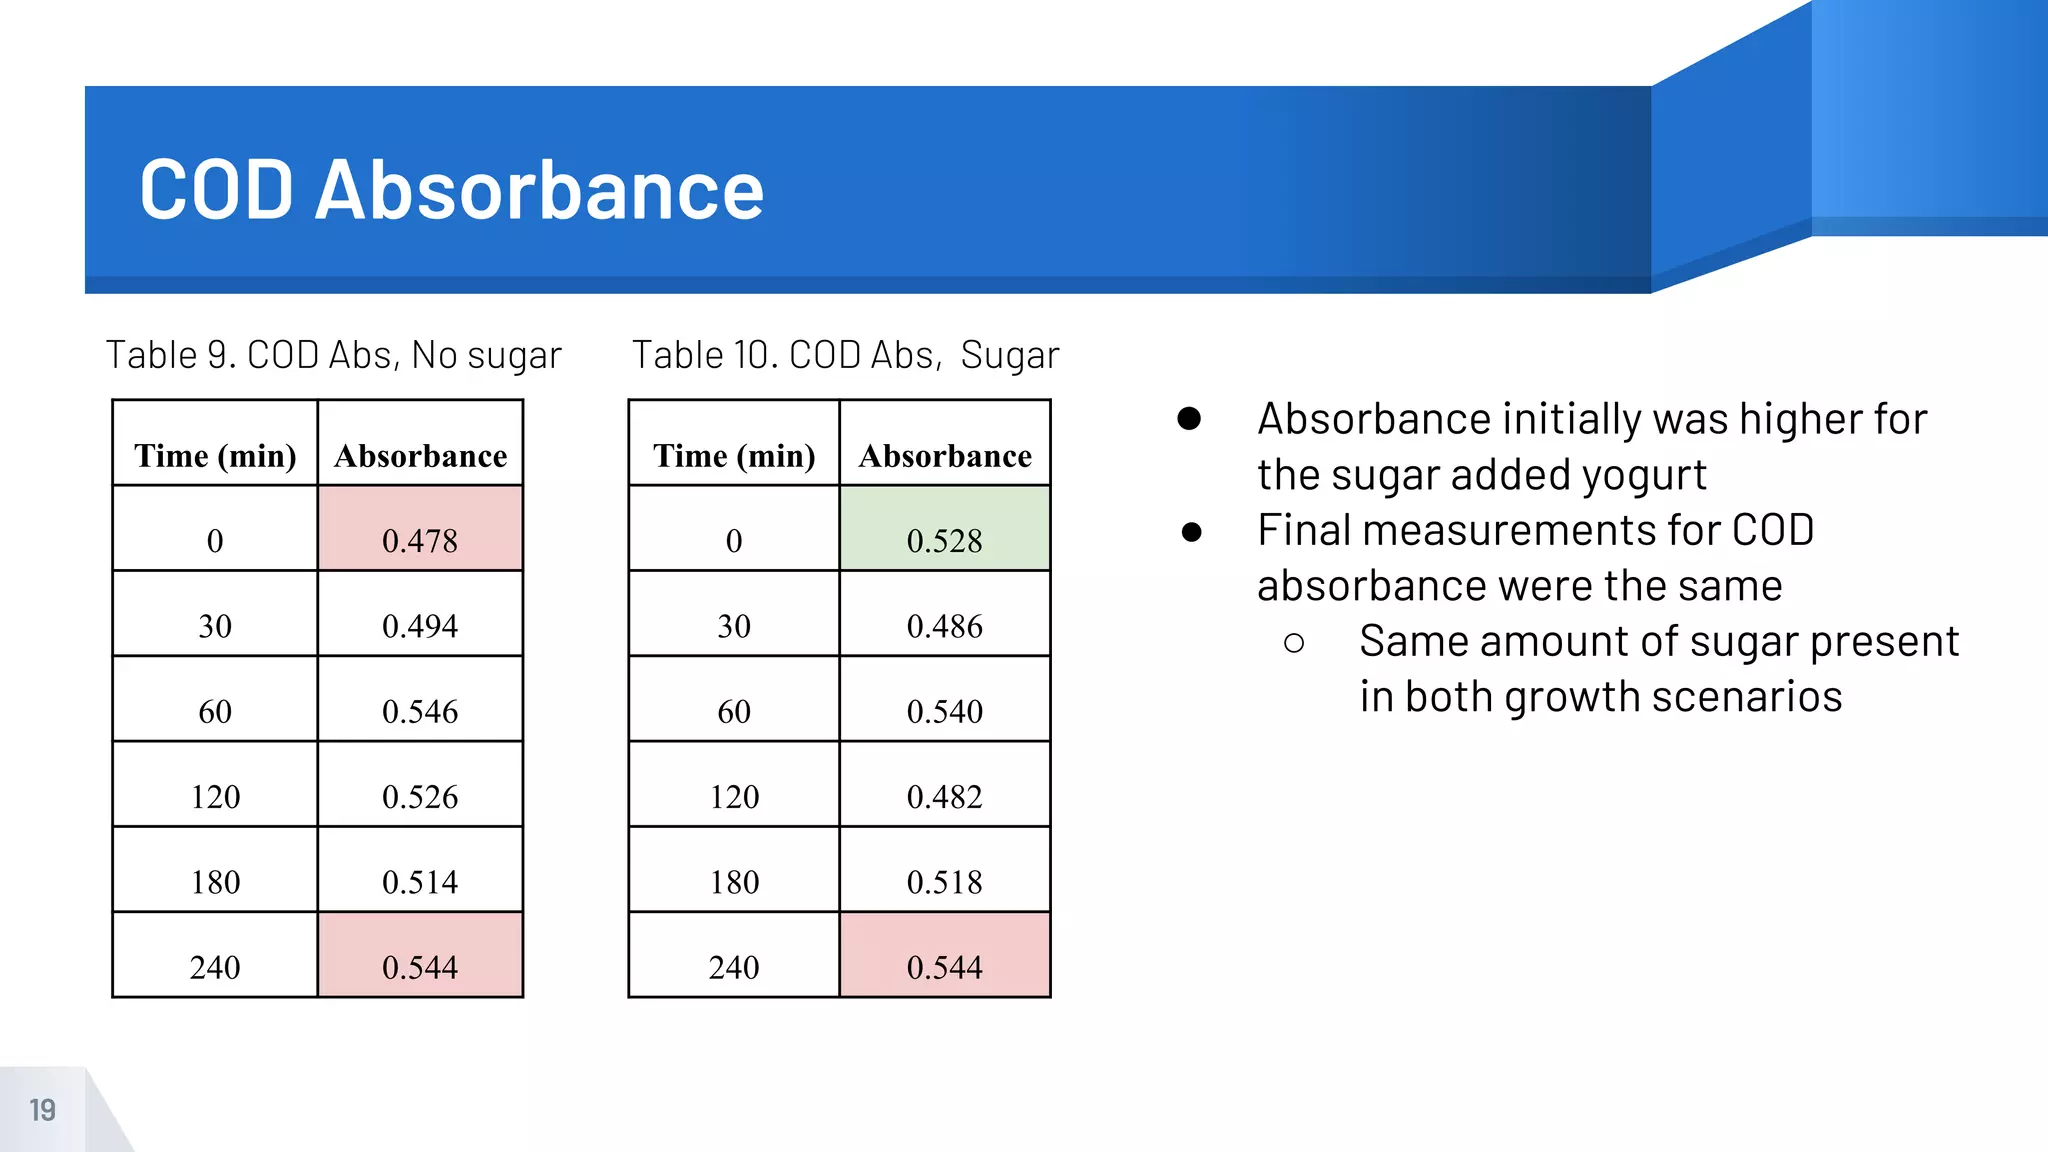
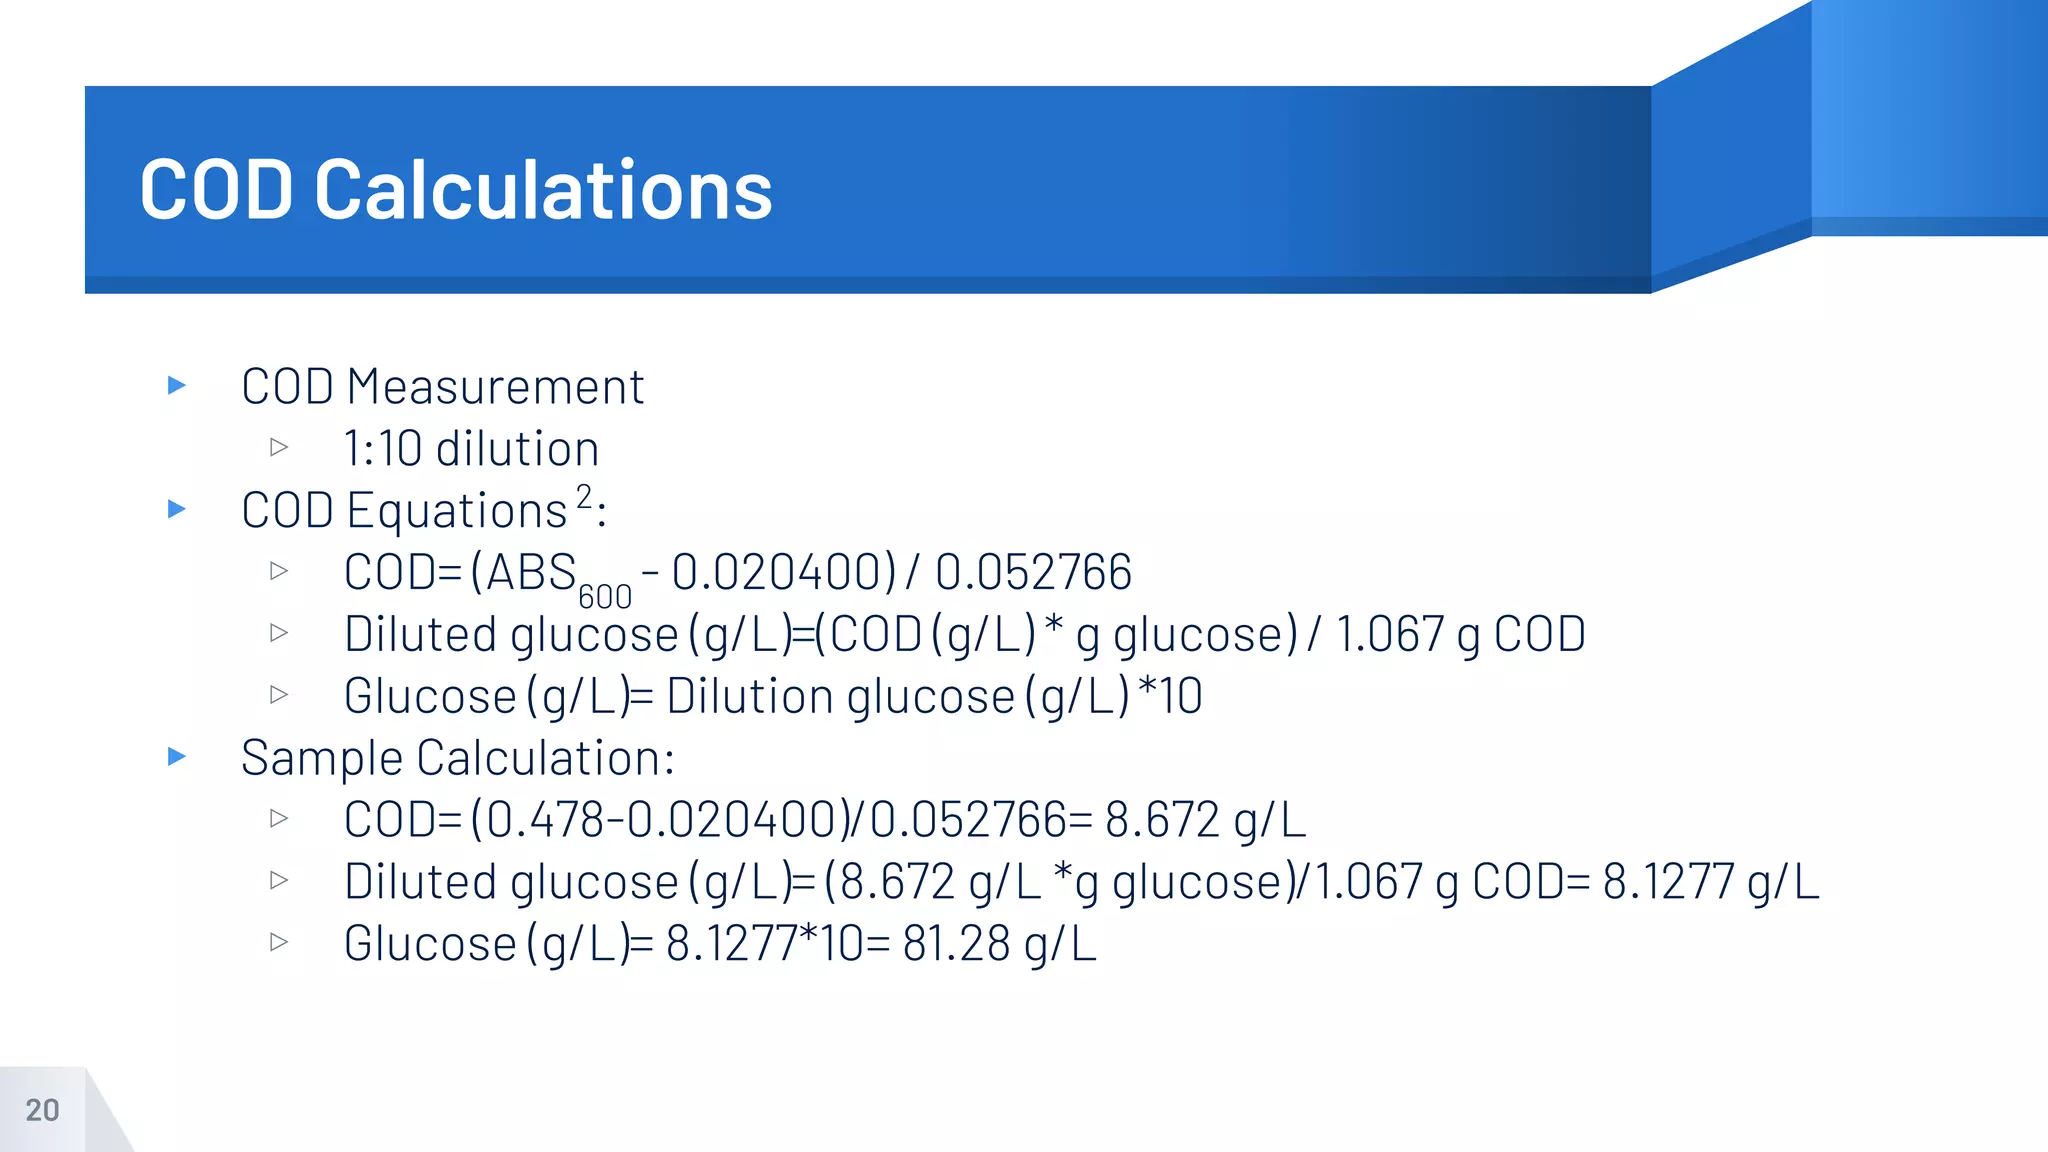
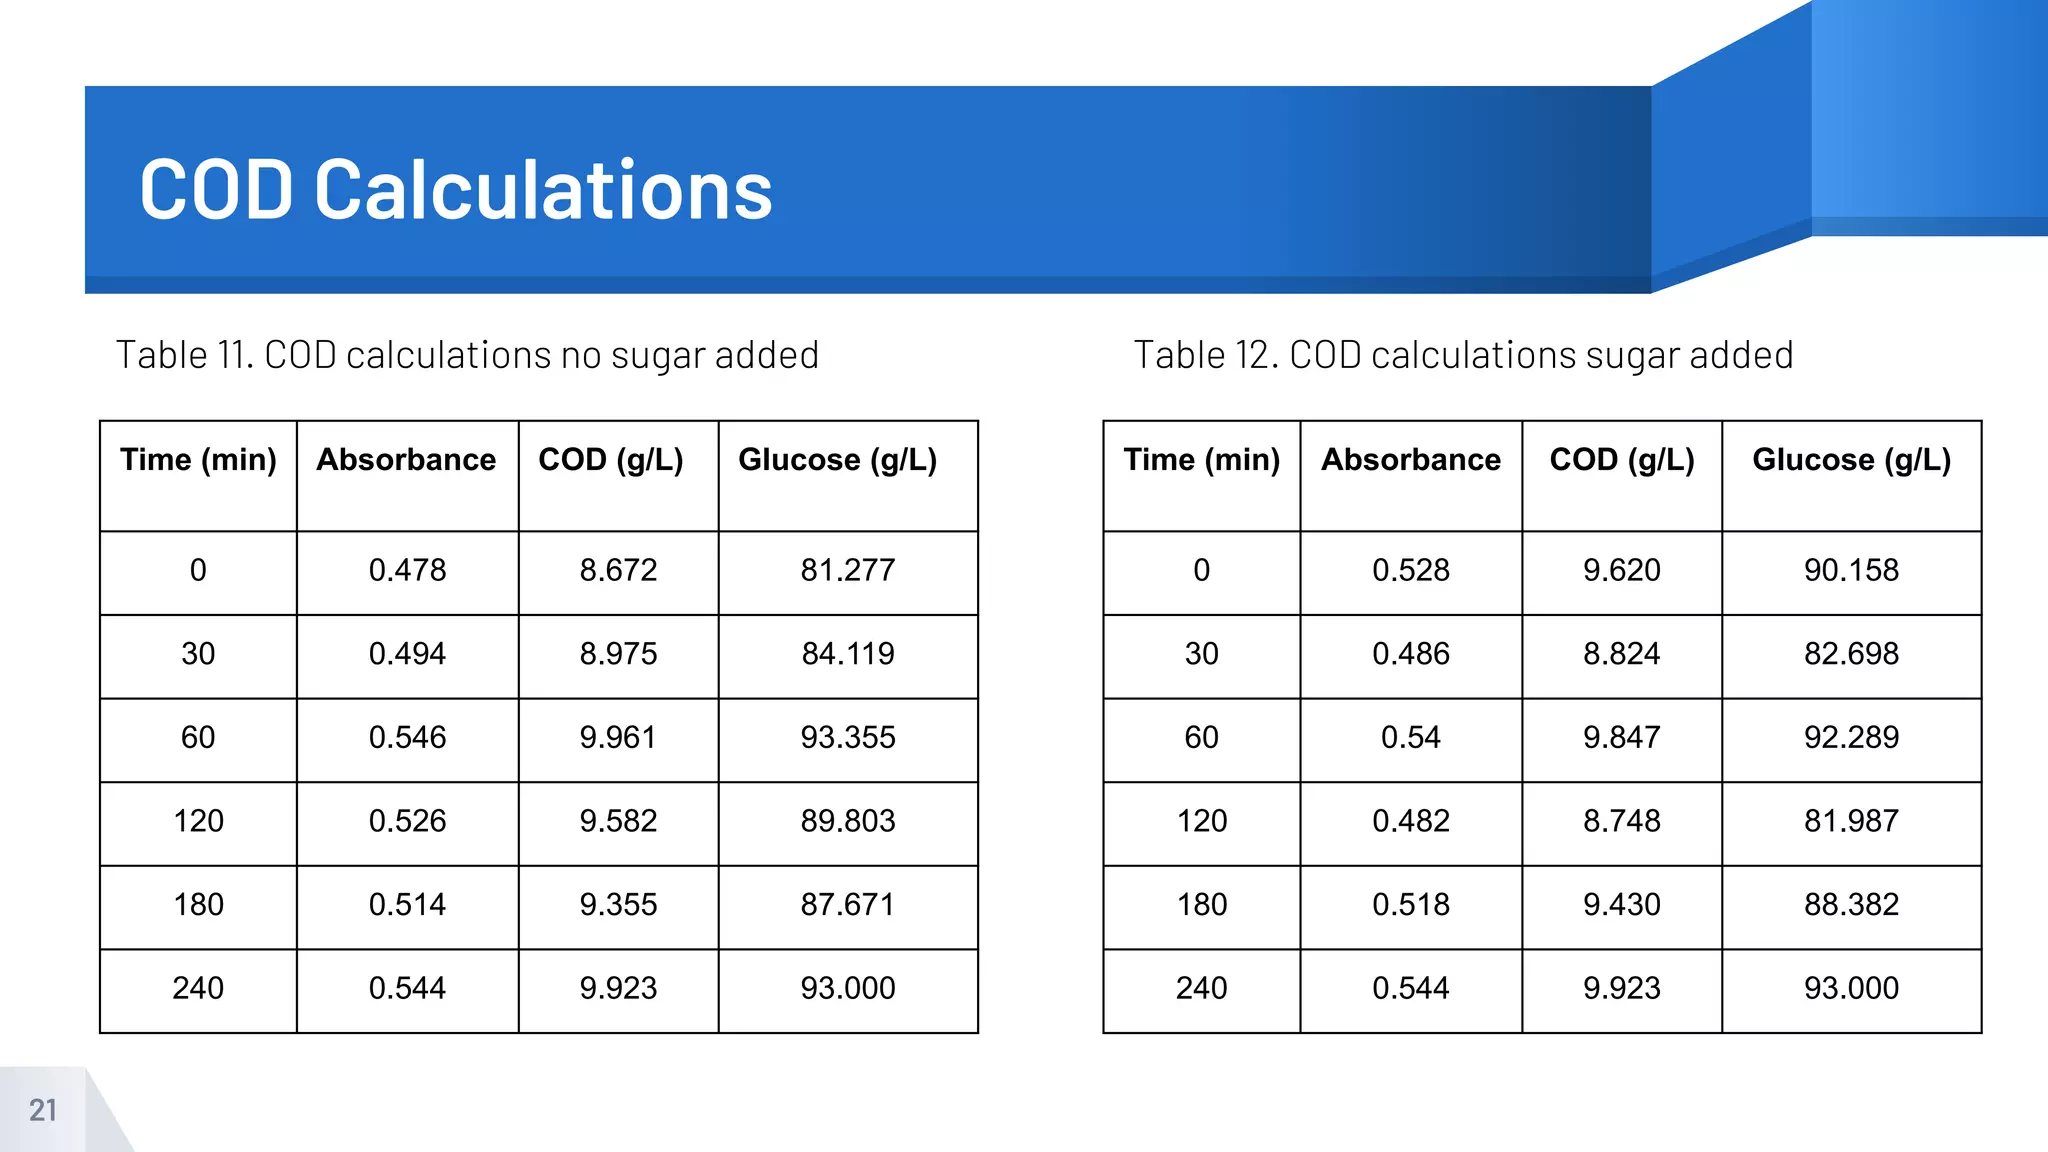
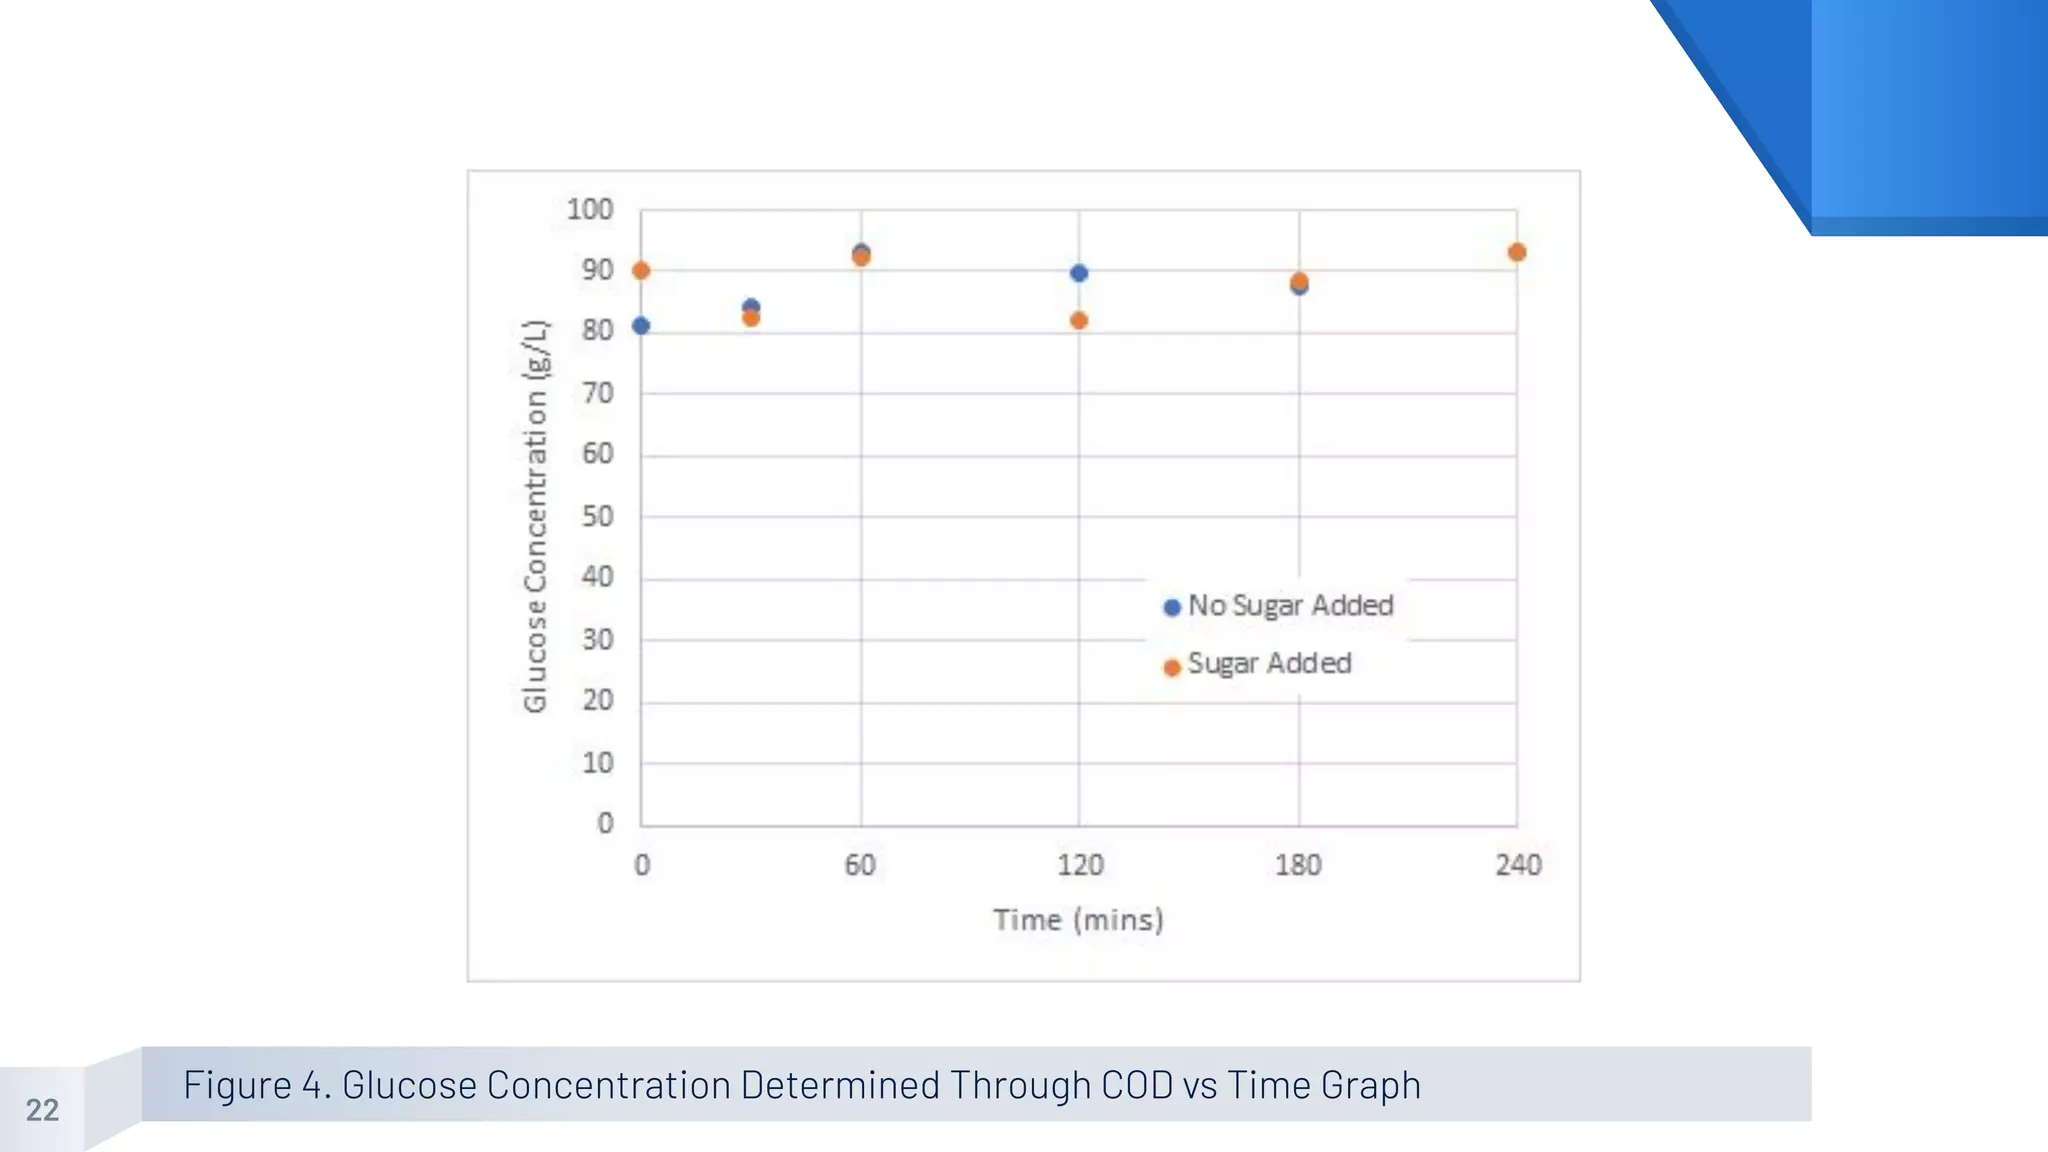
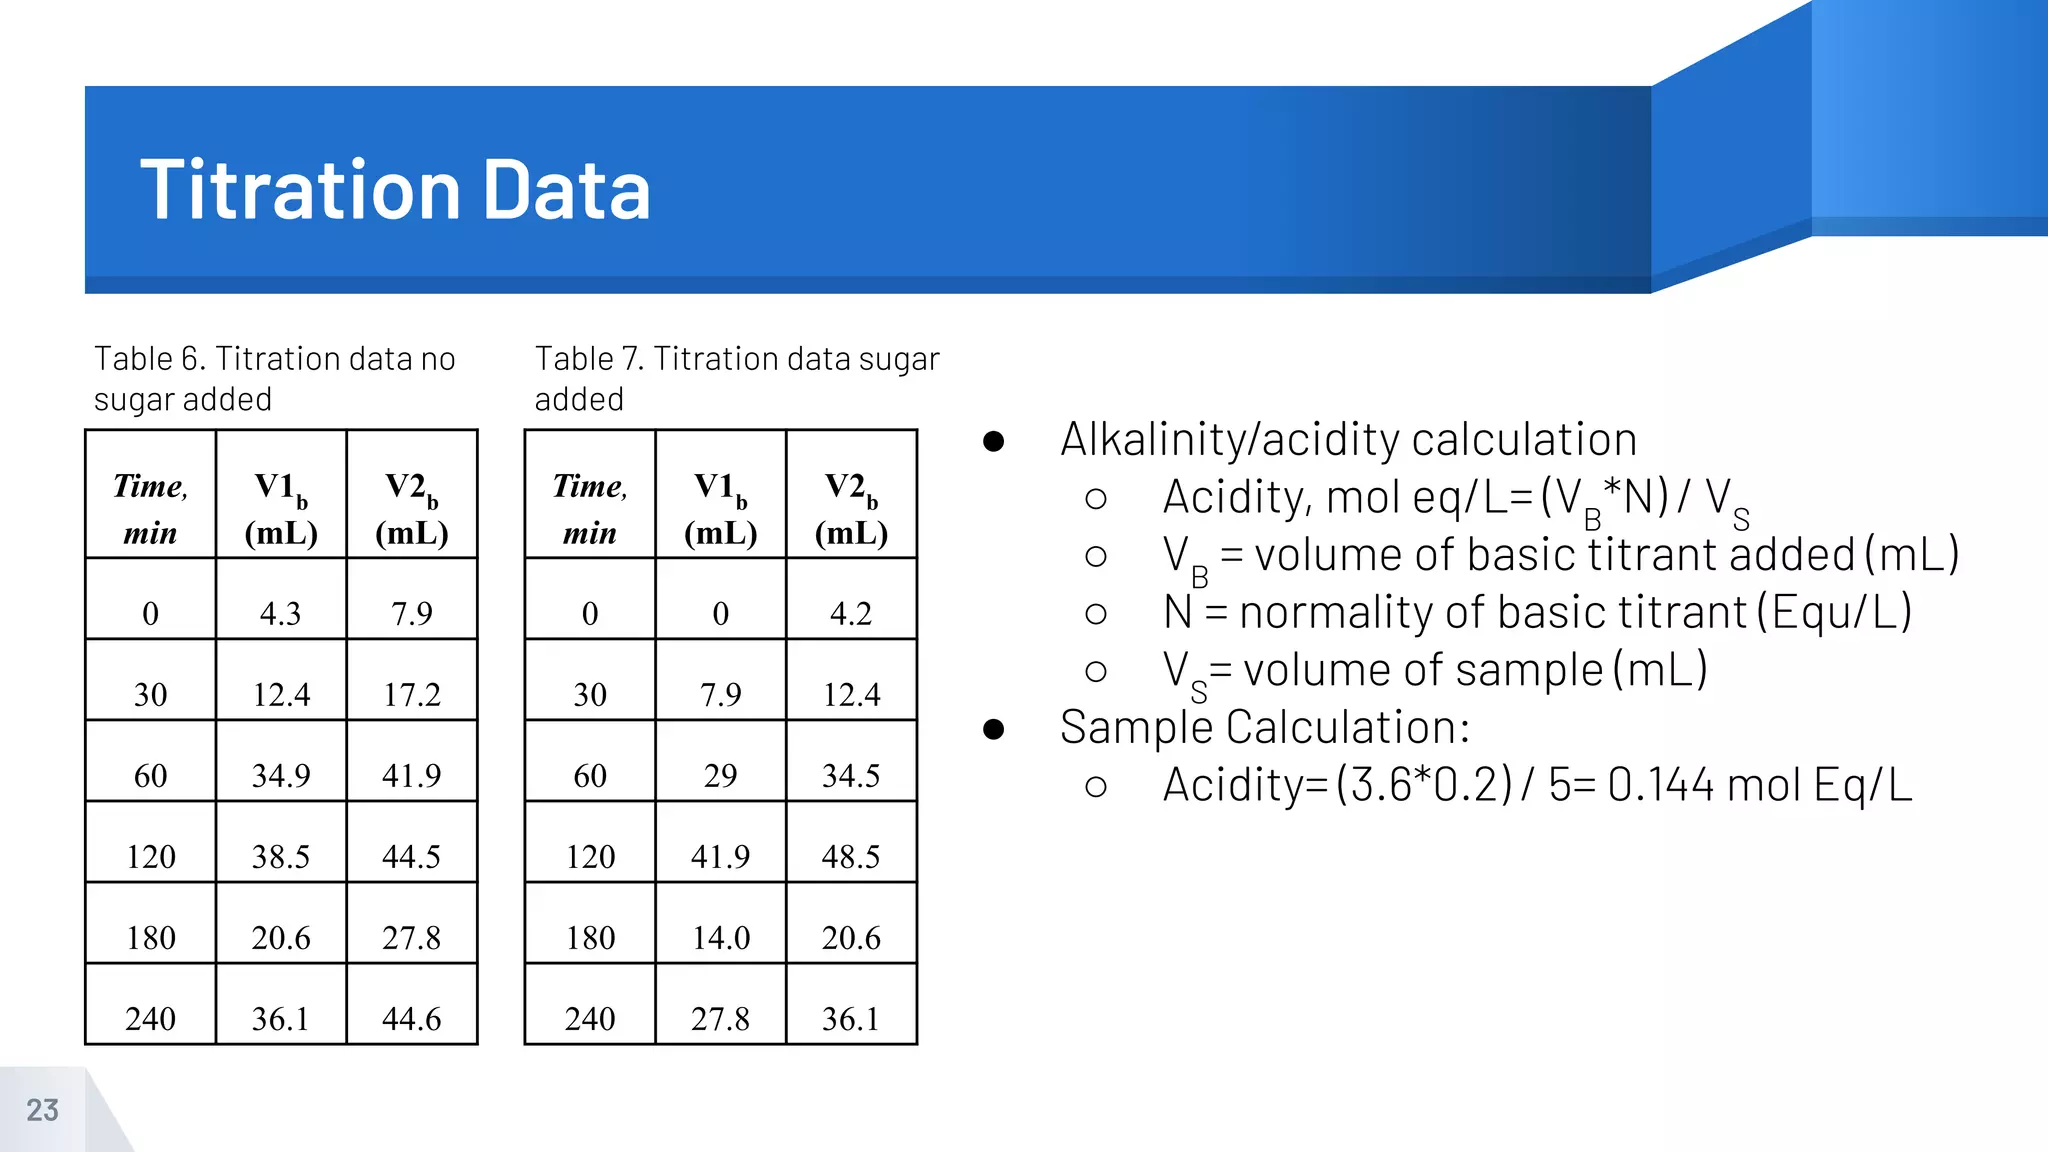
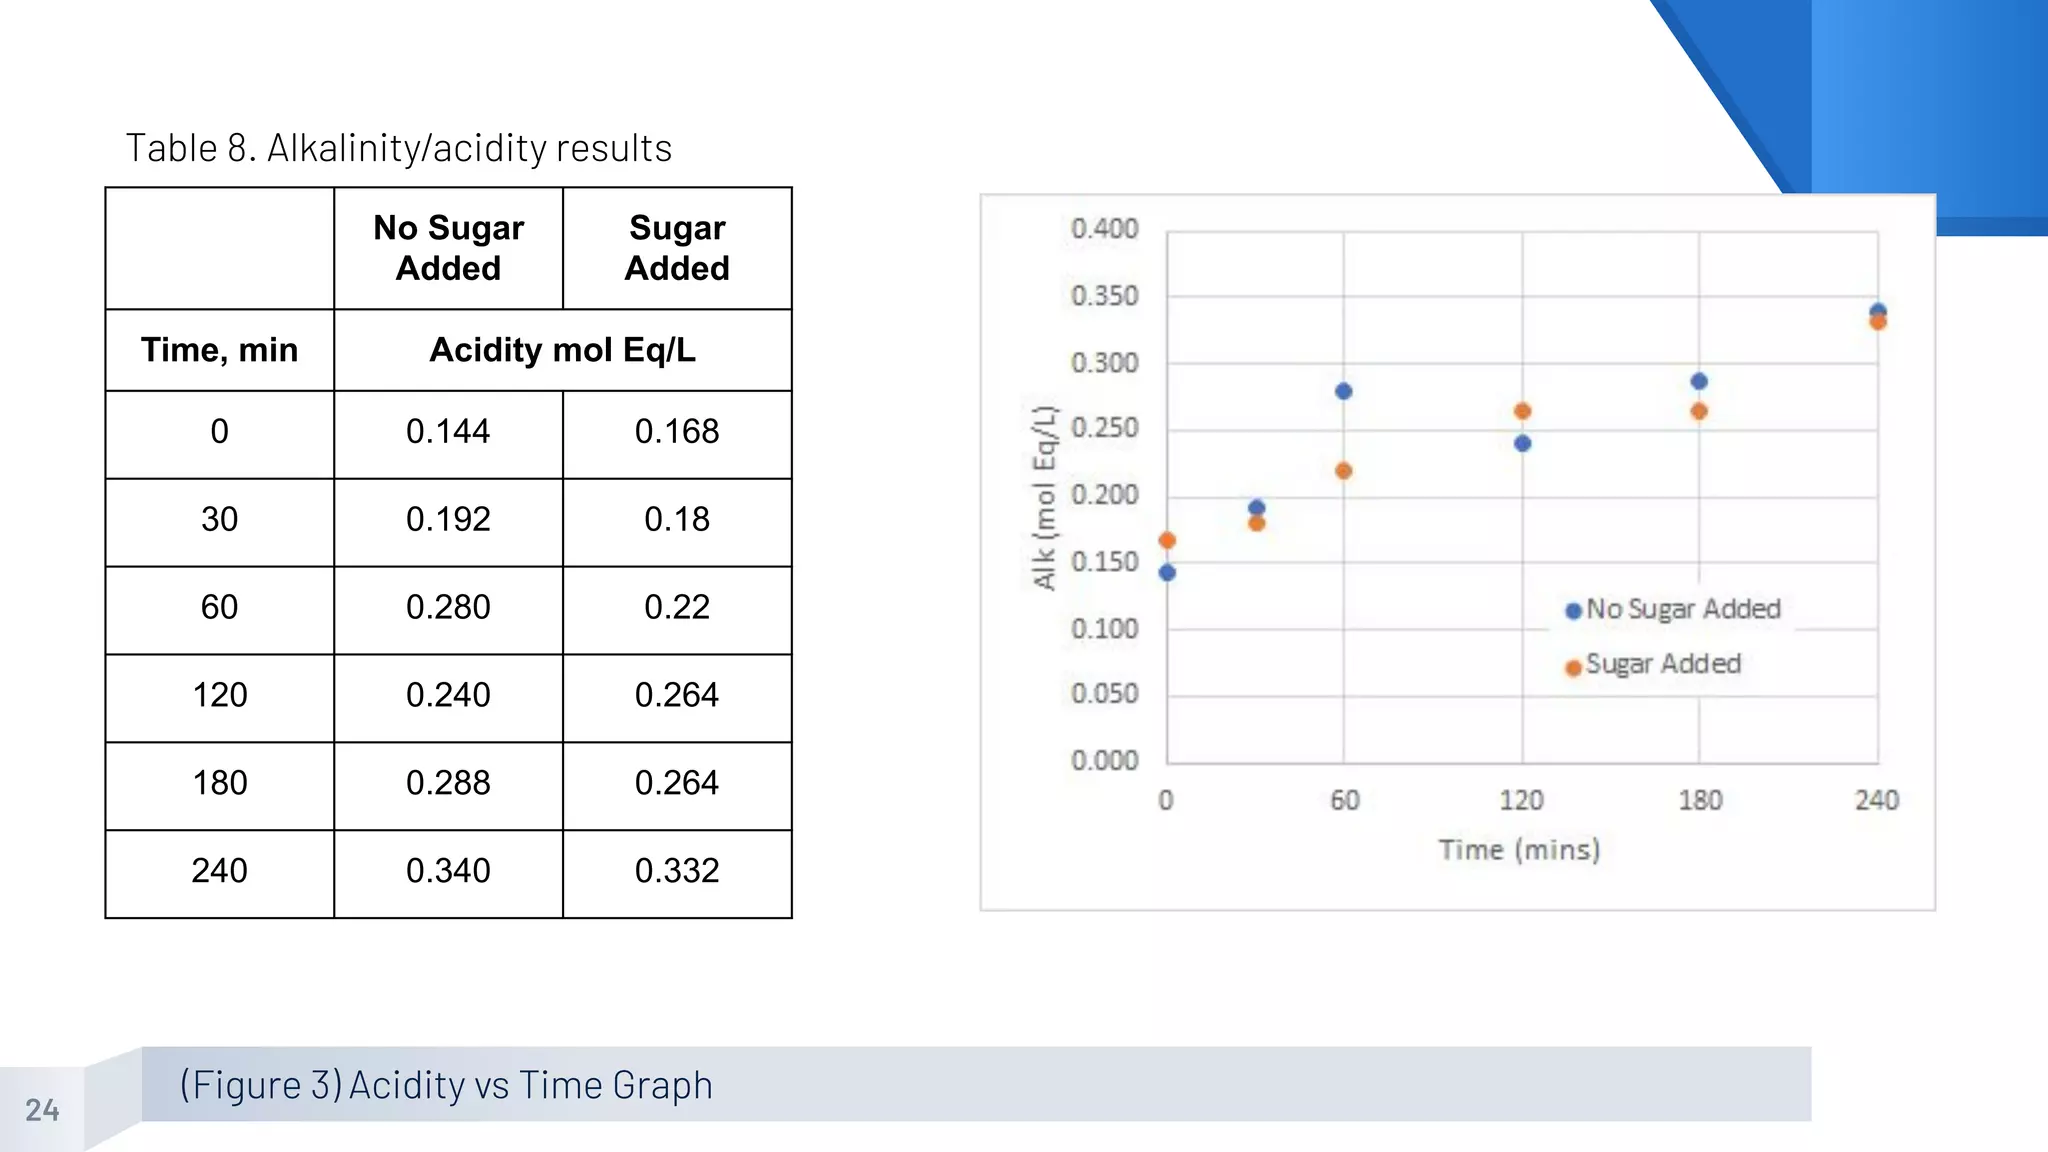
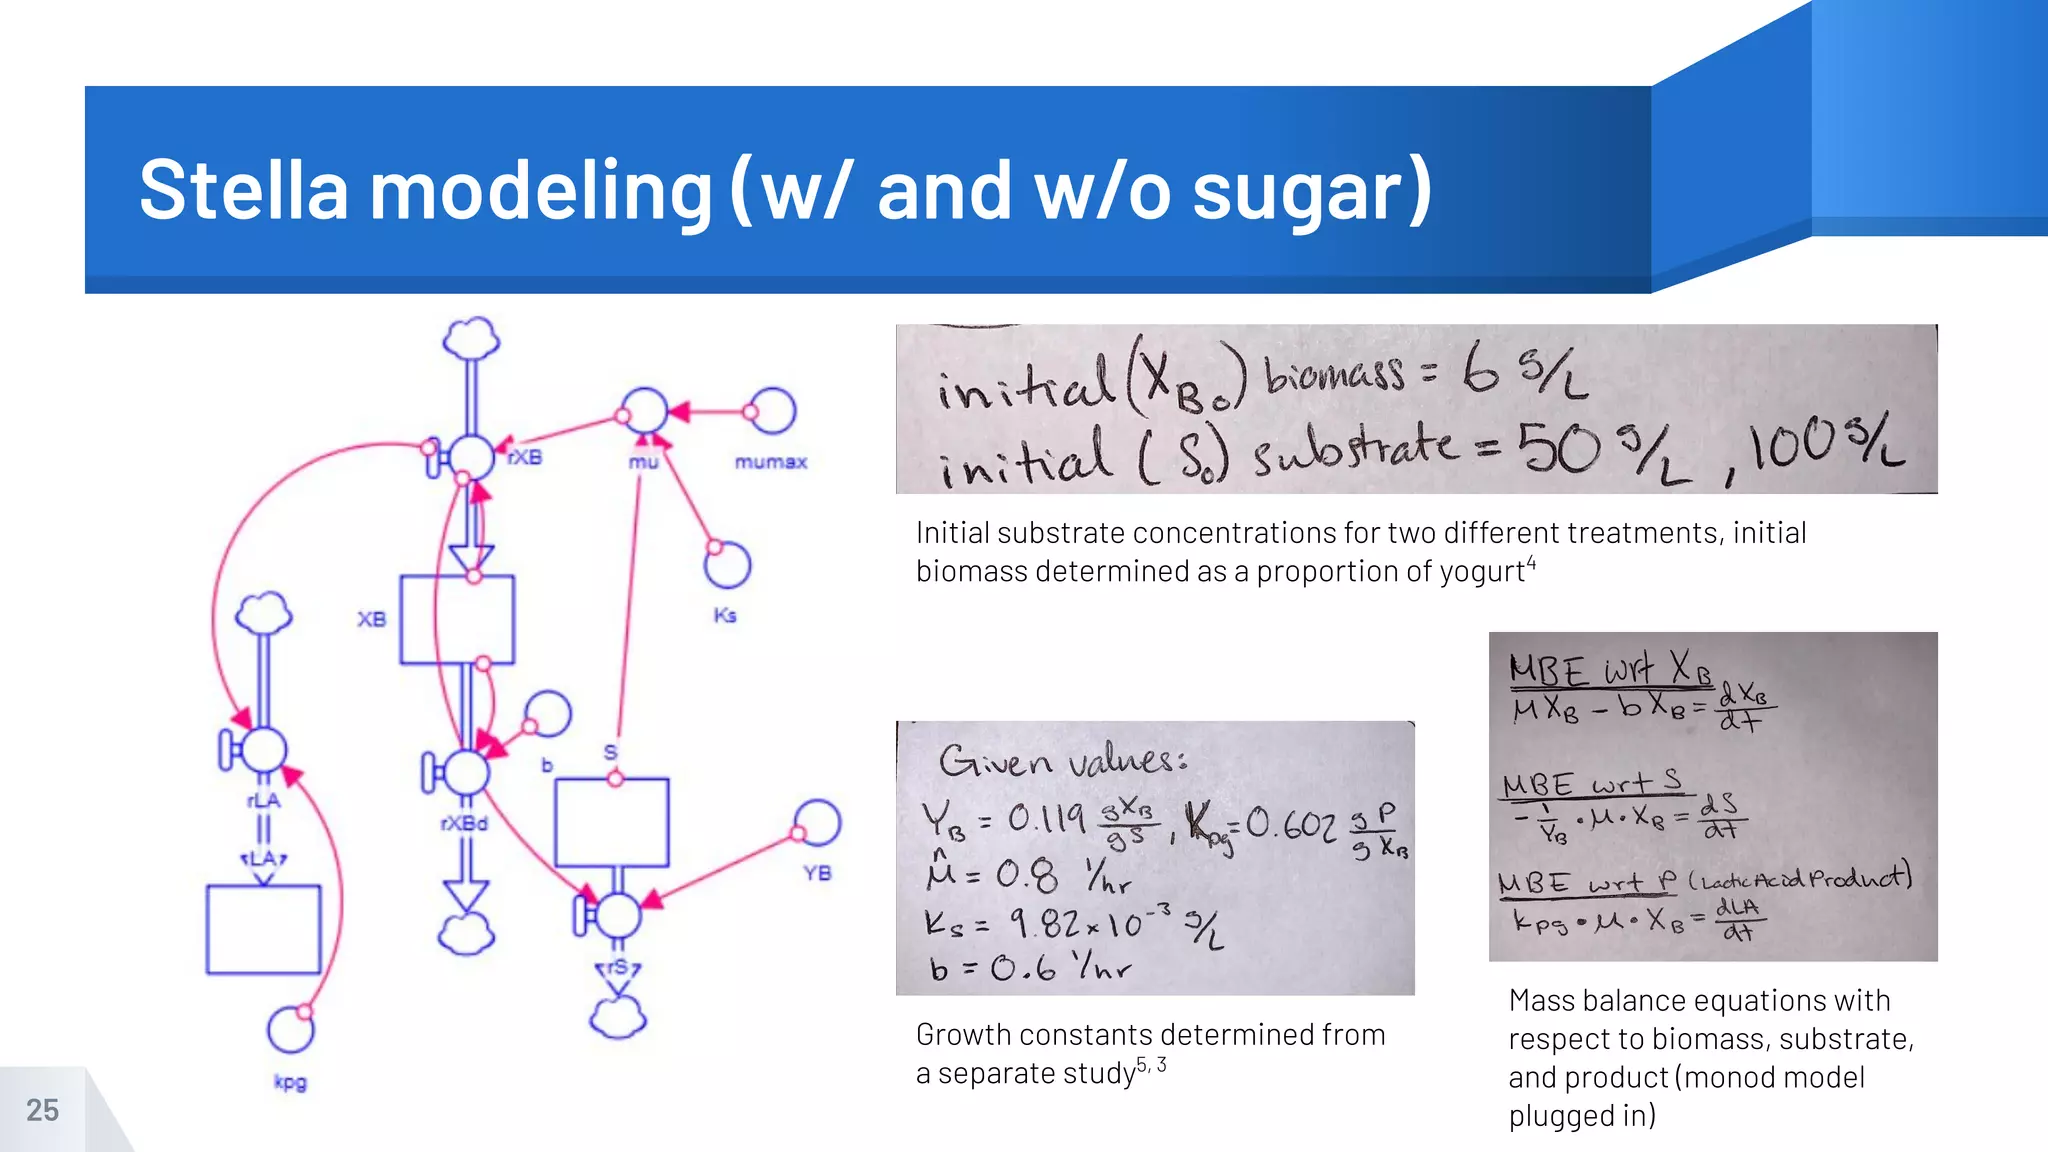
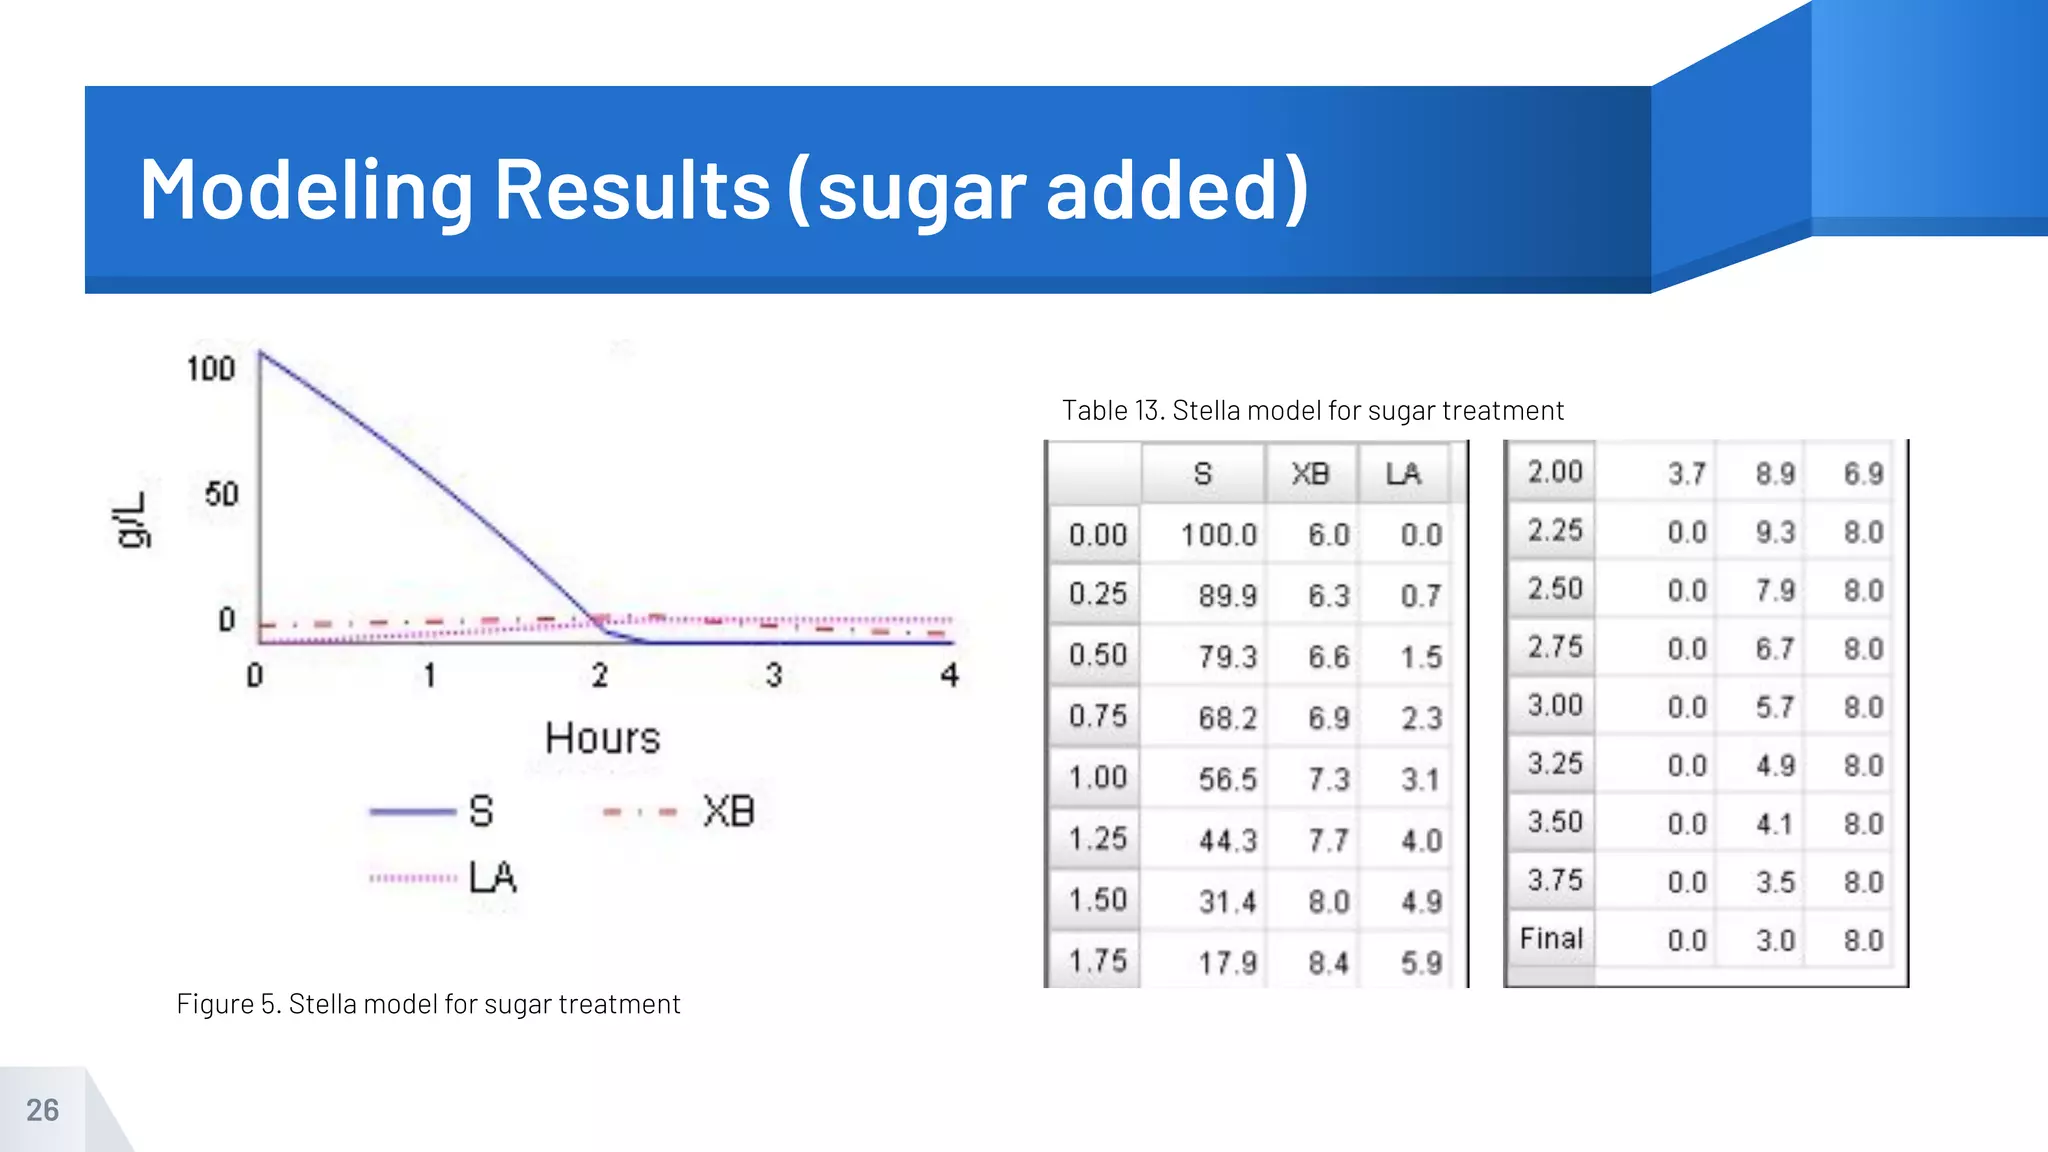
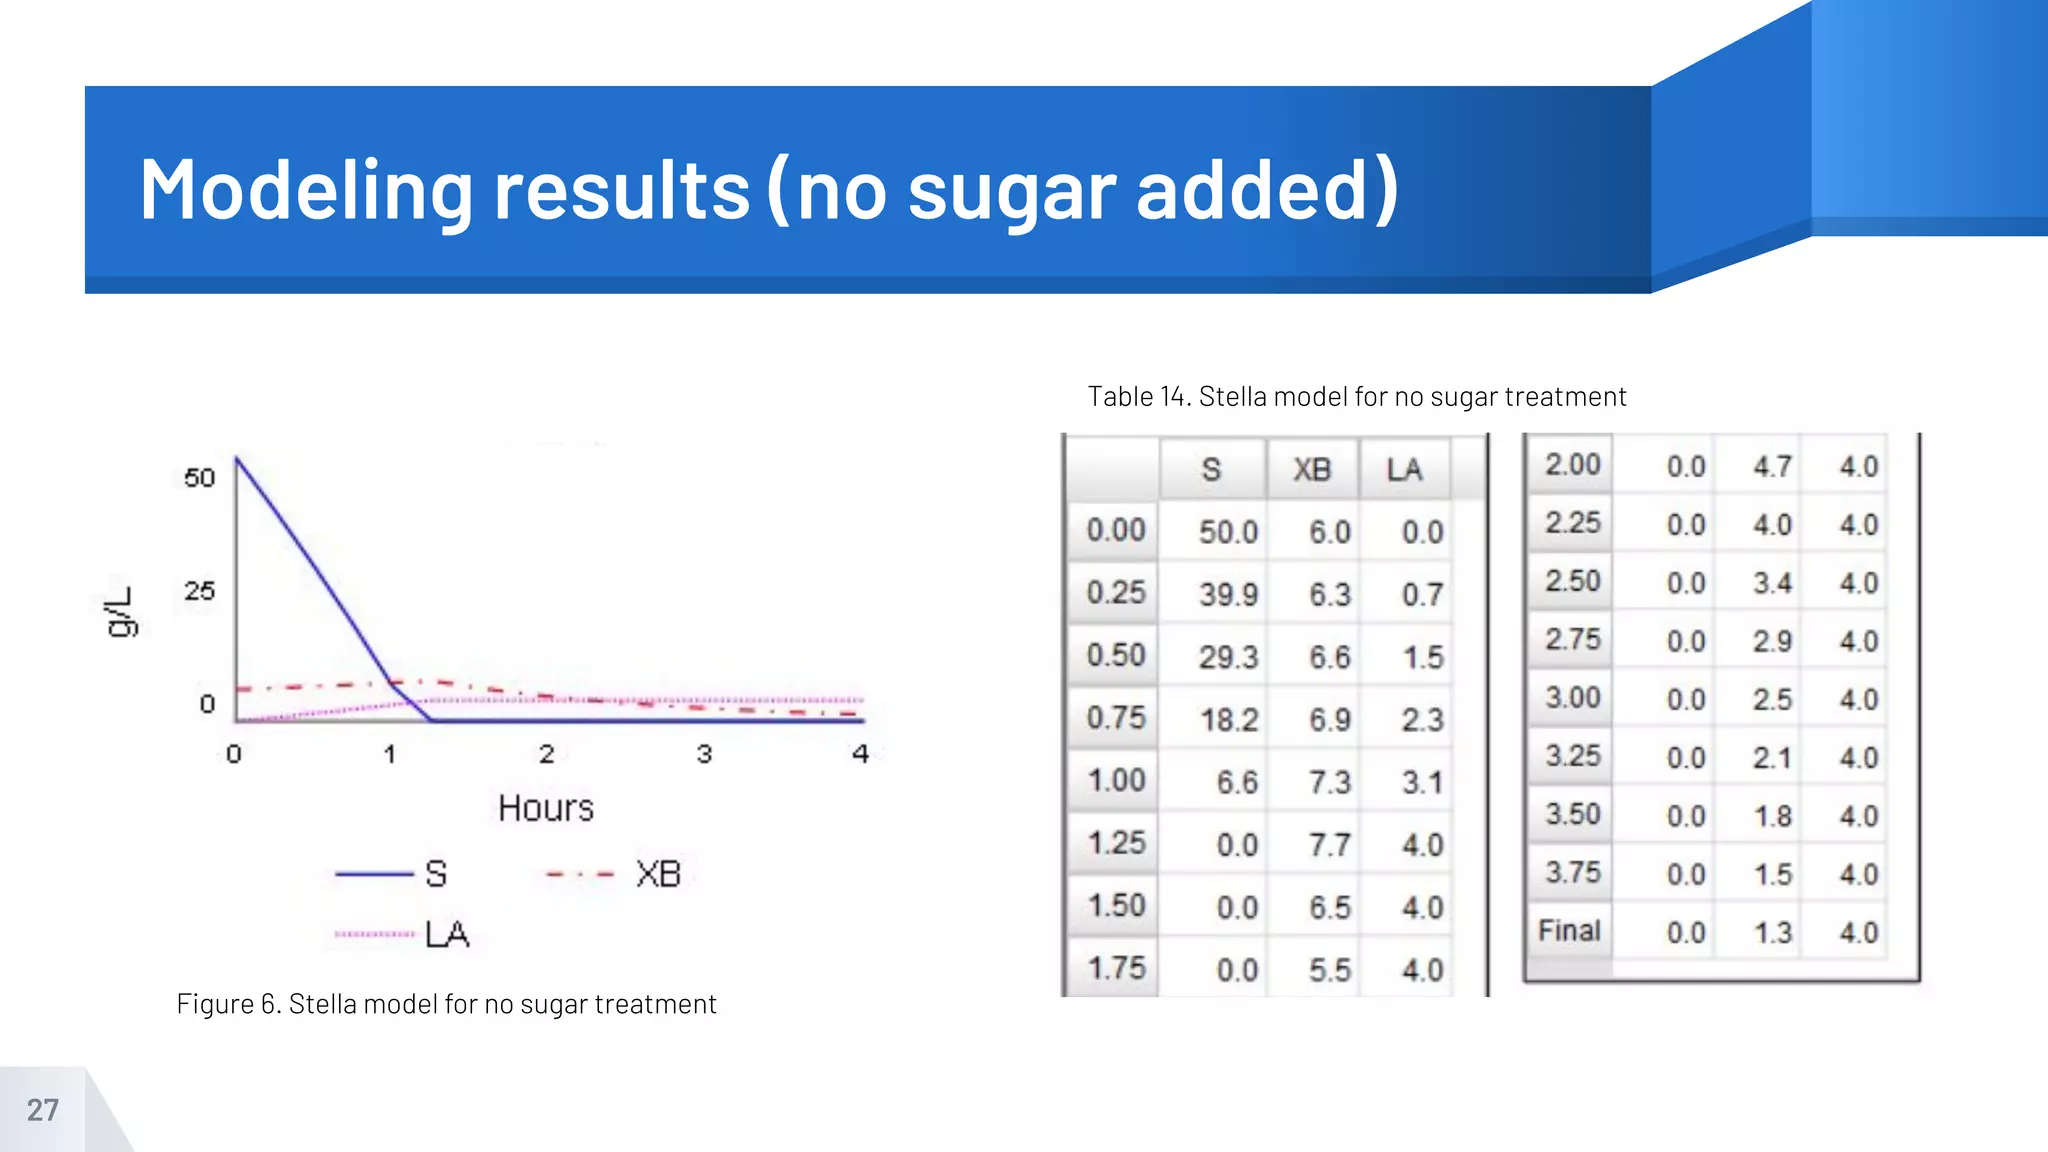
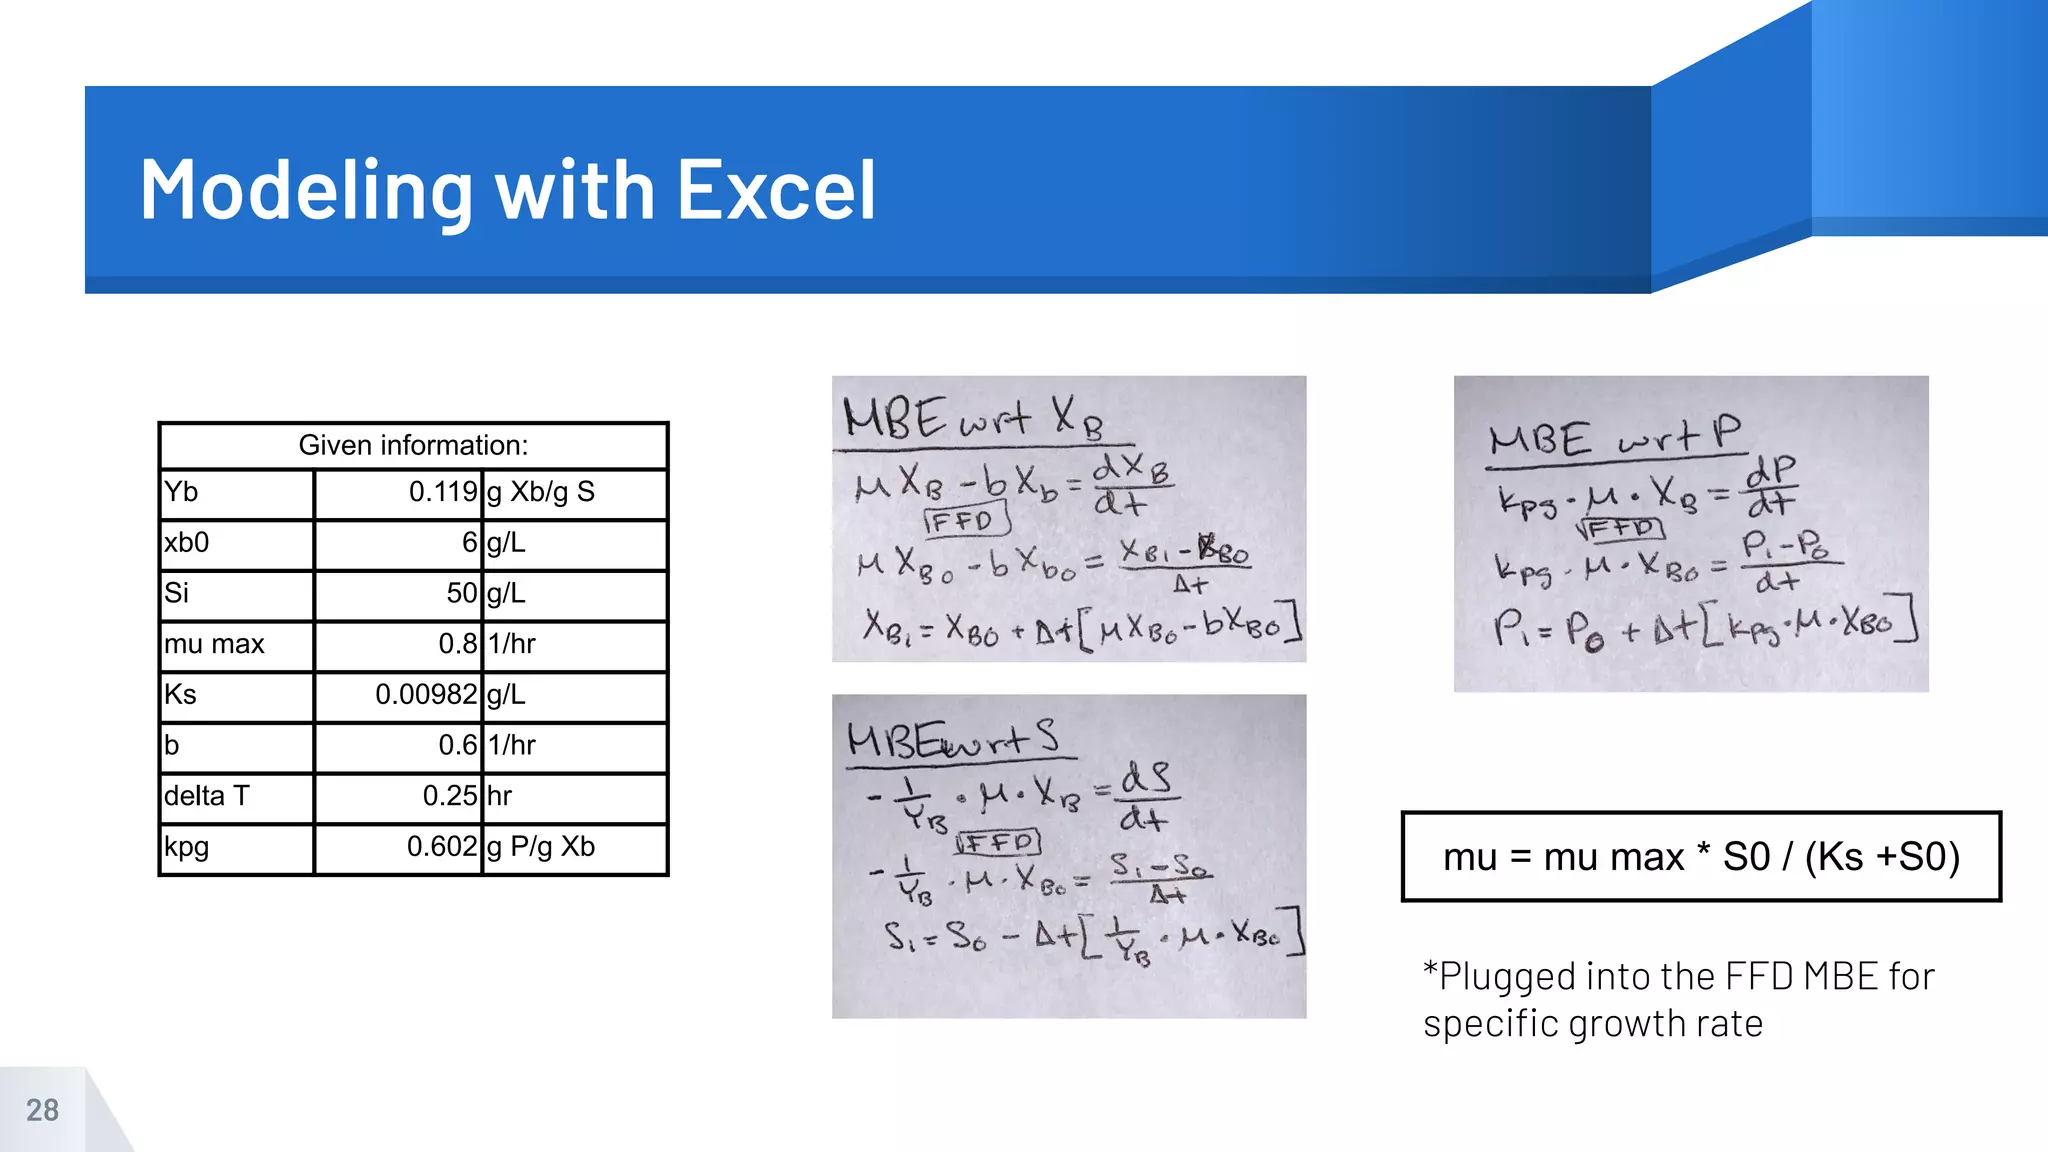
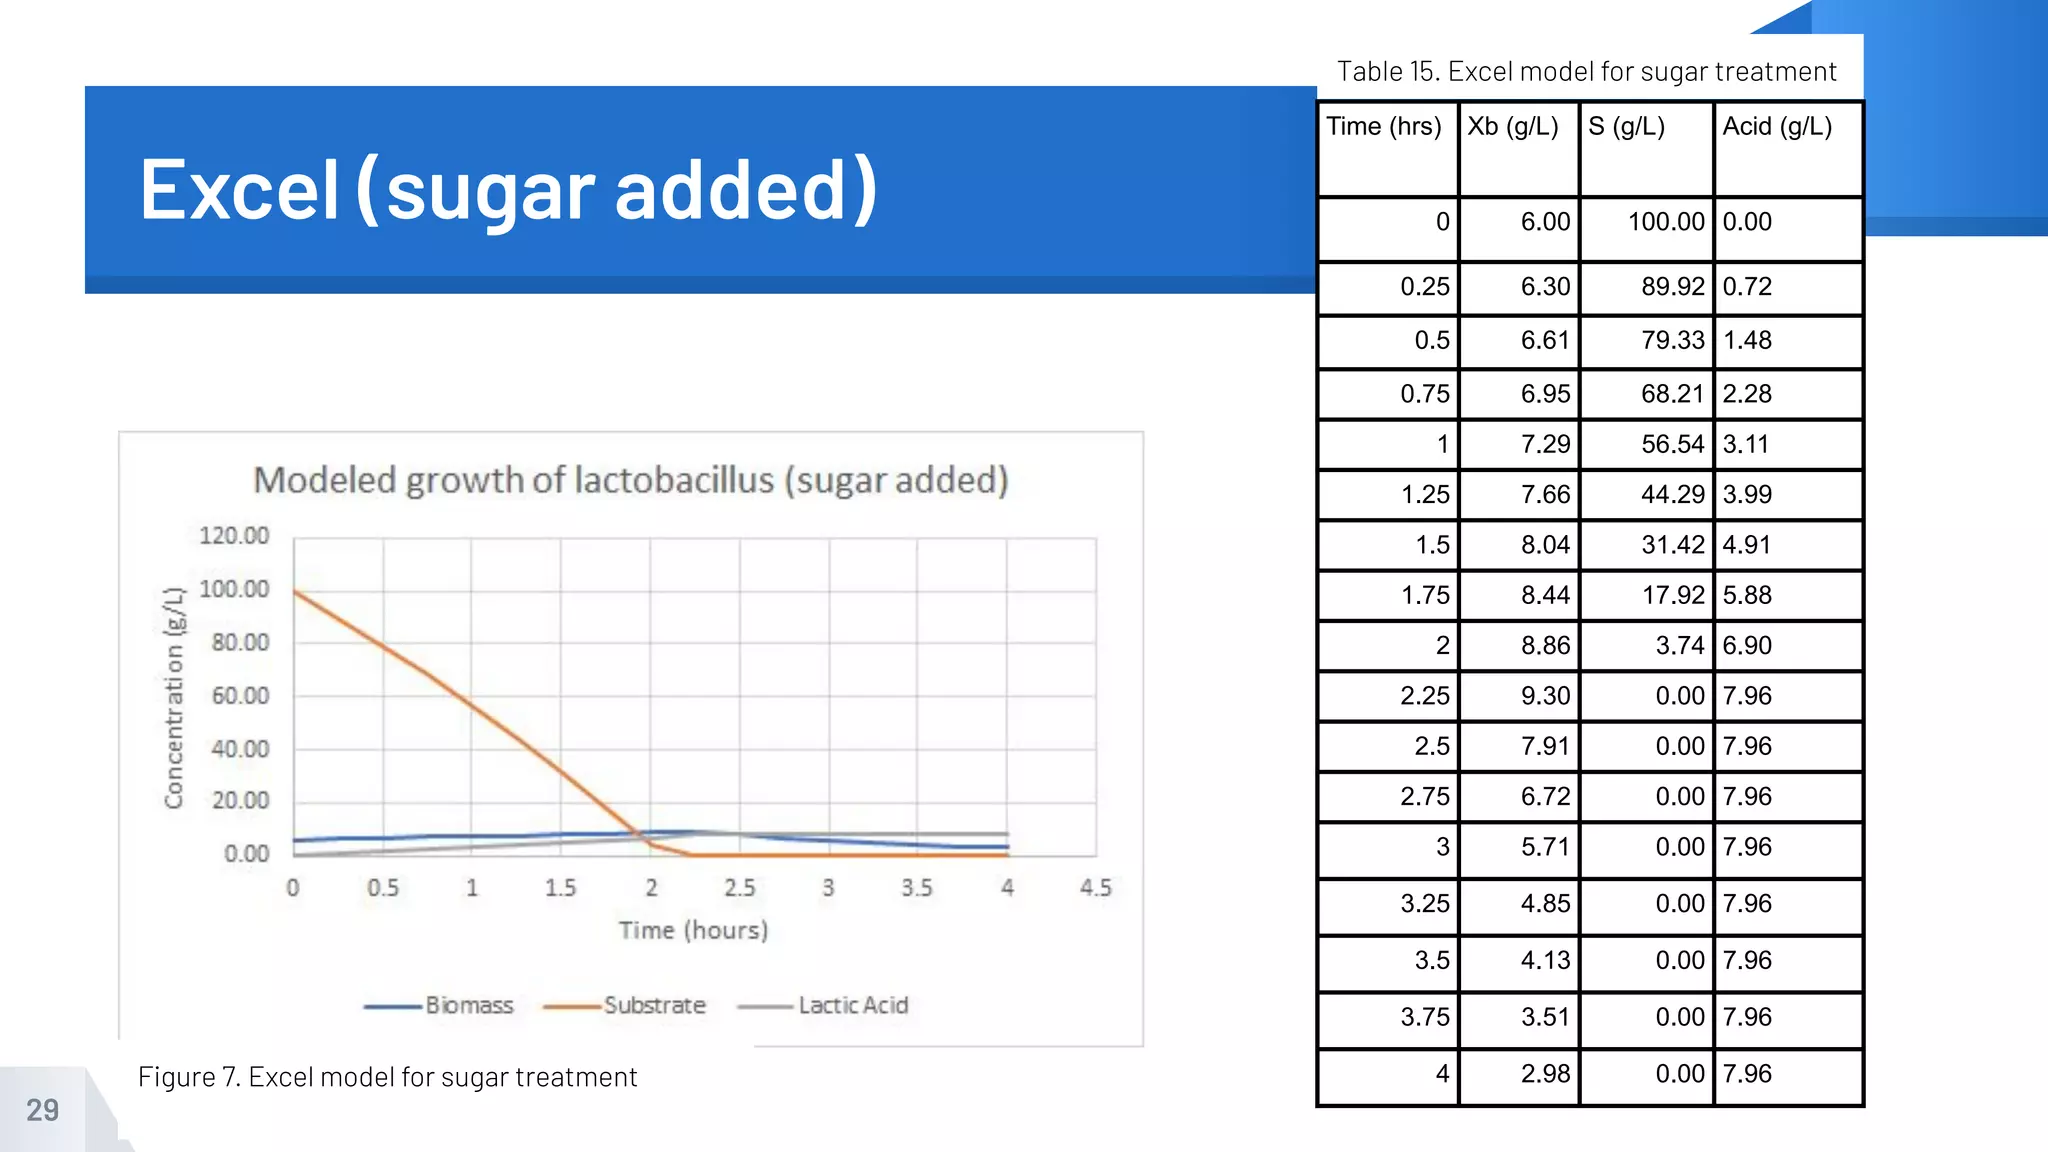
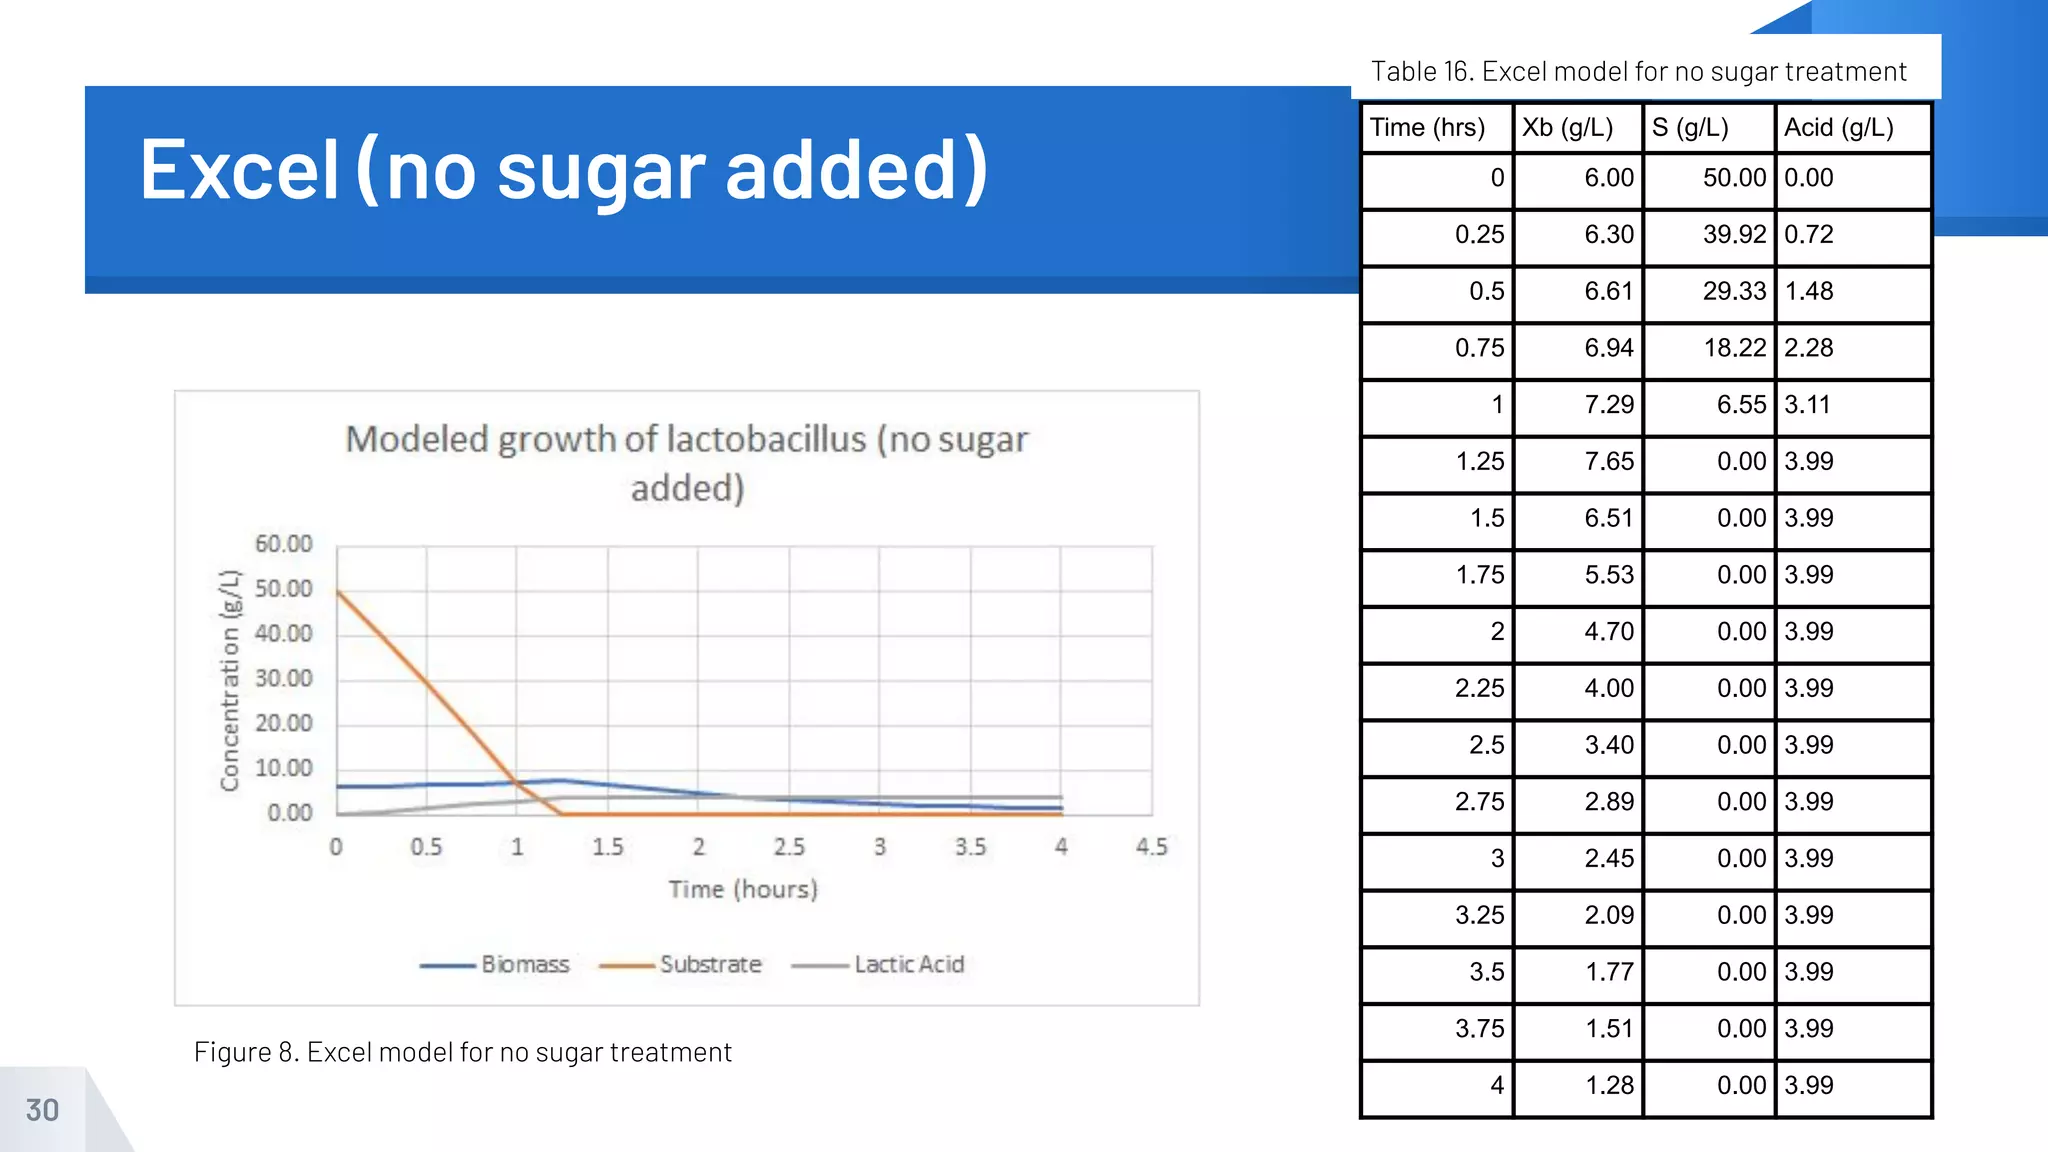
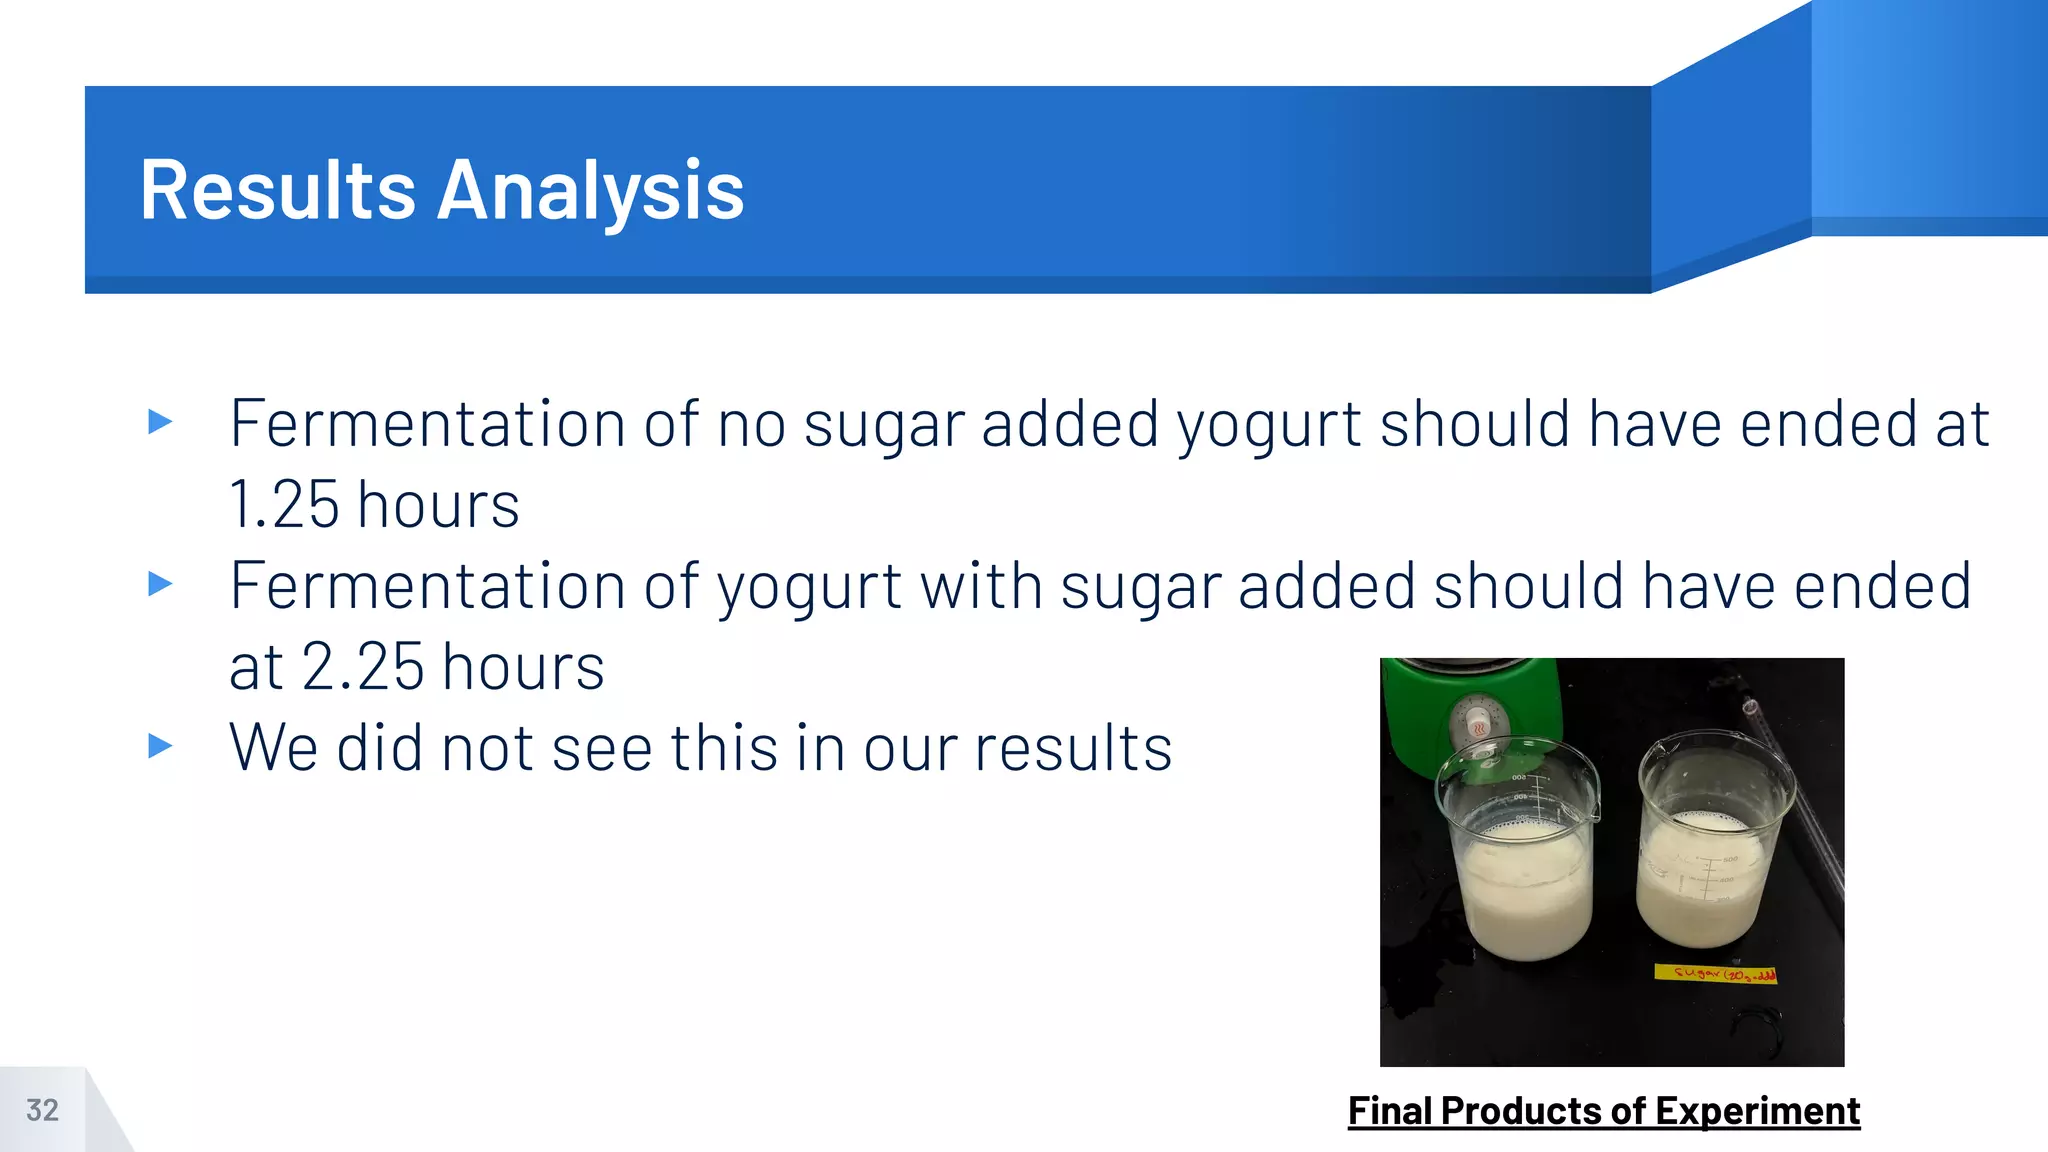
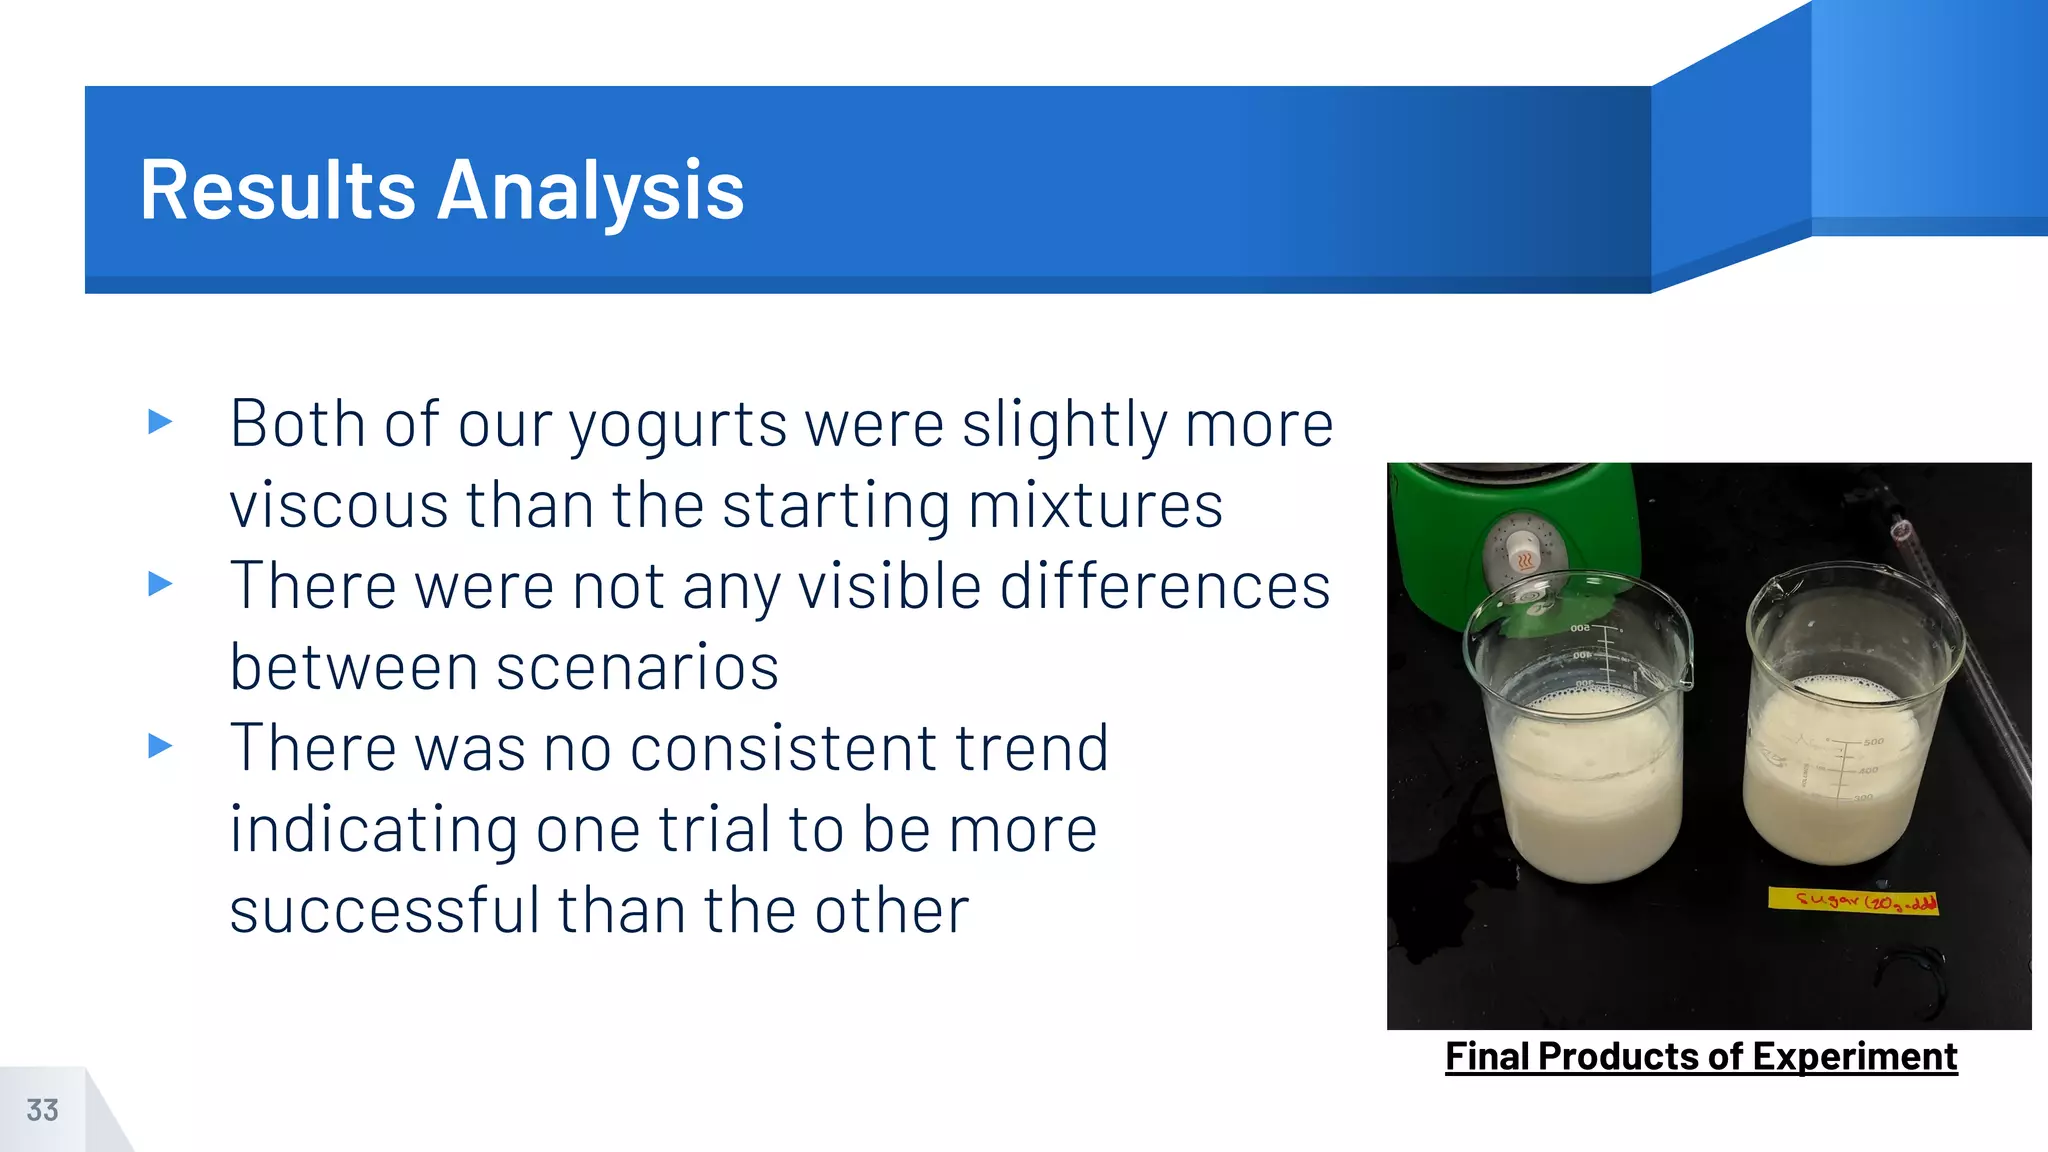
Formation of Yogurt with
Variable Sugar Concentrations
Alexis McFadden
Cody Eimen
Michael Smith
BE 4100
Introduction
Background information and objective
1
Background: Objective
▸ Make yogurt by adding starter culture
to skim milk, both with added sugar
and without added sugar.
▸ Measure yogurt production and
compare growth scenarios.
▸ Hypothesis: More sugars available to
the bacteria → more fermentation →
greater concentration of biomass in
yogurt
3
Professionally Made Yogurt
Background
▸ Fermentation utilizes sugars as substrate.
▹ Without oxygen (accomplished through experimental setup)
▸ Main bacteria grown: Strains of Lactobacillus
▸ From Balanced growth equation 4
:
▹ YB
= 0.119 g XB
/g S, kpg
= 0.602 g P/g XB
▸ Lactose found in milk, sucrose added to one scenario
▸ Lactose→ glucose + galactose
▸ Table sugar (sucrose) → glucose + fructose
4
What we measured and why
▸ pH : as fermentation progresses, lactic acid is produced.
▹ Lower pH = more progressed reaction
▸ Viscosity : as the bacteria underwent fermentation, proteins found in the milk
precipitated, causing the solution to thicken.
▹ More viscous solutions = more progressed reaction
▸ Temperature : to ensure reactors stayed in viable bacterial temperature
range (43° C was target temperature)
▸ Titration with a base: to determine acidity of the solution.
▹ More titrant required = more progressed reaction
▸ COD Absorbance: measuring the presence of sugars in the solutions
▹ Lower COD/absorbance = Less sugars = more progressed reaction
5
Materials and Methods
What we did and how we did it
2
Materials for yogurt production
▸ Stonyfield Organic Probiotic Whole Milk
Vanilla Yogurt
▹ S. thermophilus, L. bulgaricus, L.
acidophilus, L. rhamnosus
▸ Table sugar
▸ Heating/stirring plates
▸ Skim milk
▸ Beakers
▸ Water
7
Starter Yogurt Used
Materials for measuring progress
▸ Basic titration set up for acid
▸ pH probe
▸ Thermometer
▸ Zahn type cup viscometers
▸ Timer
▸ COD vials
▸ Spectrophotometer
8
pH of Yogurt being measured
Procedure
▸ Created a water jacket
▹ Placed 250 mL beaker inside 1000 mL beaker filled
with water
▹ Put on hot plate and boiled water
▸ Poured 200 mL of skim milk into the 250 mL beaker
▹ Added stir bar
▹ Measured temperature until milk reached around
90-95°C to kill competing bacteria
9
Hot Water Jackets
Procedure Cntd.
▸ Poured hot water out of beaker and replaced with
cool water
▹ To achieve milk temperature of 43°C
▸ Added 10g of yogurt to milk
▹ Mixed for one minute
▸ Added 10 g sugar to one beaker
▸ Measured pH, temperature, COD, and viscosity of
milk
▹ Measured at times t = 0, 30, 60, 120, 180, 240
minutes
10
Table Sugar being Weighed
Measurement Procedures
▸ Temperature Measurement
▹ Used thermometer
▹ Adjusted hot plate accordingly
▸ Alkalinity Measurement
▹ Titrated using a base (0.2 N NaOH)
▸ COD Measurement
▹ Filtered out biomass
▹ Used COD vials and oven
11 Temperature being Measured
Measurement Procedures Cntd.
▸ pH Measurement
▹ Calibrated probe using standard solutions
▹ Measured pH using probe
▸ Viscosity Measurement
▹ Ran the product through five different Zahn
cups viscometers
▹ Used timer to measure amount of time it
took for liquid to stop flowing
12
Results and Discussion
What happened and what it means
3
pH Data
14
Time,
min
pH
0 6.38
30 6.27
60 5.93
120 5.95
180 5.87
240 5.80
Time,
min
pH
0 6.39
30 6.33
60 6.02
120 5.96
180 5.93
240 5.76
Table 1. pH data, no
sugar added
Table 2. pH data,
sugar added
● No sugar growth scenario had a lower pH
than the scenario with sugar until the last
reading taken.
● Did not reach target pH in 4 hour time
period (yogurt has a pH of around 4.5 1
)
15
Figure 1. pH Values Over Time of both Yogurt With and Without Sugar
16
Time,
min
Cup #1 Cup #2 Cup #3 Cup #4 Cup #5
0 30.41 13.14 8.06 6.87 3.95
30 32.53 12.78 8.48 6.38 3.70
60 29.78 12.64 7.20 5.93 3.54
120 33.12 13.55 7.96 6.20 4.31
180 23.54 14.29 7.76 6.55 3.79
240 31.52 14.52 7.96 6.79 4.20
Viscosity Data
Time,
min
Cup #1 Cup #2 Cup #3 Cup #4 Cup #5
0 30.58 13.48 7.26 6.70 3.68
30 31.54 13.88 7.90 6.33 3.76
60 27.71 13.67 7.43 5.99 3.64
120 24.56 13.71 8.11 6.73 3.79
180 25.71 16.11 8.86 6.73 4.21
240 32.89 13.45 7.98 6.82 4.19
Table 3. Viscosity data, no sugar added Table 4. Viscosity data, sugar added
17
Time, min Cup #1,
No sugar
Viscosity,
cSt
Cup #1,
Sugar
Viscosity,
cSt
0 30.41 1.551 30.58 1.738
30 32.53 3.883 31.54 2.794
60 29.78 0.858 27.71 -1.419
120 33.12 4.532 24.56 -4.884
180 23.54 -6.006 25.71 -3.619
240 31.52 2.772 32.89 4.279
Viscosity Data
● Only Cup #1 analyzed because these values were
the closest to being within the targeted range.
● Sample Calculation:
○ Zahn Cup #1 Formula: viscosity = 1.1*(t-29)
○ Viscosity = 1.1*(30.41-29) = 1.551 cSt
Table 5. Viscosity data, cup #1
18
Viscosity calculations and graph
Figure 2. Viscosity values over time
Neg
COD Absorbance
19
Time (min) Absorbance
0 0.478
30 0.494
60 0.546
120 0.526
180 0.514
240 0.544
Time (min) Absorbance
0 0.528
30 0.486
60 0.540
120 0.482
180 0.518
240 0.544
Table 9. COD Abs, No sugar Table 10. COD Abs, Sugar
● Absorbance initially was higher for
the sugar added yogurt
● Final measurements for COD
absorbance were the same
○ Same amount of sugar present
in both growth scenarios
COD Calculations
▸ COD Measurement
▹ 1:10 dilution
▸ COD Equations2
:
▹ COD= (ABS600
- 0.020400) / 0.052766
▹ Diluted glucose (g/L)=(COD (g/L) * g glucose) / 1.067 g COD
▹ Glucose (g/L)= Dilution glucose (g/L) *10
▸ Sample Calculation:
▹ COD= (0.478-0.020400)/0.052766= 8.672 g/L
▹ Diluted glucose (g/L)= (8.672 g/L *g glucose)/1.067 g COD= 8.1277 g/L
▹ Glucose (g/L)= 8.1277*10= 81.28 g/L
20
COD Calculations
21
Time (min) Absorbance COD (g/L) Glucose (g/L)
0 0.478 8.672 81.277
30 0.494 8.975 84.119
60 0.546 9.961 93.355
120 0.526 9.582 89.803
180 0.514 9.355 87.671
240 0.544 9.923 93.000
Table 11. COD calculations no sugar added Table 12. COD calculations sugar added
Time (min) Absorbance COD (g/L) Glucose (g/L)
0 0.528 9.620 90.158
30 0.486 8.824 82.698
60 0.54 9.847 92.289
120 0.482 8.748 81.987
180 0.518 9.430 88.382
240 0.544 9.923 93.000
COD Values
22
Figure 4. Glucose Concentration Determined Through COD vs Time Graph
Titration Data
23
Table 6. Titration data no
sugar added
Table 7. Titration data sugar
added
● Alkalinity/acidity calculation
○ Acidity, mol eq/L= (VB
*N) / VS
○ VB
= volume of basic titrant added (mL)
○ N = normality of basic titrant (Equ/L)
○ VS
= volume of sample (mL)
● Sample Calculation:
○ Acidity= (3.6*0.2) / 5= 0.144 mol Eq/L
Time,
min
V1b
(mL)
V2b
(mL)
0 0 4.2
30 7.9 12.4
60 29 34.5
120 41.9 48.5
180 14.0 20.6
240 27.8 36.1
Time,
min
V1b
(mL)
V2b
(mL)
0 4.3 7.9
30 12.4 17.2
60 34.9 41.9
120 38.5 44.5
180 20.6 27.8
240 36.1 44.6
24
No Sugar
Added
Sugar
Added
Time, min Acidity mol Eq/L
0 0.144 0.168
30 0.192 0.18
60 0.280 0.22
120 0.240 0.264
180 0.288 0.264
240 0.340 0.332
(Figure 3) Acidity vs Time Graph
Table 8. Alkalinity/acidity results
Stella modeling (w/ and w/o sugar)
25
Growth constants determined from
a separate study5, 3
Mass balance equations with
respect to biomass, substrate,
and product (monod model
plugged in)
Initial substrate concentrations for two different treatments, initial
biomass determined as a proportion of yogurt4
Modeling Results (sugar added)
26
Figure 5. Stella model for sugar treatment
Table 13. Stella model for sugar treatment
Modeling results (no sugar added)
27
Table 14. Stella model for no sugar treatment
Figure 6. Stella model for no sugar treatment
Modeling with Excel
28
Given information:
Yb 0.119 g Xb/g S
xb0 6 g/L
Si 50 g/L
mu max 0.8 1/hr
Ks 0.00982 g/L
b 0.6 1/hr
delta T 0.25 hr
kpg 0.602 g P/g Xb mu = mu max * S0 / (Ks +S0)
*Plugged into the FFD MBE for
specific growth rate
Excel (sugar added)
29
Time (hrs) Xb (g/L) S (g/L) Acid (g/L)
0 6.00 100.00 0.00
0.25 6.30 89.92 0.72
0.5 6.61 79.33 1.48
0.75 6.95 68.21 2.28
1 7.29 56.54 3.11
1.25 7.66 44.29 3.99
1.5 8.04 31.42 4.91
1.75 8.44 17.92 5.88
2 8.86 3.74 6.90
2.25 9.30 0.00 7.96
2.5 7.91 0.00 7.96
2.75 6.72 0.00 7.96
3 5.71 0.00 7.96
3.25 4.85 0.00 7.96
3.5 4.13 0.00 7.96
3.75 3.51 0.00 7.96
4 2.98 0.00 7.96
Figure 7. Excel model for sugar treatment
Table 15. Excel model for sugar treatment
Excel (no sugar added)
30
Time (hrs) Xb (g/L) S (g/L) Acid (g/L)
0 6.00 50.00 0.00
0.25 6.30 39.92 0.72
0.5 6.61 29.33 1.48
0.75 6.94 18.22 2.28
1 7.29 6.55 3.11
1.25 7.65 0.00 3.99
1.5 6.51 0.00 3.99
1.75 5.53 0.00 3.99
2 4.70 0.00 3.99
2.25 4.00 0.00 3.99
2.5 3.40 0.00 3.99
2.75 2.89 0.00 3.99
3 2.45 0.00 3.99
3.25 2.09 0.00 3.99
3.5 1.77 0.00 3.99
3.75 1.51 0.00 3.99
4 1.28 0.00 3.99
Figure 8. Excel model for no sugar treatment
Table 16. Excel model for no sugar treatment
Conclusion
Final wrap up
4
Results Analysis
▸ Fermentation of no sugar added yogurt should have ended at
1.25 hours
▸ Fermentation of yogurt with sugar added should have ended
at 2.25 hours
▸ We did not see this in our results
32 Final Products of Experiment
Results Analysis
▸ Both of our yogurts were slightly more
viscous than the starting mixtures
▸ There were not any visible differences
between scenarios
▸ There was no consistent trend
indicating one trial to be more
successful than the other
33
Final Products of Experiment
Ways to improve
▸ Have a more consistent/precise heating mechanism
▸ Whole milk instead of skim milk
▸ Use more precise thermometers
▸ Use a larger amount of starter yogurt
▸ The theoretical plots show that to get 4 hours of data,
more sugar was necessary
▸ Filtering with smaller pore size for COD vials
34
References
Giving credit
5
References
1. Drapcho, C. 2020. Lab 8: Fermentation of Milk Product to Produce Yogurt. Unpublished
Laboratory Notes, BE 4101, Clemson University, Clemson SC.
2. Eimen, C., McFadden, A., & Lawrence, M. 2020. BE 4101 Lab 6 Data Summary (Rep.).
3. Liu, K., Zeng, X., Qiao, L., Li, X., Yang, Y., Dai, C., . . . Xu, D. (2014). The sensitivity and significance
analysis of parameters in the model of pH regulation on lactic acid production by
Lactobacillus bulgaricus. Retrieved December 2, 2020, from
https://www.ncbi.nlm.nih.gov/pmc/articles/PMC4248659/ .
4. Mani-López, E., Palou, E., & López-Malo, A. (2014, April 17). Probiotic viability and storage stability of
yogurts and fermented milks prepared with several mixtures of lactic acid bacteria. Retrieved
December 2, 2020, from
https://www.sciencedirect.com/science/article/pii/S0022030214002549 .
5. Rezvani, F., Ardestani, F., & Najafpour, G. (2017). Growth kinetic models of five species of Lactobacilli and
lactose consumption in batch submerged culture. Retrieved December 2, 2020, from
https://www.ncbi.nlm.nih.gov/pmc/articles/PMC5470453/ .
36
Thanks!
Any questions?
37

Real yogurt presentation be 4100

  • 1.
    Formation of Yogurtwith Variable Sugar Concentrations Alexis McFadden Cody Eimen Michael Smith BE 4100
  • 2.
  • 3.
    Background: Objective ▸ Makeyogurt by adding starter culture to skim milk, both with added sugar and without added sugar. ▸ Measure yogurt production and compare growth scenarios. ▸ Hypothesis: More sugars available to the bacteria → more fermentation → greater concentration of biomass in yogurt 3 Professionally Made Yogurt
  • 4.
    Background ▸ Fermentation utilizessugars as substrate. ▹ Without oxygen (accomplished through experimental setup) ▸ Main bacteria grown: Strains of Lactobacillus ▸ From Balanced growth equation 4 : ▹ YB = 0.119 g XB /g S, kpg = 0.602 g P/g XB ▸ Lactose found in milk, sucrose added to one scenario ▸ Lactose→ glucose + galactose ▸ Table sugar (sucrose) → glucose + fructose 4
  • 5.
    What we measuredand why ▸ pH : as fermentation progresses, lactic acid is produced. ▹ Lower pH = more progressed reaction ▸ Viscosity : as the bacteria underwent fermentation, proteins found in the milk precipitated, causing the solution to thicken. ▹ More viscous solutions = more progressed reaction ▸ Temperature : to ensure reactors stayed in viable bacterial temperature range (43° C was target temperature) ▸ Titration with a base: to determine acidity of the solution. ▹ More titrant required = more progressed reaction ▸ COD Absorbance: measuring the presence of sugars in the solutions ▹ Lower COD/absorbance = Less sugars = more progressed reaction 5
  • 6.
    Materials and Methods Whatwe did and how we did it 2
  • 7.
    Materials for yogurtproduction ▸ Stonyfield Organic Probiotic Whole Milk Vanilla Yogurt ▹ S. thermophilus, L. bulgaricus, L. acidophilus, L. rhamnosus ▸ Table sugar ▸ Heating/stirring plates ▸ Skim milk ▸ Beakers ▸ Water 7 Starter Yogurt Used
  • 8.
    Materials for measuringprogress ▸ Basic titration set up for acid ▸ pH probe ▸ Thermometer ▸ Zahn type cup viscometers ▸ Timer ▸ COD vials ▸ Spectrophotometer 8 pH of Yogurt being measured
  • 9.
    Procedure ▸ Created awater jacket ▹ Placed 250 mL beaker inside 1000 mL beaker filled with water ▹ Put on hot plate and boiled water ▸ Poured 200 mL of skim milk into the 250 mL beaker ▹ Added stir bar ▹ Measured temperature until milk reached around 90-95°C to kill competing bacteria 9 Hot Water Jackets
  • 10.
    Procedure Cntd. ▸ Pouredhot water out of beaker and replaced with cool water ▹ To achieve milk temperature of 43°C ▸ Added 10g of yogurt to milk ▹ Mixed for one minute ▸ Added 10 g sugar to one beaker ▸ Measured pH, temperature, COD, and viscosity of milk ▹ Measured at times t = 0, 30, 60, 120, 180, 240 minutes 10 Table Sugar being Weighed
  • 11.
    Measurement Procedures ▸ TemperatureMeasurement ▹ Used thermometer ▹ Adjusted hot plate accordingly ▸ Alkalinity Measurement ▹ Titrated using a base (0.2 N NaOH) ▸ COD Measurement ▹ Filtered out biomass ▹ Used COD vials and oven 11 Temperature being Measured
  • 12.
    Measurement Procedures Cntd. ▸pH Measurement ▹ Calibrated probe using standard solutions ▹ Measured pH using probe ▸ Viscosity Measurement ▹ Ran the product through five different Zahn cups viscometers ▹ Used timer to measure amount of time it took for liquid to stop flowing 12
  • 13.
    Results and Discussion Whathappened and what it means 3
  • 14.
    pH Data 14 Time, min pH 0 6.38 306.27 60 5.93 120 5.95 180 5.87 240 5.80 Time, min pH 0 6.39 30 6.33 60 6.02 120 5.96 180 5.93 240 5.76 Table 1. pH data, no sugar added Table 2. pH data, sugar added ● No sugar growth scenario had a lower pH than the scenario with sugar until the last reading taken. ● Did not reach target pH in 4 hour time period (yogurt has a pH of around 4.5 1 )
  • 15.
    15 Figure 1. pHValues Over Time of both Yogurt With and Without Sugar
  • 16.
    16 Time, min Cup #1 Cup#2 Cup #3 Cup #4 Cup #5 0 30.41 13.14 8.06 6.87 3.95 30 32.53 12.78 8.48 6.38 3.70 60 29.78 12.64 7.20 5.93 3.54 120 33.12 13.55 7.96 6.20 4.31 180 23.54 14.29 7.76 6.55 3.79 240 31.52 14.52 7.96 6.79 4.20 Viscosity Data Time, min Cup #1 Cup #2 Cup #3 Cup #4 Cup #5 0 30.58 13.48 7.26 6.70 3.68 30 31.54 13.88 7.90 6.33 3.76 60 27.71 13.67 7.43 5.99 3.64 120 24.56 13.71 8.11 6.73 3.79 180 25.71 16.11 8.86 6.73 4.21 240 32.89 13.45 7.98 6.82 4.19 Table 3. Viscosity data, no sugar added Table 4. Viscosity data, sugar added
  • 17.
    17 Time, min Cup#1, No sugar Viscosity, cSt Cup #1, Sugar Viscosity, cSt 0 30.41 1.551 30.58 1.738 30 32.53 3.883 31.54 2.794 60 29.78 0.858 27.71 -1.419 120 33.12 4.532 24.56 -4.884 180 23.54 -6.006 25.71 -3.619 240 31.52 2.772 32.89 4.279 Viscosity Data ● Only Cup #1 analyzed because these values were the closest to being within the targeted range. ● Sample Calculation: ○ Zahn Cup #1 Formula: viscosity = 1.1*(t-29) ○ Viscosity = 1.1*(30.41-29) = 1.551 cSt Table 5. Viscosity data, cup #1
  • 18.
    18 Viscosity calculations andgraph Figure 2. Viscosity values over time Neg
  • 19.
    COD Absorbance 19 Time (min)Absorbance 0 0.478 30 0.494 60 0.546 120 0.526 180 0.514 240 0.544 Time (min) Absorbance 0 0.528 30 0.486 60 0.540 120 0.482 180 0.518 240 0.544 Table 9. COD Abs, No sugar Table 10. COD Abs, Sugar ● Absorbance initially was higher for the sugar added yogurt ● Final measurements for COD absorbance were the same ○ Same amount of sugar present in both growth scenarios
  • 20.
    COD Calculations ▸ CODMeasurement ▹ 1:10 dilution ▸ COD Equations2 : ▹ COD= (ABS600 - 0.020400) / 0.052766 ▹ Diluted glucose (g/L)=(COD (g/L) * g glucose) / 1.067 g COD ▹ Glucose (g/L)= Dilution glucose (g/L) *10 ▸ Sample Calculation: ▹ COD= (0.478-0.020400)/0.052766= 8.672 g/L ▹ Diluted glucose (g/L)= (8.672 g/L *g glucose)/1.067 g COD= 8.1277 g/L ▹ Glucose (g/L)= 8.1277*10= 81.28 g/L 20
  • 21.
    COD Calculations 21 Time (min)Absorbance COD (g/L) Glucose (g/L) 0 0.478 8.672 81.277 30 0.494 8.975 84.119 60 0.546 9.961 93.355 120 0.526 9.582 89.803 180 0.514 9.355 87.671 240 0.544 9.923 93.000 Table 11. COD calculations no sugar added Table 12. COD calculations sugar added Time (min) Absorbance COD (g/L) Glucose (g/L) 0 0.528 9.620 90.158 30 0.486 8.824 82.698 60 0.54 9.847 92.289 120 0.482 8.748 81.987 180 0.518 9.430 88.382 240 0.544 9.923 93.000
  • 22.
    COD Values 22 Figure 4.Glucose Concentration Determined Through COD vs Time Graph
  • 23.
    Titration Data 23 Table 6.Titration data no sugar added Table 7. Titration data sugar added ● Alkalinity/acidity calculation ○ Acidity, mol eq/L= (VB *N) / VS ○ VB = volume of basic titrant added (mL) ○ N = normality of basic titrant (Equ/L) ○ VS = volume of sample (mL) ● Sample Calculation: ○ Acidity= (3.6*0.2) / 5= 0.144 mol Eq/L Time, min V1b (mL) V2b (mL) 0 0 4.2 30 7.9 12.4 60 29 34.5 120 41.9 48.5 180 14.0 20.6 240 27.8 36.1 Time, min V1b (mL) V2b (mL) 0 4.3 7.9 30 12.4 17.2 60 34.9 41.9 120 38.5 44.5 180 20.6 27.8 240 36.1 44.6
  • 24.
    24 No Sugar Added Sugar Added Time, minAcidity mol Eq/L 0 0.144 0.168 30 0.192 0.18 60 0.280 0.22 120 0.240 0.264 180 0.288 0.264 240 0.340 0.332 (Figure 3) Acidity vs Time Graph Table 8. Alkalinity/acidity results
  • 25.
    Stella modeling (w/and w/o sugar) 25 Growth constants determined from a separate study5, 3 Mass balance equations with respect to biomass, substrate, and product (monod model plugged in) Initial substrate concentrations for two different treatments, initial biomass determined as a proportion of yogurt4
  • 26.
    Modeling Results (sugaradded) 26 Figure 5. Stella model for sugar treatment Table 13. Stella model for sugar treatment
  • 27.
    Modeling results (nosugar added) 27 Table 14. Stella model for no sugar treatment Figure 6. Stella model for no sugar treatment
  • 28.
    Modeling with Excel 28 Giveninformation: Yb 0.119 g Xb/g S xb0 6 g/L Si 50 g/L mu max 0.8 1/hr Ks 0.00982 g/L b 0.6 1/hr delta T 0.25 hr kpg 0.602 g P/g Xb mu = mu max * S0 / (Ks +S0) *Plugged into the FFD MBE for specific growth rate
  • 29.
    Excel (sugar added) 29 Time(hrs) Xb (g/L) S (g/L) Acid (g/L) 0 6.00 100.00 0.00 0.25 6.30 89.92 0.72 0.5 6.61 79.33 1.48 0.75 6.95 68.21 2.28 1 7.29 56.54 3.11 1.25 7.66 44.29 3.99 1.5 8.04 31.42 4.91 1.75 8.44 17.92 5.88 2 8.86 3.74 6.90 2.25 9.30 0.00 7.96 2.5 7.91 0.00 7.96 2.75 6.72 0.00 7.96 3 5.71 0.00 7.96 3.25 4.85 0.00 7.96 3.5 4.13 0.00 7.96 3.75 3.51 0.00 7.96 4 2.98 0.00 7.96 Figure 7. Excel model for sugar treatment Table 15. Excel model for sugar treatment
  • 30.
    Excel (no sugaradded) 30 Time (hrs) Xb (g/L) S (g/L) Acid (g/L) 0 6.00 50.00 0.00 0.25 6.30 39.92 0.72 0.5 6.61 29.33 1.48 0.75 6.94 18.22 2.28 1 7.29 6.55 3.11 1.25 7.65 0.00 3.99 1.5 6.51 0.00 3.99 1.75 5.53 0.00 3.99 2 4.70 0.00 3.99 2.25 4.00 0.00 3.99 2.5 3.40 0.00 3.99 2.75 2.89 0.00 3.99 3 2.45 0.00 3.99 3.25 2.09 0.00 3.99 3.5 1.77 0.00 3.99 3.75 1.51 0.00 3.99 4 1.28 0.00 3.99 Figure 8. Excel model for no sugar treatment Table 16. Excel model for no sugar treatment
  • 31.
  • 32.
    Results Analysis ▸ Fermentationof no sugar added yogurt should have ended at 1.25 hours ▸ Fermentation of yogurt with sugar added should have ended at 2.25 hours ▸ We did not see this in our results 32 Final Products of Experiment
  • 33.
    Results Analysis ▸ Bothof our yogurts were slightly more viscous than the starting mixtures ▸ There were not any visible differences between scenarios ▸ There was no consistent trend indicating one trial to be more successful than the other 33 Final Products of Experiment
  • 34.
    Ways to improve ▸Have a more consistent/precise heating mechanism ▸ Whole milk instead of skim milk ▸ Use more precise thermometers ▸ Use a larger amount of starter yogurt ▸ The theoretical plots show that to get 4 hours of data, more sugar was necessary ▸ Filtering with smaller pore size for COD vials 34
  • 35.
  • 36.
    References 1. Drapcho, C.2020. Lab 8: Fermentation of Milk Product to Produce Yogurt. Unpublished Laboratory Notes, BE 4101, Clemson University, Clemson SC. 2. Eimen, C., McFadden, A., & Lawrence, M. 2020. BE 4101 Lab 6 Data Summary (Rep.). 3. Liu, K., Zeng, X., Qiao, L., Li, X., Yang, Y., Dai, C., . . . Xu, D. (2014). The sensitivity and significance analysis of parameters in the model of pH regulation on lactic acid production by Lactobacillus bulgaricus. Retrieved December 2, 2020, from https://www.ncbi.nlm.nih.gov/pmc/articles/PMC4248659/ . 4. Mani-López, E., Palou, E., & López-Malo, A. (2014, April 17). Probiotic viability and storage stability of yogurts and fermented milks prepared with several mixtures of lactic acid bacteria. Retrieved December 2, 2020, from https://www.sciencedirect.com/science/article/pii/S0022030214002549 . 5. Rezvani, F., Ardestani, F., & Najafpour, G. (2017). Growth kinetic models of five species of Lactobacilli and lactose consumption in batch submerged culture. Retrieved December 2, 2020, from https://www.ncbi.nlm.nih.gov/pmc/articles/PMC5470453/ . 36
  • 37.