SlideShare a Scribd company logo
1 of 9
© Oizom Instruments PVT LTD
www.oizom.com | hello@oizom.com
REAL-TIME POLLUTION MAPS FOR CITIES
The distribution of air pollution concentration over a large urban area predominantly depends on local emission
sources and atmospheric flow conditions. However, urban areas are the centres of various activities having multiple
and diverse pollutant sources emitting all kinds of air pollutants.
In order to maintain a healthy air environment, it is important to ensure availability of fine resolution air quality data
and ability to visualize it at a neighbourhood scale.
The traditional approach of monitoring air quality at a few selected locations cannot provide such an accurate
representation of total urban air quality.
This gap can be bridged by deploying multiple low-cost sensor-based systems, which are compact and can be
installed virtually anywhere.
According to the World Urbanization Prospects report
released by the United Nations, 54% of the total world
population currently lives in urban areas and this number
will reach 66% by 2050.
“
”
INTRODUCTION Real-time pollution maps for cities
© Oizom Instruments PVT LTD
www.oizom.com | hello@oizom.com
Maps are a convenient way to represent such phenomena that
need to be understood on a geographical scale.
Pollution maps represent the intensity of pollutants in a static
or time-varying way using animated visualization in such a
manner that is intuitively interpretable.
Real-time mapping of air quality provides great insights about
spatio-temporal variation of air quality, which resultantly
provides opportunity to take informed decisions and actions.
MAPPING AIR POLLUTION Real-time pollution maps for cities
© Oizom Instruments PVT LTD
www.oizom.com | hello@oizom.com
Accurate and dynamic representation of pollution
extent and distribution can be developed by feeding
ambient air quality data into an air quality model.
Output maps of these models report real-time air
quality through an interactive map.
Owing to their capability of incorporating secondary
data such as traffic data, meteorological data, terrain
information, local built-environment, etc. in real-time,
they are also known as dynamic maps.
Traffic Layer
Meteorology
Layer
Air-quality Layer
REAL-TIME POLLUTION MAPPING Real-time pollution maps for cities
© Oizom Instruments PVT LTD
www.oizom.com | hello@oizom.com
An exhaustive ambient air quality monitoring network is required to generate sufficient input data for the models
to generate accurate pollution maps.
General guideline for establishing network is to deploy one monitoring device for every 10-20 km2 of area.
However, for hyperlocal real-time ambient air quality monitoring, a network having one monitoring device for
every 4 km2 is recommended.
REAL-TIME POLLUTION MAPPING Real-time pollution maps for cities
© Oizom Instruments PVT LTD
www.oizom.com | hello@oizom.com
Conventional monitoring stations are too expensive
to deploy at such spatial density.
Sensor based monitors are economical and are
capable of providing required spatially dense
representation in real-time.
Dynamic air pollution maps with the spatial
resolution as good as 100 x 100 m can be generated
and updated constantly on an hourly or bihourly
basis.
The software can also be programmed to update
maps automatically every time when pollutant
concentration changes for say, 5-10%.
REAL-TIME POLLUTION MAPPING Real-time pollution maps for cities
© Oizom Instruments PVT LTD
www.oizom.com | hello@oizom.com
The purpose of the mapping air pollution data is to
provide easily interpretable information to the user.
For general purposes, the most common type of
heatmap is based on the AQI. However, based on the
purpose of monitoring, different layers can be added to
the base map.
As meteorological data is recorded at the monitoring
sites, a layer of temperature, rainfall, wind speed, wind
direction, and relative humidity can be added.
Additional analyses such as anomalies, indices,
standard deviation, etc can also be calculated and
represented as a heat map to understand the
spatiotemporal trends of air quality.
DATA PRESENTATION Real-time pollution maps for cities
© Oizom Instruments PVT LTD
www.oizom.com | hello@oizom.com
The most simplistic and elegant definition of a smart-city
can be, “The integration of technology into a
strategic approach to sustainability, citizen well-
being and economic development.”
Intelligent traffic system and smart
transportation
Smart environmental management
Smart utility supply
E-governance and citizen charter
Public safety
MONITORING FOR SMART CITIES Real-time pollution maps for cities
© Oizom Instruments PVT LTD
www.oizom.com | hello@oizom.com
OIZOM provides a platform to measure real-time air quality and
integrate it with smart-city dashboards.
These systems measure air pollution in real-time and develop a
holistic picture of pollution distribution by also incorporating
multiple datasets such as traffic flow.
OIZOM provides their customers API to enable cross-platform
integration to third-party statistical softwares, GIS and mapping
services such as Google Earth, Google Maps, ArcGIS, ESRI
Dashboard, QGIS, Here, TomTom, Mapbox, etc.
OIZOM offers comprehensive and scalable solutions for real-time
environmental monitoring and analytics. The data generated are
integration-friendly for various cross-platform applications, bringing
together multiple stakeholders to provide data-driven solutions for
smart-cities.
OIZOM’S OFFERING Real-time pollution maps for cities
© Oizom Instruments PVT LTD
www.oizom.com | hello@oizom.com

More Related Content

What's hot

What's hot (8)

PoC for Air Quality models using machine learning for MWC 2018
PoC for Air Quality models using machine learning for MWC 2018PoC for Air Quality models using machine learning for MWC 2018
PoC for Air Quality models using machine learning for MWC 2018
 
Pollution Sensor Based Data Communication via Android Device
Pollution Sensor Based Data Communication via Android DevicePollution Sensor Based Data Communication via Android Device
Pollution Sensor Based Data Communication via Android Device
 
Se application notes_smartindustry_hydrocarbon
Se application notes_smartindustry_hydrocarbonSe application notes_smartindustry_hydrocarbon
Se application notes_smartindustry_hydrocarbon
 
Co sensor
Co sensorCo sensor
Co sensor
 
What Drones Can Do for Agriculture?
What Drones Can Do for Agriculture?What Drones Can Do for Agriculture?
What Drones Can Do for Agriculture?
 
Macro-Indicatore M1 - Dal satellite al geofono passando per l’aereo: verifica...
Macro-Indicatore M1 - Dal satellite al geofono passando per l’aereo: verifica...Macro-Indicatore M1 - Dal satellite al geofono passando per l’aereo: verifica...
Macro-Indicatore M1 - Dal satellite al geofono passando per l’aereo: verifica...
 
Axess1 pr powerpoint with vawt video 6 9-13
Axess1 pr powerpoint with vawt video 6 9-13Axess1 pr powerpoint with vawt video 6 9-13
Axess1 pr powerpoint with vawt video 6 9-13
 
AIRSPY: AI-enabled mobile framework to detect air quality
AIRSPY: AI-enabled mobile framework to detect air qualityAIRSPY: AI-enabled mobile framework to detect air quality
AIRSPY: AI-enabled mobile framework to detect air quality
 

Similar to Real time pollution maps with air quality software for smart cities

Ijmer 46044245
Ijmer 46044245Ijmer 46044245
Ijmer 46044245
IJMER
 

Similar to Real time pollution maps with air quality software for smart cities (20)

Group-8-Project
Group-8-ProjectGroup-8-Project
Group-8-Project
 
Smart Environment
Smart EnvironmentSmart Environment
Smart Environment
 
A REVIEW PAPER ON AIR QUALITY METER WITH WARNING SYSTEM
A REVIEW PAPER ON AIR QUALITY METER WITH WARNING SYSTEMA REVIEW PAPER ON AIR QUALITY METER WITH WARNING SYSTEM
A REVIEW PAPER ON AIR QUALITY METER WITH WARNING SYSTEM
 
The Role of Technology in Monitoring and Predicting Pollen and Air Quality Le...
The Role of Technology in Monitoring and Predicting Pollen and Air Quality Le...The Role of Technology in Monitoring and Predicting Pollen and Air Quality Le...
The Role of Technology in Monitoring and Predicting Pollen and Air Quality Le...
 
Ampio Pollution Control Drone
Ampio Pollution Control DroneAmpio Pollution Control Drone
Ampio Pollution Control Drone
 
End-to-end Urban Street Air Quality Management Framework: A Conceptual Design
End-to-end Urban Street Air Quality Management Framework: A Conceptual DesignEnd-to-end Urban Street Air Quality Management Framework: A Conceptual Design
End-to-end Urban Street Air Quality Management Framework: A Conceptual Design
 
IOT ENABLED EMBEDDED BASED REAL TIME AIR QUALITY MONITORING SYSTEM
IOT ENABLED EMBEDDED BASED REAL TIME AIR QUALITY MONITORING SYSTEMIOT ENABLED EMBEDDED BASED REAL TIME AIR QUALITY MONITORING SYSTEM
IOT ENABLED EMBEDDED BASED REAL TIME AIR QUALITY MONITORING SYSTEM
 
54 june2020
54 june202054 june2020
54 june2020
 
Air quality forecasting
Air quality forecastingAir quality forecasting
Air quality forecasting
 
Group-8-Summary
Group-8-SummaryGroup-8-Summary
Group-8-Summary
 
IRJET- Evaluation of Traffic Congestion using Comparative Land use Pattern-A ...
IRJET- Evaluation of Traffic Congestion using Comparative Land use Pattern-A ...IRJET- Evaluation of Traffic Congestion using Comparative Land use Pattern-A ...
IRJET- Evaluation of Traffic Congestion using Comparative Land use Pattern-A ...
 
IRJET- Air Quality and Dust Level Monitoring using IoT
IRJET-  	  Air Quality and Dust Level Monitoring using IoTIRJET-  	  Air Quality and Dust Level Monitoring using IoT
IRJET- Air Quality and Dust Level Monitoring using IoT
 
IRJET- Projecting Climate Impacts on Transportation by Diagnosing and Exa...
IRJET-  	  Projecting Climate Impacts on Transportation by Diagnosing and Exa...IRJET-  	  Projecting Climate Impacts on Transportation by Diagnosing and Exa...
IRJET- Projecting Climate Impacts on Transportation by Diagnosing and Exa...
 
Developing Insights Between Urban Air Quality and Public Health Through the E...
Developing Insights Between Urban Air Quality and Public Health Through the E...Developing Insights Between Urban Air Quality and Public Health Through the E...
Developing Insights Between Urban Air Quality and Public Health Through the E...
 
SMART CONTROL OF TRAFFIC LIGHT USING ARTIFICIAL INTELLIGENCE
SMART CONTROL OF TRAFFIC LIGHT USING ARTIFICIAL INTELLIGENCESMART CONTROL OF TRAFFIC LIGHT USING ARTIFICIAL INTELLIGENCE
SMART CONTROL OF TRAFFIC LIGHT USING ARTIFICIAL INTELLIGENCE
 
Ijmer 46044245
Ijmer 46044245Ijmer 46044245
Ijmer 46044245
 
22.02, Group 4 — Concept of sustainable development in built environment
22.02, Group 4 — Concept of sustainable development in built environment22.02, Group 4 — Concept of sustainable development in built environment
22.02, Group 4 — Concept of sustainable development in built environment
 
Ambient air quality monitor - Polludrone
Ambient air quality monitor - PolludroneAmbient air quality monitor - Polludrone
Ambient air quality monitor - Polludrone
 
FUTURE OF SMART CITIES.pdf
FUTURE OF SMART CITIES.pdfFUTURE OF SMART CITIES.pdf
FUTURE OF SMART CITIES.pdf
 
IRJET- Technical Paper on Use of Smart Urban Simulation Software –‘Citysi...
IRJET-  	  Technical Paper on Use of Smart Urban Simulation Software –‘Citysi...IRJET-  	  Technical Paper on Use of Smart Urban Simulation Software –‘Citysi...
IRJET- Technical Paper on Use of Smart Urban Simulation Software –‘Citysi...
 

More from Oizom

More from Oizom (20)

Albawani Construction Site Case Study.pptx.pdf
Albawani Construction Site Case Study.pptx.pdfAlbawani Construction Site Case Study.pptx.pdf
Albawani Construction Site Case Study.pptx.pdf
 
Godrej < > Oizom Industry monitoring case study
Godrej < > Oizom Industry monitoring case studyGodrej < > Oizom Industry monitoring case study
Godrej < > Oizom Industry monitoring case study
 
Hazira < > Oizom powerplant monitoring Case Study.pdf
Hazira < > Oizom powerplant monitoring Case Study.pdfHazira < > Oizom powerplant monitoring Case Study.pdf
Hazira < > Oizom powerplant monitoring Case Study.pdf
 
Riyadh < > Oizom, Construction Site Monitoring Case Study
Riyadh < > Oizom, Construction Site Monitoring Case StudyRiyadh < > Oizom, Construction Site Monitoring Case Study
Riyadh < > Oizom, Construction Site Monitoring Case Study
 
Cambrian Engineering < > Oizom Case Study
Cambrian Engineering < > Oizom Case StudyCambrian Engineering < > Oizom Case Study
Cambrian Engineering < > Oizom Case Study
 
Human health risks due to rising air pollution.pptx
Human health risks due to rising air pollution.pptxHuman health risks due to rising air pollution.pptx
Human health risks due to rising air pollution.pptx
 
Importance of Air Quality monitoring in Mountains.pptx
Importance of Air Quality monitoring in Mountains.pptxImportance of Air Quality monitoring in Mountains.pptx
Importance of Air Quality monitoring in Mountains.pptx
 
How does Air Quality Sensor Calibration improve data accuracy?
How does Air Quality Sensor Calibration improve data accuracy?How does Air Quality Sensor Calibration improve data accuracy?
How does Air Quality Sensor Calibration improve data accuracy?
 
A guide to effective selection of Air Quality Monitors
A guide to effective selection of Air Quality MonitorsA guide to effective selection of Air Quality Monitors
A guide to effective selection of Air Quality Monitors
 
Is rising air pollution an irrevocable threat to the environment
Is rising air pollution an irrevocable threat to the environmentIs rising air pollution an irrevocable threat to the environment
Is rising air pollution an irrevocable threat to the environment
 
User experience for ambient air quality monitoring.pptx
User experience for ambient air quality monitoring.pptxUser experience for ambient air quality monitoring.pptx
User experience for ambient air quality monitoring.pptx
 
Is the accuracy of low-cost air quality monitoring systems a valid concern
Is the accuracy of low-cost air quality monitoring systems a valid concernIs the accuracy of low-cost air quality monitoring systems a valid concern
Is the accuracy of low-cost air quality monitoring systems a valid concern
 
Ambient Air Quality and COVID-19
 Ambient Air Quality and COVID-19 Ambient Air Quality and COVID-19
Ambient Air Quality and COVID-19
 
Economic Burden of Air Pollution
Economic Burden of Air PollutionEconomic Burden of Air Pollution
Economic Burden of Air Pollution
 
Effects of wildfires on Ambient Air Quality.pptx
Effects of wildfires on Ambient Air Quality.pptxEffects of wildfires on Ambient Air Quality.pptx
Effects of wildfires on Ambient Air Quality.pptx
 
WHO on Air Quality and the Role of Air Quality Monitors
WHO on Air Quality and the Role of Air Quality MonitorsWHO on Air Quality and the Role of Air Quality Monitors
WHO on Air Quality and the Role of Air Quality Monitors
 
Significance of low-cost air quality monitors in NCAP
Significance of low-cost air quality monitors in NCAPSignificance of low-cost air quality monitors in NCAP
Significance of low-cost air quality monitors in NCAP
 
Dust Monitoring at Mines and Quarries
Dust Monitoring at Mines and QuarriesDust Monitoring at Mines and Quarries
Dust Monitoring at Mines and Quarries
 
Environmental Solution for Odour Diffusion from Wastewater Treatment Plants
Environmental Solution for Odour Diffusion from Wastewater Treatment PlantsEnvironmental Solution for Odour Diffusion from Wastewater Treatment Plants
Environmental Solution for Odour Diffusion from Wastewater Treatment Plants
 
Weathercom - Automatic Weather Station
Weathercom - Automatic Weather StationWeathercom - Automatic Weather Station
Weathercom - Automatic Weather Station
 

Recently uploaded

VIP Call Girls Valsad 7001035870 Whatsapp Number, 24/07 Booking
VIP Call Girls Valsad 7001035870 Whatsapp Number, 24/07 BookingVIP Call Girls Valsad 7001035870 Whatsapp Number, 24/07 Booking
VIP Call Girls Valsad 7001035870 Whatsapp Number, 24/07 Booking
dharasingh5698
 
Call Now ☎️🔝 9332606886 🔝 Call Girls ❤ Service In Muzaffarpur Female Escorts ...
Call Now ☎️🔝 9332606886 🔝 Call Girls ❤ Service In Muzaffarpur Female Escorts ...Call Now ☎️🔝 9332606886 🔝 Call Girls ❤ Service In Muzaffarpur Female Escorts ...
Call Now ☎️🔝 9332606886 🔝 Call Girls ❤ Service In Muzaffarpur Female Escorts ...
Anamikakaur10
 

Recently uploaded (20)

Climate Change
Climate ChangeClimate Change
Climate Change
 
Call Girls Budhwar Peth Call Me 7737669865 Budget Friendly No Advance Booking
Call Girls Budhwar Peth Call Me 7737669865 Budget Friendly No Advance BookingCall Girls Budhwar Peth Call Me 7737669865 Budget Friendly No Advance Booking
Call Girls Budhwar Peth Call Me 7737669865 Budget Friendly No Advance Booking
 
VIP Call Girls Valsad 7001035870 Whatsapp Number, 24/07 Booking
VIP Call Girls Valsad 7001035870 Whatsapp Number, 24/07 BookingVIP Call Girls Valsad 7001035870 Whatsapp Number, 24/07 Booking
VIP Call Girls Valsad 7001035870 Whatsapp Number, 24/07 Booking
 
RA 7942:vThe Philippine Mining Act of 1995
RA 7942:vThe Philippine Mining Act of 1995RA 7942:vThe Philippine Mining Act of 1995
RA 7942:vThe Philippine Mining Act of 1995
 
Cyclone Case Study Odisha 1999 Super Cyclone in India.
Cyclone Case Study Odisha 1999 Super Cyclone in India.Cyclone Case Study Odisha 1999 Super Cyclone in India.
Cyclone Case Study Odisha 1999 Super Cyclone in India.
 
Call Now ☎️🔝 9332606886 🔝 Call Girls ❤ Service In Muzaffarpur Female Escorts ...
Call Now ☎️🔝 9332606886 🔝 Call Girls ❤ Service In Muzaffarpur Female Escorts ...Call Now ☎️🔝 9332606886 🔝 Call Girls ❤ Service In Muzaffarpur Female Escorts ...
Call Now ☎️🔝 9332606886 🔝 Call Girls ❤ Service In Muzaffarpur Female Escorts ...
 
Green Marketing
Green MarketingGreen Marketing
Green Marketing
 
Plastic Bank Beyond EPR - Sustainability Programs
Plastic Bank Beyond EPR - Sustainability ProgramsPlastic Bank Beyond EPR - Sustainability Programs
Plastic Bank Beyond EPR - Sustainability Programs
 
Presentation: Farmer-led climate adaptation - Project launch and overview by ...
Presentation: Farmer-led climate adaptation - Project launch and overview by ...Presentation: Farmer-led climate adaptation - Project launch and overview by ...
Presentation: Farmer-led climate adaptation - Project launch and overview by ...
 
(NEHA) Call Girls Navi Mumbai Call Now 8250077686 Navi Mumbai Escorts 24x7
(NEHA) Call Girls Navi Mumbai Call Now 8250077686 Navi Mumbai Escorts 24x7(NEHA) Call Girls Navi Mumbai Call Now 8250077686 Navi Mumbai Escorts 24x7
(NEHA) Call Girls Navi Mumbai Call Now 8250077686 Navi Mumbai Escorts 24x7
 
Call Girls Jejuri Call Me 7737669865 Budget Friendly No Advance Booking
Call Girls Jejuri Call Me 7737669865 Budget Friendly No Advance BookingCall Girls Jejuri Call Me 7737669865 Budget Friendly No Advance Booking
Call Girls Jejuri Call Me 7737669865 Budget Friendly No Advance Booking
 
Verified Trusted Kalyani Nagar Call Girls 8005736733 𝐈𝐍𝐃𝐄𝐏𝐄𝐍𝐃𝐄𝐍𝐓 Call 𝐆𝐈𝐑𝐋 𝐕...
Verified Trusted Kalyani Nagar Call Girls  8005736733 𝐈𝐍𝐃𝐄𝐏𝐄𝐍𝐃𝐄𝐍𝐓 Call 𝐆𝐈𝐑𝐋 𝐕...Verified Trusted Kalyani Nagar Call Girls  8005736733 𝐈𝐍𝐃𝐄𝐏𝐄𝐍𝐃𝐄𝐍𝐓 Call 𝐆𝐈𝐑𝐋 𝐕...
Verified Trusted Kalyani Nagar Call Girls 8005736733 𝐈𝐍𝐃𝐄𝐏𝐄𝐍𝐃𝐄𝐍𝐓 Call 𝐆𝐈𝐑𝐋 𝐕...
 
GENUINE Babe,Call Girls IN Chhatarpur Delhi | +91-8377877756
GENUINE Babe,Call Girls IN Chhatarpur Delhi | +91-8377877756GENUINE Babe,Call Girls IN Chhatarpur Delhi | +91-8377877756
GENUINE Babe,Call Girls IN Chhatarpur Delhi | +91-8377877756
 
Proposed Amendments to Chapter 15, Article X: Wetland Conservation Areas
Proposed Amendments to Chapter 15, Article X: Wetland Conservation AreasProposed Amendments to Chapter 15, Article X: Wetland Conservation Areas
Proposed Amendments to Chapter 15, Article X: Wetland Conservation Areas
 
Introduction to heat waves and Heatwaves in Bangladesh.pptx
Introduction to heat waves and Heatwaves in Bangladesh.pptxIntroduction to heat waves and Heatwaves in Bangladesh.pptx
Introduction to heat waves and Heatwaves in Bangladesh.pptx
 
VIP Model Call Girls Chakan ( Pune ) Call ON 8005736733 Starting From 5K to 2...
VIP Model Call Girls Chakan ( Pune ) Call ON 8005736733 Starting From 5K to 2...VIP Model Call Girls Chakan ( Pune ) Call ON 8005736733 Starting From 5K to 2...
VIP Model Call Girls Chakan ( Pune ) Call ON 8005736733 Starting From 5K to 2...
 
Presentation: Farmer-led climate adaptation - Project launch and overview by ...
Presentation: Farmer-led climate adaptation - Project launch and overview by ...Presentation: Farmer-led climate adaptation - Project launch and overview by ...
Presentation: Farmer-led climate adaptation - Project launch and overview by ...
 
VIP Model Call Girls Charholi Budruk ( Pune ) Call ON 8005736733 Starting Fro...
VIP Model Call Girls Charholi Budruk ( Pune ) Call ON 8005736733 Starting Fro...VIP Model Call Girls Charholi Budruk ( Pune ) Call ON 8005736733 Starting Fro...
VIP Model Call Girls Charholi Budruk ( Pune ) Call ON 8005736733 Starting Fro...
 
Enhancing forest data transparency for climate action
Enhancing forest data transparency for climate actionEnhancing forest data transparency for climate action
Enhancing forest data transparency for climate action
 
(INDIRA) Call Girl Katra Call Now 8617697112 Katra Escorts 24x7
(INDIRA) Call Girl Katra Call Now 8617697112 Katra Escorts 24x7(INDIRA) Call Girl Katra Call Now 8617697112 Katra Escorts 24x7
(INDIRA) Call Girl Katra Call Now 8617697112 Katra Escorts 24x7
 

Real time pollution maps with air quality software for smart cities

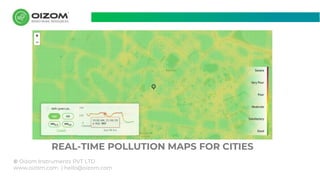
  • 1. © Oizom Instruments PVT LTD www.oizom.com | hello@oizom.com REAL-TIME POLLUTION MAPS FOR CITIES
  • 2. The distribution of air pollution concentration over a large urban area predominantly depends on local emission sources and atmospheric flow conditions. However, urban areas are the centres of various activities having multiple and diverse pollutant sources emitting all kinds of air pollutants. In order to maintain a healthy air environment, it is important to ensure availability of fine resolution air quality data and ability to visualize it at a neighbourhood scale. The traditional approach of monitoring air quality at a few selected locations cannot provide such an accurate representation of total urban air quality. This gap can be bridged by deploying multiple low-cost sensor-based systems, which are compact and can be installed virtually anywhere. According to the World Urbanization Prospects report released by the United Nations, 54% of the total world population currently lives in urban areas and this number will reach 66% by 2050. “ ” INTRODUCTION Real-time pollution maps for cities © Oizom Instruments PVT LTD www.oizom.com | hello@oizom.com
  • 3. Maps are a convenient way to represent such phenomena that need to be understood on a geographical scale. Pollution maps represent the intensity of pollutants in a static or time-varying way using animated visualization in such a manner that is intuitively interpretable. Real-time mapping of air quality provides great insights about spatio-temporal variation of air quality, which resultantly provides opportunity to take informed decisions and actions. MAPPING AIR POLLUTION Real-time pollution maps for cities © Oizom Instruments PVT LTD www.oizom.com | hello@oizom.com
  • 4. Accurate and dynamic representation of pollution extent and distribution can be developed by feeding ambient air quality data into an air quality model. Output maps of these models report real-time air quality through an interactive map. Owing to their capability of incorporating secondary data such as traffic data, meteorological data, terrain information, local built-environment, etc. in real-time, they are also known as dynamic maps. Traffic Layer Meteorology Layer Air-quality Layer REAL-TIME POLLUTION MAPPING Real-time pollution maps for cities © Oizom Instruments PVT LTD www.oizom.com | hello@oizom.com
  • 5. An exhaustive ambient air quality monitoring network is required to generate sufficient input data for the models to generate accurate pollution maps. General guideline for establishing network is to deploy one monitoring device for every 10-20 km2 of area. However, for hyperlocal real-time ambient air quality monitoring, a network having one monitoring device for every 4 km2 is recommended. REAL-TIME POLLUTION MAPPING Real-time pollution maps for cities © Oizom Instruments PVT LTD www.oizom.com | hello@oizom.com
  • 6. Conventional monitoring stations are too expensive to deploy at such spatial density. Sensor based monitors are economical and are capable of providing required spatially dense representation in real-time. Dynamic air pollution maps with the spatial resolution as good as 100 x 100 m can be generated and updated constantly on an hourly or bihourly basis. The software can also be programmed to update maps automatically every time when pollutant concentration changes for say, 5-10%. REAL-TIME POLLUTION MAPPING Real-time pollution maps for cities © Oizom Instruments PVT LTD www.oizom.com | hello@oizom.com
  • 7. The purpose of the mapping air pollution data is to provide easily interpretable information to the user. For general purposes, the most common type of heatmap is based on the AQI. However, based on the purpose of monitoring, different layers can be added to the base map. As meteorological data is recorded at the monitoring sites, a layer of temperature, rainfall, wind speed, wind direction, and relative humidity can be added. Additional analyses such as anomalies, indices, standard deviation, etc can also be calculated and represented as a heat map to understand the spatiotemporal trends of air quality. DATA PRESENTATION Real-time pollution maps for cities © Oizom Instruments PVT LTD www.oizom.com | hello@oizom.com
  • 8. The most simplistic and elegant definition of a smart-city can be, “The integration of technology into a strategic approach to sustainability, citizen well- being and economic development.” Intelligent traffic system and smart transportation Smart environmental management Smart utility supply E-governance and citizen charter Public safety MONITORING FOR SMART CITIES Real-time pollution maps for cities © Oizom Instruments PVT LTD www.oizom.com | hello@oizom.com
  • 9. OIZOM provides a platform to measure real-time air quality and integrate it with smart-city dashboards. These systems measure air pollution in real-time and develop a holistic picture of pollution distribution by also incorporating multiple datasets such as traffic flow. OIZOM provides their customers API to enable cross-platform integration to third-party statistical softwares, GIS and mapping services such as Google Earth, Google Maps, ArcGIS, ESRI Dashboard, QGIS, Here, TomTom, Mapbox, etc. OIZOM offers comprehensive and scalable solutions for real-time environmental monitoring and analytics. The data generated are integration-friendly for various cross-platform applications, bringing together multiple stakeholders to provide data-driven solutions for smart-cities. OIZOM’S OFFERING Real-time pollution maps for cities © Oizom Instruments PVT LTD www.oizom.com | hello@oizom.com