
Recommended
Recommended
More Related Content
Similar to Reading graphs review 3
Similar to Reading graphs review 3 (20)
More from adordollz
Recently uploaded
Recently uploaded (20)
Reading graphs review 3
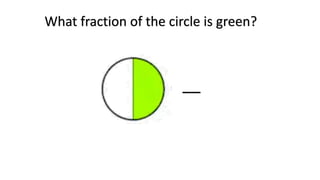
- 1. __ What fraction of the circle is green?
- 2. __1/2 What fraction of the circle is green?
- 3. __ What fraction of the pie is green?
- 4. __1/4 What fraction of the pie is green?
- 5. What percent % of the circle is blue?
- 6. What percent % of the circle is blue?
- 7. ___% What percent % of the circle is blue?
- 8. ___% What percent % of the circle is blue?
- 9. Types of transportation used by students to get to school a) What percent of the students come to school by bicycle?
- 10. Types of transportation used by students to get to school a) What percent of the students come to school by bicycle? 45%
- 11. Types of transportation used by students to get to school b) What percent of students do not walk to school?
- 12. Types of transportation used by students to get to school b) What percent of students do not walk to school? 85% Do not walk 100% - 15% = walk
- 13. True or False More people use Firefox than Internet Explorer
- 14. True or False More people use Firefox than Internet Explorer
- 15. True or False Chrome is the most popular browser
- 16. True or False Chrome is the most popular browser
- 17. True or False Safari is used by less than 10% of the people
- 18. True or False Safari is used by less than 10% of the people
- 19. .
- 20. .
- 21. .
- 22. .
- 23. What is the title of the graph?
- 24. Title of graph What is the title of the graph? School supplies students use.
- 25. What is the range of values on the Y-axis?
- 26. What is the range of values on the Y-axis? 0-10
- 27. How many categories are on the graph?
- 28. How many categories are on the graph? 5
- 29. Which school supply was used the most?
- 30. Which school supply was used the most? pencils
- 31. Which school supply was used the least?
- 32. Which school supply was used the least? pens
- 33. How many pens and pencils were used by students?
- 34. How many pens and pencils were used by students? 2 + 8 = 10
- 35. Students were asked to vote on their favorite after-school activity. The most popular favorite activity was ___________. The second most popular activity was ________________. The least popular activity was ___________
- 36. Students were asked to vote on their favorite after-school activity. The most popular favorite activity was ___________. The second most popular activity was ________________. The least popular activity was ___________ visiting with Friends
- 37. Students were asked to vote on their favorite after-school activity. The most popular favorite activity was ___________. The second most popular activity was ________________. The least popular activity was ___________ visiting with Friends chatting online
- 38. Students were asked to vote on their favorite after-school activity. The most popular favorite activity was ___________. The second most popular activity was ________________. The least popular activity was ___________ visiting with Friends chatting online school clubs