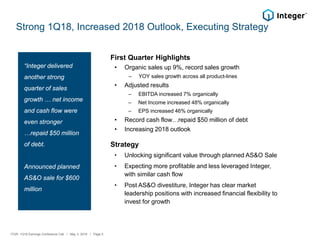
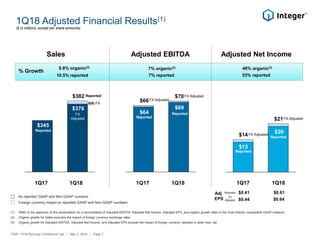
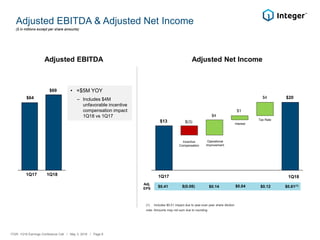
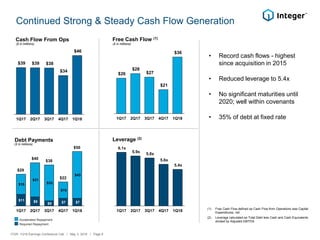
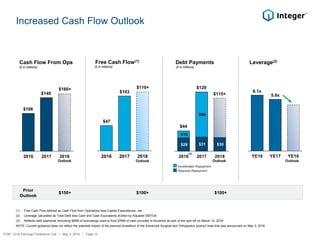
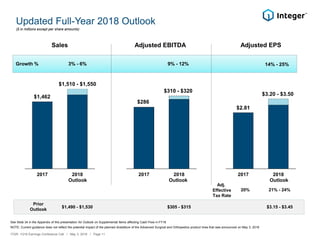
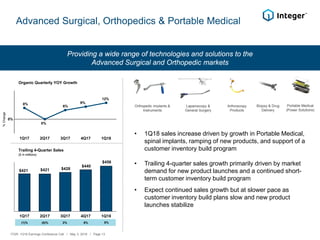
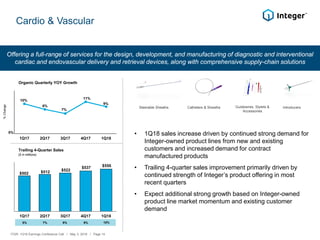
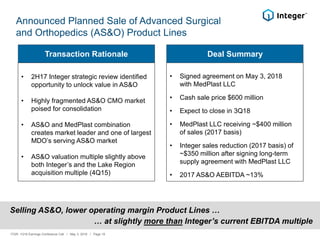
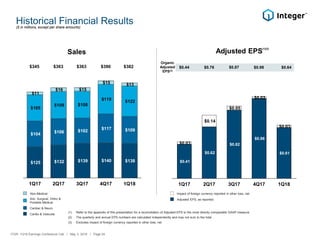
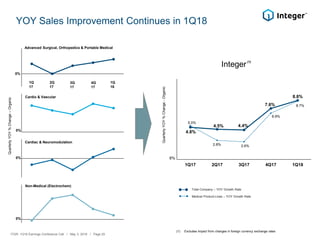
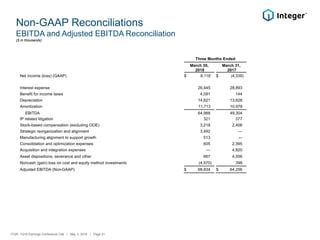
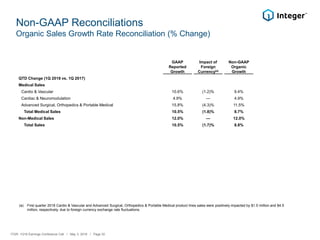
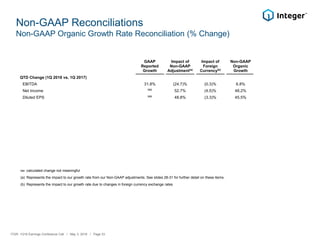
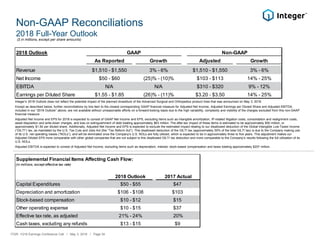
2. Presentation of Financial Information &
Forward-Looking Statements
Historical financial and operating data in this presentation reflect the consolidated results of Integer for the periods
indicated.
This presentation includes financial information prepared in accordance with accounting principles generally accepted in
the United States, or GAAP, as well as other financial measures referred to as non-GAAP. The non-GAAP financial
measures in this presentation, which include Adjusted Net Income, Adjusted Diluted EPS, Earnings Before Interest Taxes
Depreciation and Amortization (EBITDA), Adjusted EBITDA, and organic growth rates should be considered in addition to,
but not as substitutes for, the information prepared in accordance with GAAP. For reconciliations of these non-GAAP
financial measures to the most comparable GAAP measures, please refer to the appendix to this presentation and the
earnings release associated with this quarterly period which can be found in the investor relations section of our corporate
website (investor.integer.net).
Statements made in this presentation whether written or oral may be âforward-looking statementsâ within the meaning of
Section 27A of the Securities Act of 1933, as amended, and Section 21E of Securities Exchange Act of 1934, as
amended, and involve a number of risks and uncertainties. These statements can be identified by terminology such as
âmay,â âwill,â âshould,â âcould,â âexpects,â âintends,â âplans,â âanticipates,â âbelieves,â âestimates,â âpredicts,â âpotentialâ or
âcontinueâ or âvariationsâ or the negative of these terms or other comparable terminology. These statements are based on
the companyâs current expectations and speak only as of May 3, 2018. The Companyâs actual results could differ
materially from those stated or implied by such forward-looking statements. The Company assumes no obligation to
update forward-looking information, including information in this presentation, to reflect changed assumptions, the
occurrence of unanticipated events or changes in future operating results, financial conditions or prospects.
ITGR: 1Q18 Earnings Conference Call / May 3, 2018 / Page 2
5. Strong 1Q18, Increased 2018 Outlook, Executing Strategy
âInteger delivered
another strong
quarter of sales
growth ⌠net income
and cash flow were
even stronger
âŚrepaid $50 million
of debt.
Announced planned
AS&O sale for $600
million
First Quarter Highlights
⢠Organic sales up 9%, record sales growth
â YOY sales growth across all product-lines
⢠Adjusted results
â EBITDA increased 7% organically
â Net Income increased 48% organically
â EPS increased 46% organically
⢠Record cash flowâŚrepaid $50 million of debt
⢠Increasing 2018 outlook
Strategy
⢠Unlocking significant value through planned AS&O Sale
⢠Expecting more profitable and less leveraged Integer,
with similar cash flow
⢠Post AS&O divestiture, Integer has clear market
leadership positions with increased financial flexibility to
invest for growth
ITGR: 1Q18 Earnings Conference Call / May 3, 2018 / Page 5
7. 1Q18 Adjusted Financial Results(1)
$64
$69
(1) Refer to the appendix of this presentation for a reconciliation of Adjusted EBITDA, Adjusted Net Income, Adjusted EPS, and organic growth rates to the most directly comparable GAAP measure
(2) Organic growth for Sales excludes the impact of foreign currency exchange rates
(3) Organic growth for Adjusted EBITDA, Adjusted Net Income, and Adjusted EPS exclude the impact of foreign currency reported in other loss, net
$13
$20
$345
$376
($ in millions, except per share amounts)
Sales Adjusted EBITDA Adjusted Net Income
1Q17 1Q18 1Q17 1Q181Q17 1Q18
8.8% organic(2)
$21
% Growth
10.5% reported
7% organic(3)
7% reported
48% organic(3)
53% reported
$382 $70
Foreign currency impact on reported GAAP and Non-GAAP numbers
As reported GAAP and Non-GAAP numbers
Reported
Reported
Reported
Reported
FX Adjusted
FX Adjusted
$(6) FX
Adj
EPS
$0.41 $0.61Reported
$0.64
FX
Adjusted $0.44
ITGR: 1Q18 Earnings Conference Call / May 3, 2018 / Page 7
$66
Reported
$14
Reported
FX
Adjusted
FX Adjusted
FX Adjusted
Reported
8. Adjusted EBITDA & Adjusted Net Income
(1) Includes $0.01 impact due to year-over-year share dilution
note: Amounts may not sum due to rounding
Adjusted EBITDA
($ in millions except per share amounts)
Adjusted Net Income
$13 $(3)
$4
$20
1Q17 1Q18
Incentive
Compensation
Interest
1Q17 1Q18
$64
$69
ITGR: 1Q18 Earnings Conference Call / May 3, 2018 / Page 8
⢠+$5M YOY
â Includes $4M
unfavorable incentive
compensation impact
1Q18 vs 1Q17
Operational
Improvement
$1
$4
Tax Rate
$0.41
Adj.
EPS
$(0.08) $0.14 $0.04 $0.61(1)$0.12
9. $11 $8
$5 $7 $7
$19
$31
$33
$15
$43
1Q17 2Q17 3Q17 4Q17 1Q18
Continued Strong & Steady Cash Flow Generation
Cash Flow From Ops
Debt Payments
($ in millions)
(1) Free Cash Flow defined as Cash Flow from Operations less Capital
Expenditures, net
(2) Leverage calculated as Total Debt less Cash and Cash Equivalents
divided by Adjusted EBITDA
($ in millions)
Free Cash Flow (1)
($ in millions)
Accelerated Repayment
Required Repayment
⢠Record cash flows - highest
since acquisition in 2015
⢠Reduced leverage to 5.4x
⢠No significant maturities until
2020; well within covenants
⢠35% of debt at fixed rate
ITGR: 1Q18 Earnings Conference Call / May 3, 2018 / Page 9
$39 $39 $38
$34
$46
1Q17 2Q17 3Q17 4Q17 1Q18
$26
$28
$27
$21
$36
1Q17 2Q17 3Q17 4Q17 1Q18
$50
$22
$29
$40
$38
6.1x
5.9x
5.8x
5.6x
5.4x
1Q17 2Q17 3Q17 4Q17 1Q18
Leverage (2)
10. $29 $31 $30
$15
$98
2016 2017 20182016 2017 20182016 2017 2018
Increased Cash Flow Outlook
ITGR: 1Q18 Earnings Conference Call / May 3, 2018 / Page 10
Cash Flow From Ops Debt Payments
($ in millions)
(1) Free Cash Flow defined as Cash Flow from Operations less Capital Expenditures, net
(2) Leverage calculated as Total Debt less Cash and Cash Equivalents divided by Adjusted EBITDA
(3) Reflects debt payments excluding $55M of borrowings used to fund $76M of cash provided to Nuvectra as part of the spin-off on March 14, 2016.
NOTE: Current guidance does not reflect the potential impact of the planned divestiture of the Advanced Surgical and Orthopedics product lines that was announced on May 3, 2018
($ in millions)
Free Cash Flow(1)
($ in millions)
$129
Accelerated Repayment
Required Repayment
$115+
$47
$103
$110+
OutlookOutlook
$106
$149
$160+
Outlook
Leverage(2)
6.1x
5.6x
$44
(3)
$150+ $100+ $100+
Prior
Outlook
YE16 YE17 YE18
Outlook
11. 2017 2018 2017 20182017 2018
Updated Full-Year 2018 Outlook
Adjusted EPS
$1,462
$2.81
$1,510 - $1,550
$3.20 - $3.50
Outlook
($ in millions except per share amounts)
Growth % 3% - 6% 14% - 25%
Outlook
ITGR: 1Q18 Earnings Conference Call / May 3, 2018 / Page 11
Sales
Outlook
$286
$310 - $320
9% - 12%
Adjusted EBITDA
See Slide 34 in the Appendix of this presentation for Outlook on Supplemental Items affecting Cash Flow in FY18
NOTE: Current guidance does not reflect the potential impact of the planned divestiture of the Advanced Surgical and Orthopedics product lines that was announced on May 3, 2018
Adj.
Effective
Tax Rate
20% 21% - 24%
Prior
Outlook
$1,490 - $1,530 $305 - $315 $3.15 - $3.45
13. 8%
0%
6%
9%
12%
1Q17 2Q17 3Q17 4Q17 1Q18
Advanced Surgical, Orthopedics & Portable Medical
Providing a wide range of technologies and solutions to the
Advanced Surgical and Orthopedic markets
Organic Quarterly YOY Growth
0%
%Change
Orthopedic Implants &
Instruments
Biopsy & Drug
Delivery
Portable Medical
(Power Solutions)
Laparoscopy &
General Surgery
Arthroscopy
Products
⢠1Q18 sales increase driven by growth in Portable Medical,
spinal implants, ramping of new products, and support of a
customer inventory build program
⢠Trailing 4-quarter sales growth primarily driven by market
demand for new product launches and a continued short-
term customer inventory build program
⢠Expect continued sales growth but at slower pace as
customer inventory build plans slow and new product
launches stabilize
Trailing 4-Quarter Sales
($ in millions)
ITGR: 1Q18 Earnings Conference Call / May 3, 2018 / Page 13
$421 $421 $428
$440
$456
1Q17 2Q17 3Q17 4Q17 1Q18
(1)% (0)% 2% 6% 8%
14. Offering a full-range of services for the design, development, and manufacturing of diagnostic and interventional
cardiac and endovascular delivery and retrieval devices, along with comprehensive supply-chain solutions
Cardio & Vascular
Steerable Sheaths Catheters & Sheaths Guidewires, Stylets &
Accessories
Introducers
Trailing 4-Quarter Sales
0%
%Change
($ in millions)
ITGR: 1Q18 Earnings Conference Call / May 3, 2018 / Page 14
10%
8%
7%
11%
9%
1Q17 2Q17 3Q17 4Q17 1Q18
$502 $512 $522
$537 $550
1Q17 2Q17 3Q17 4Q17 1Q18
5% 7% 9% 9% 10%
⢠1Q18 sales increase driven by continued strong demand for
Integer-owned product lines from new and existing
customers and increased demand for contract
manufactured products
⢠Trailing 4-quarter sales improvement primarily driven by
continued strength of Integerâs product offering in most
recent quarters
⢠Expect additional strong growth based on Integer-owned
product line market momentum and existing customer
demand
Organic Quarterly YOY Growth
15. Providing technology solutions for the active implantable medical device industry
by partnering with customers to bring high-quality products to
established and emerging markets â from initial concept through to high-volume manufacturing
Cardiac & Neuromodulation
Trailing 4-Quarter Sales
0%
%Change
($ in millions)
ITGR: 1Q18 Earnings Conference Call / May 3, 2018 / Page 15
Advanced technology and manufacturing capabilities to support the full
breadth of active implantable device components and assembly
Fully customizable platforms to
accelerate time to market
⢠1Q18 sales increase driven by continued strength and the
resolution of a prior year supply constraint in
Neuromodulation
⢠Trailing 4-quarter sales stable as growth in
Neuromodulation offsets declines in CRM
⢠Expect continued sales growth from strength in
Neuromodulation
(3%)
(1%)
(6%)
1%
5%
1Q17 2Q17 3Q17 4Q17 1Q18
$435 $434 $428 $428 $433
1Q17 2Q17 3Q17 4Q17 1Q18
(5)% (2)% (4)% (2)% 0%
Organic Quarterly YOY Growth
16. Electrochem
Enhancing lives worldwide by providing superior power solutions that
enable the success and advancement of our customersâ critical applications
Battery Packs Battery ChargersBattery Cells
Trailing 4-Quarter Sales
0%
%Change
($ in millions)
ITGR: 1Q18 Earnings Conference Call / May 3, 2018 / Page 16
⢠1Q18 sales growth driven by new business wins in stable
energy market
⢠Trailing 4-quarter improvement primarily driven by energy
market recovery and new business. Growth trend slowing
driven by shift from recovery to stabilization in energy
market
⢠Stable to positive outlook for 2018 as team continues to
deliver growth initiatives
(3%)
60%
71%
30%
12%
1Q17 2Q17 3Q17 4Q17 1Q18
$41
$47
$54
$57 $58
1Q17 2Q17 3Q17 4Q17 1Q18
(23)% 1% 23% 37% 41%
Organic Quarterly YOY Growth
18. Cardio & Vascular
Neuromodulation
Electrochem
Strategy to Drive Long-Term Growth
Invest to Grow
Protect & Preserve
Improve Profitability
Cardiac Rhythm Management
Advanced Surgical
Orthopedics
Portable Medical
Portfolio Strategy
⢠Sales Force Excellence
⢠Market Focused Innovation
Customers
âearn business
dailyâ
Costs
âfuel for
growthâ
Culture
âhow we act,
every
interactionâ
⢠Manufacturing Excellence
⢠Business Process Excellence
⢠Performance Excellence
⢠Leadership Capability
Operational Strategy â
Strategic Imperatives
ITGR: 1Q18 Earnings Conference Call / May 3, 2018 / Page 18
19. Announced Planned Sale of Advanced Surgical
and Orthopedics (AS&O) Product Lines
⢠2H17 Integer strategic review identified
opportunity to unlock value in AS&O
⢠Highly fragmented AS&O CMO market
poised for consolidation
⢠AS&O and MedPlast combination
creates market leader and one of largest
MDOâs serving AS&O market
⢠AS&O valuation multiple slightly above
both Integerâs and the Lake Region
acquisition multiple (4Q15)
⢠Signed agreement on May 3, 2018
with MedPlast LLC
⢠Cash sale price $600 million
⢠Expect to close in 3Q18
⢠MedPlast LLC receiving ~$400 million
of sales (2017 basis)
⢠Integer sales reduction (2017 basis) of
~$350 million after signing long-term
supply agreement with MedPlast LLC
⢠2017 AS&O AEBITDA ~13%
Transaction Rationale Deal Summary
Selling AS&O, lower operating margin Product Lines âŚ
⌠at slightly more than Integerâs current EBITDA multiple
ITGR: 1Q18 Earnings Conference Call / May 3, 2018 / Page 19
20. Impact of AS&O Sale on Integer
⢠Clear leader in remaining product lines
with differentiated technology
⢠Cardio & Vascular, Cardiac &
Neuromodulation, Electrochem
⢠Creates financial flexibility to invest
more aggressively in faster growing
markets where Integer is differentiated
⢠Post divestiture customer overlap limited
to a few major customers
⢠Integer valuation metrics improved
⢠Margin expansion of ~200bps to 250bps
⢠After planned debt reduction of ~$550
million, expect:
⢠EPS accretion
⢠Debt leverage less than 4x
⢠Free cash flow similar to pre-divestiture
⢠Increased ROIC
Strategic Financial Impact
Positioning Integer to Earn a Valuation Premium
ITGR: 1Q18 Earnings Conference Call / May 3, 2018 / Page 20
21. Summary
ITGR: 1Q18 Earnings Conference Call / May 3, 2018 / Page 21
First Quarter 2018
⢠Strong growth in sales, profit and cash flow
⢠Increased 2018 outlook
Portfolio Strategy
⢠Unlocking significant value through planned
AS&O Sale
⢠Expecting more profitable and less leveraged
Integer, with similar cash flow
⢠Post AS&O divestiture, Integer has clear market
leadership positions with increased financial
flexibility to invest for growth
Vision
Enhance patientâs lives by being our
customers partner of choice
Strategic Imperatives
- Sales Force Excellence
- Market Focused Innovation
- Manufacturing Excellence
- Business Process Excellence
- Performance Excellence
- Leadership Capability
Clear Goals
- Sales Growth Above Market
- Profit Growth 2x Sales Growth
- Earn a Valuation Premium
24. $0.41
$0.62
$0.82
$0.96
$0.61
$0.03
$0.14
$0.05
$0.02
$0.03
1Q17 2Q17 3Q17 4Q17 1Q18
$125 $132 $139 $140 $138
$104 $106 $102
$117 $109
$105
$109 $108
$119 $122
$11
$16 $15
$15 $13
1Q17 2Q17 3Q17 4Q17 1Q18
Historical Financial Results
Sales Adjusted EPS
Non-Medical
Cardiac & Neuro
Cardio & Vascular
Adv. Surgical, Ortho &
Portable Medical
(1) Refer to the appendix of this presentation for a reconciliation of Adjusted EPS to the most directly comparable GAAP measure
(2) The quarterly and annual EPS numbers are calculated independently and may not sum to the total
(3) Excludes impact of foreign currency reported in other loss, net
($ in millions, except per share amounts)
Impact of foreign currency reported in other loss, net
Adjusted EPS, as reported
Organic
Adjusted
EPS(3)
ITGR: 1Q18 Earnings Conference Call / May 3, 2018 / Page 24
(1)(2)
$363$345 $390$363 $382 $0.76$0.44 $0.87 $0.98 $0.64
26. Working Capital
Working Capital
($ in millions)
(1) Inventory Turns calculated as âCOGS divided by quarterly Average Inventory multiplied by â4â to reach an annualized number
ITGR: 1Q18 Earnings Conference Call / May 3, 2018 / Page 26
($ in millions)
$324 $328 $323 $323
$304
1Q17 2Q17 3Q17 4Q17 1Q18
Inventory $231 $236 $247 $228 $239
Inventory Turns
(1)
4.5 4.5 4.4 4.8 4.9
Capital Expenditures $12 $10 $12 $13 $10
27. Other Operating Expenses â Historical
($ in millions)
ITGR: 1Q18 Earnings Conference Call / May 3, 2018 / Page 27
YTD Three Mos.
1Q17 2Q17 3Q17 4Q17 FY17 1Q18
Strategic Reorganization
and Alignment
-- -- -- $5.9 $5.9 $3.5
Manufacturing and
Alignment to Support Growth
-- -- -- -- -- $0.5
Consolidation and
Optimization Initiatives
$2.4 $2.8 $3.2 $4.9 $13.3 $0.6
Acquisition and Integeration Costs $4.8 $3.0 $2.2 $0.8 $10.8 --
Asset Dispositions,
Severance, and other
$4.6 $1.1 $0.8 $0.7 $7.2 $0.7
TOTAL OOE $11.8 $6.9 $6.2 $12.3 $37.2 $5.3
Three Months Ended
28. Non-GAAP Reconciliation
Net Income and Diluted EPS Reconciliation â QTD
See the Footnotes to this table on Slide 30 of this presentation
ITGR: 1Q18 Earnings Conference Call / May 3, 2018 / Page 28
($ in thousands, except per share amounts)
Three Months Ended
March 30, 2018 March 31, 2017
Pre-Tax
Net
Income
Per
Diluted
Share Pre-Tax
Net
Income
(Loss)
Per
Diluted
Share
As reported (GAAP) $ 12,209 $ 8,118 $ 0.25 $ (4,195) $ (4,339) $ (0.14)
Adjustments:
Amortization of intangibles(a) 11,713 9,304 0.29 10,978 7,746 0.24
IP related litigation (SG&A)(a)(b) 321 254 0.01 377 245 0.01
Strategic reorganization and alignment (OOE)(a)(c) 3,492 2,779 0.09 â â â
Manufacturing alignment to support growth (OOE)(a)(d) 513 369 0.01 â â â
Consolidation and optimization expenses (OOE)(a)(e) 605 473 0.01 2,395 1,899 0.06
Acquisition and integration expenses (OOE)(a)(f) â â â 4,820 3,133 0.10
Asset dispositions, severance and other (OOE)(a)(g) 667 489 0.02 4,556 2,957 0.09
(Gain) loss on cost and equity method investments, net(a) (4,970) (3,926) (0.12) 398 259 0.01
Loss on extinguishment of debt(a)(h) 1,057 835 0.03 1,559 1,013 0.03
Tax adjustments(i) â 1,021 0.03 â â â
Adjusted (Non-GAAP) $ 25,607 $ 19,716 $ 0.61 $ 20,888 $ 12,913 $ 0.41
Diluted weighted average shares for adjusted EPS(j) 32,423 31,685
29. Non-GAAP Reconciliation
1Q18 QTD Net Income and Diluted EPS Reconciliation â Detailed View
See the Footnotes to this table on Slide 30 of this presentation
ITGR: 1Q18 Earnings Conference Call / May 3, 2018 / Page 29
($ in thousands, except per share amounts)
GAAP Non-GAAP
Income Statement 1Q18 Actual Amortization
Litigation
Related
Charges(b)
Strategic
Reorganization
& Alignment(c)
Manufacturing
Alignment to
Support
Growth(d)
Consolidation &
Optimization(e)
Asset
Disposition,
Severance &
Other(g)
Debt /
Investment
Related
Charges(h)
Tax
Adjustment(i)
1Q18 Adjusted
Sales 381,745$ 381,745$
Cost of sales 285,975 (4,069) 281,906
Gross profit 95,770$ 4,069$ -$ -$ -$ -$ -$ 99,839$
Gross margin 25.1% 26.2%
Operating expenses:
SG&A 41,238 (7,606) (321) 33,311
SG&A as a % of revenues 10.8% 8.7%
Research, development & engineering 14,538 (38) 14,500
RD&E as a % of revenues 3.8% 3.8%
Other operating expense 5,277 (3,492) (513) (605) (667) -
Operating income 34,717$ 11,713$ 321$ 3,492$ 513$ 605$ 667$ -$ -$ 52,028$
Operating margin 9.1% 13.6%
Other (income) & expenses:
Interest expense 26,445 (1,057) 25,388
Other (income) loss, net (3,937) 4,970 1,033
Income before taxes 12,209$ 11,713$ 321$ 3,492$ 513$ 605$ 667$ (3,913)$ 25,607$
Provision for income taxes 4,091 2,409 67 713 144 132 178 (822) (1,021) 5,891
Effective tax rate 33.5% 23.0%
Net income (loss) 8,118$ 9,304$ 254$ 2,779$ 369$ 473$ 489$ (3,091)$ 1,021$ 19,716$
Net margin 2.1% 5.2%
Weighted Average Shares O/S (j)
32,423 32,423 32,423 32,423 32,423 32,423 32,423 32,423 32,423 32,423
EPS 0.25$ 0.29$ 0.01$ 0.09$ 0.01$ 0.01$ 0.02$ (0.10)$ 0.03$ 0.61$
Non-GAAP Adj.(a)
30. ITGR: 1Q18 Earnings Conference Call / May 3, 2018 / Page 30
(a) The difference between pre-tax and net income (loss) amounts is the estimated tax impact related to the respective adjustment. Net income amounts are computed
using a 21% U.S. tax rate (35% U.S. tax rate for 2017 periods), and the statutory tax rates in Mexico, Germany, France, Netherlands, Uruguay, Ireland and
Switzerland, as adjusted for the existence of NOLs. Amortization of intangibles and OOE expense have also been adjusted to reflect the estimated impact relating to
our disallowed deduction of the GILTI tax, as described in note (i) below. Expenses that are not deductible for tax purposes (i.e. permanent tax differences) are
added back at 100%.
(b) In 2013, we filed suit against AVX Corporation alleging they were infringing our intellectual property. Given the complexity and significant costs incurred pursuing this
litigation, we are excluding these litigation expenses from adjusted amounts. This matter proceeded to trial during the first quarter of 2016 and again in the third
quarter of 2017 that resulted in a jury awarding damages in the amount of $37.5 million. In March 2018, the court vacated that damage award and ordered a new
trial on damages, which is scheduled for January 2019. To date, no gains have been recognized in connection with this litigation.
(c) As a result of the strategic review of our customers, competitors and markets we undertook during the fourth quarter of 2017, we began to take steps to better align
our resources in order to invest to grow, protect, preserve and to enhance the profitability of our portfolio of products. This will include focusing our investment in
RD&E and manufacturing, improving our business processes and redirecting investments away from projects where the market does not justify the investment. As a
result, during the first quarter of 2018 we incurred charges related to this strategy, which primarily consisted of severance and fees for professional services.
(d) In 2017, we initiated several initiatives designed to reduce costs, improve operating efficiencies and increase manufacturing capacity to accommodate growth. The
plan involves the relocation of certain manufacturing operations and expansion of certain of our facilities.
(e) During 2018 and 2017, we incurred costs primarily related to the closure of our Clarence, NY facility and the transfer of our Beaverton, OR portable medical and
Plymouth, MN vascular manufacturing operations to Tijuana, Mexico.
(f) Reflects acquisition and integration costs related to the acquisition of Lake Region Medical, which occurred in October 2015.
(g) Amounts for 2017 primarily include expenses related to our CEO and CFO transitions.
(h) Represents debt extinguishment charges in connection with pre-payments made on our Term B Loan Facility which are included in interest expense.
(i) Tax adjustments primarily includes the estimated impact relating to our disallowed deduction of the GILTI tax, as mandated by the Tax Reform Act. This disallowed
deduction of the GILTI tax (approximately 50% of the total GILTI tax) is due to the Company making use of its U.S. NOLs, and will be eliminated once the Companyâs
U.S. NOLs are fully utilized, which is expected to be in approximately three to five years. This adjustment makes our Adjusted Diluted EPS more comparable with
other global companies that are not subject to this disallowed GILTI tax deduction and more comparable to the Companyâs results following the full utilization of its
U.S. NOLs.
(j) The diluted weighted average shares for adjusted EPS for the three month period ended March 31, 2017 includes 669,000 of potentially dilutive shares not included
in the computation of diluted weighted average common shares for GAAP diluted EPS purposes because their effect would have been anti-dilutive in that period.
Non-GAAP Reconciliations
Footnotes to âNet Income and Diluted EPS Reconciliationsâ
31. Non-GAAP Reconciliations
EBITDA and Adjusted EBITDA Reconciliation
ITGR: 1Q18 Earnings Conference Call / May 3, 2018 / Page 31
($ in thousands)
Three Months Ended
March 30,
2018
March 31,
2017
Net Income (loss) (GAAP) $ 8,118 $ (4,339)
Interest expense 26,445 28,893
Benefit for income taxes 4,091 144
Depreciation 14,621 13,628
Amortization 11,713 10,978
EBITDA 64,988 49,304
IP related litigation 321 377
Stock-based compensation (excluding OOE) 3,218 2,406
Strategic reorganization and alignment 3,492 â
Manufacturing alignment to support growth 513 â
Consolidation and optimization expenses 605 2,395
Acquisition and integration expenses â 4,820
Asset dispositions, severance and other 667 4,556
Noncash (gain) loss on cost and equity method investments (4,970) 398
Adjusted EBITDA (Non-GAAP) $ 68,834 $ 64,256
32. Non-GAAP Reconciliations
Organic Sales Growth Rate Reconciliation (% Change)
(a) First quarter 2018 Cardio & Vascular and Advanced Surgical, Orthopedics & Portable Medical product lines sales were positively impacted by $1.5 million and $4.5
million, respectively, due to foreign currency exchange rate fluctuations.
ITGR: 1Q18 Earnings Conference Call / May 3, 2018 / Page 32
GAAP
Reported
Growth
Impact of
Foreign
Currency(a)
Non-GAAP
Organic
Growth
QTD Change (1Q 2018 vs. 1Q 2017)
Medical Sales
Cardio & Vascular 10.6% (1.2)% 9.4%
Cardiac & Neuromodulation 4.9% â 4.9%
Advanced Surgical, Orthopedics & Portable Medical 15.8% (4.3)% 11.5%
Total Medical Sales 10.5% (1.8)% 8.7%
Non-Medical Sales 12.0% â 12.0%
Total Sales 10.5% (1.7)% 8.8%
33. Non-GAAP Reconciliations
Non-GAAP Organic Growth Rate Reconciliation (% Change)
NM calculated change not meaningful
(a) Represents the impact to our growth rate from our Non-GAAP adjustments. See slides 28-31 for further detail on these items.
(b) Represents the impact to our growth rate due to changes in foreign currency exchange rates
ITGR: 1Q18 Earnings Conference Call / May 3, 2018 / Page 33
GAAP
Reported
Growth
Impact of
Non-GAAP
Adjustment(a)
Impact of
Foreign
Currency(b)
Non-GAAP
Organic
Growth
QTD Change (1Q 2018 vs. 1Q 2017)
EBITDA 31.8% (24.7)% (0.3)% 6.8%
Net Income NM
52.7% (4.5)% 48.2%
Diluted EPS NM
48.8% (3.3)% 45.5%
34. Non-GAAP Reconciliations
2018 Full-Year Outlook
($ in millions, except per share amounts)
ITGR: 1Q18 Earnings Conference Call / May 3, 2018 / Page 34
Integerâs 2018 Outlook does not reflect the potential impact of the planned divestiture of the Advanced Surgical and Orthopedics product lines that was announced on May 3, 2018.
Except as described below, further reconciliations by line item to the closest corresponding GAAP financial measure for Adjusted Net Income, Adjusted Earnings per Diluted Share and Adjusted EBITDA,
included in our â2018 Outlookâ above, are not available without unreasonable efforts on a forward-looking basis due to the high variability, complexity and visibility of the charges excluded from this non-GAAP
financial measure.
Adjusted Net Income and EPS for 2018 is expected to consist of GAAP Net Income and EPS, excluding items such as intangible amortization, IP-related litigation costs, consolidation and realignment costs,
asset disposition and write-down charges, and loss on extinguishment of debt totaling approximately $63 million. The after-tax impact of these items is estimated to be approximately $50 million, or
approximately $1.54 per diluted share. Additionally, Adjusted Net Income and EPS is expected to exclude the estimated impact relating to our disallowed deduction of the Global Intangible Low-Taxed Income
(âGILTIâ) tax, as mandated by the U.S. Tax Cuts and Jobs Act (the âTax Reform Actâ). This disallowed deduction of the GILTI tax (approximately 50% of the total GILTI tax) is due to the Company making use
of its U.S. net operating losses (âNOLsâ), and will be eliminated once the Companyâs U.S. NOLs are fully utilized, which is expected to be in approximately three to five years. This adjustment makes our
Adjusted Diluted EPS more comparable with other global companies that are not subject to this disallowed GILTI tax deduction and more comparable to the Companyâs results following the full utilization of its
U.S. NOLs.
Adjusted EBITDA is expected to consist of Adjusted Net Income, excluding items such as depreciation, interest, stock-based compensation and taxes totaling approximately $207 million.
Supplemental Financial Items Affecting Cash Flow:
(in millions, except effective tax rate)
2018 Outlook 2017 Actual
Capital Expenditures $50 - $55 $47
Depreciation and amortization $106 - $108 $103
Stock-based compensation $10 - $12 $15
Other operating expense $10 - $15 $37
Effective tax rate, as adjusted 21% - 24% 20%
Cash taxes, excluding any refunds $13 - $15 $9
2018 Outlook
As Reported Growth Adjusted Growth
Revenue $1,510 - $1,550 3% - 6% $1,510 - $1,550 3% - 6%
Net Income $50 - $60 (25)% - (10)% $103 - $113 14% - 25%
EBITDA N/A N/A $310 - $320 9% - 12%
Earnings per Diluted Share $1.55 - $1.85 (26)% - (11)% $3.20 - $3.50 14% - 25%
GAAP Non-GAAP