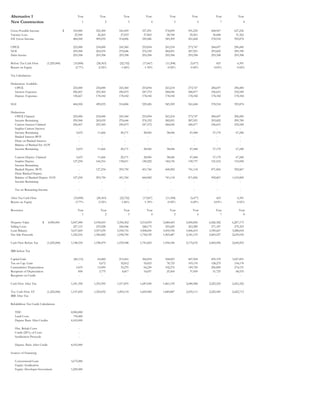
MEMORANDUM
FR: Clifton Hall
TO: Kirk McClure
RE: Pro Forma for Historic Rehab. Tax Credit
DATE: Nov. 20, 2014
Overview
A proposed multi-family residential development containing no more than 50 units
is being vetted for construction in our city. An historic landmark is on the build site,
and the developer is exploring 3 different alternatives, some involving historic
rehabilitation and/or the related tax credit available:
1. New Start: Demolition of structure and new construction. (50 units)
2. Historic Rehabilitation: Full historic rehabilitation of structure.
3. “Hybrid”: A mixture of structure rehabilitation and new construction (not
eligible for historic rehabilitation tax credit.)
The developer has expressed a desired 10 percent internal rate of return on the
project.
Analysis Results
Pro forma analysis was conducted for each of the three options. Analysis showed
that in a vacuum, all three alternatives have low earning potential. Only the new
start alternative had a positive cash flow within the study time frame, producing a
return-on-equity of barely ½ of a percent.
Alternative Units Total Dev. Cost After Tax IRR Max Max IRR Yr.
New Start 50 $4,900,000 7.86% 8+
His. Rehab. 42 $4,620,000 20.50% 5
“Hybrid” 46 $4,370,000 7.37% 8+
The historic tax credit, on the other hand, has an injection of capital from tax credit
syndication at the beginning of the project, lowering the amount of capital investors
need to raise for the project to start. The project’s internal rate of return peaks at 5
years, so the owner will likely sell the property then as the IRR begins to decline
after that year as seen in Figure 1.
Recommendation: Staff recommends the developer pursue the full historic
rehabilitation option of partial rehabilitation, as it provides an acceptable rate of
return for the developer and contributes to local public goals for historic preservation.
Figure 1: End of Year IRR for 3 Alternatives
Conclusion
Based on analysis of the alternatives, the historic rehabilitation tax credit works
exceedingly well for the developer, and achieves local goals of historic
rehabilitation. The city needs to be wary of the likelihood the developer will sell the
property within the 8-year study frame. Since the maximum IRR is nearly double the
developer’s “hurdle rate,” the city can likely use this as a bargaining chip to maintain
higher tenant performance if the owner sells.
0.00%
5.00%
10.00%
15.00%
20.00%
87654321
New Construction
Historic
Rehabilitation
"Hybrid" Approach
ALTERNATIVE RATES Alterative:
New Cons. His. Rehab Mixed
Res. Units 50 42 46
Res. Rents per Unit Y1 850$ 875$ 850$
Res. Rent Infl./Yr. 3.0% 3.0% 3.0%
Res. Vac. Loss/Yr. 5.0% 5.0% 5.0%
OPEX Y1 4,500$ 4,750$ 4,600$
OPEX Infl./Yr. 4.0% 5.0% 4.5%
TDC 4,900,000$ 4,620,000$ 4,370,000$
Land Cost 735,000$ 600,000$ 735,000$
New Const. 4,165,000$ -$ 2,000,000$
Rehab. Costs -$ 4,020,000$ 1,635,000$
Loan-Value Ratio 75.00% 75.00% 75.00%
Market APR (comp. monthly) 7.00% 7.50% 7.25%
Loan Term (Yrs.) 30 30 30
Property Appreciation/Yr. 3.00% 3.00% 3.00%
Selling Cost (%) 4.50% 4.50% 4.50%
Cap. Gain Tax Rate of Owner 15.00% 15.00% 15.00%
Recapture Rate on Depreciation 25.00% 25.00% 25.00%
Income Tax Rate of Owner 28.00% 28.00% 28.00%
Syndication Net Proceeds 90.00%
Alternative 1 Year Year Year Year Year Year Year Year
New Construction 1 2 3 4 5 6 7 8
Gross Possible Income 510,000$ 525,300 541,059 557,291 574,009 591,230 608,967 627,236
Vacancy Loss 25,500 26,265 27,053 27,865 28,700 29,561 30,448 31,362
Eff. Gross Income 484,500 499,035 514,006 529,426 545,309 561,668 578,518 595,874
OPEX 225,000 234,000 243,360 253,094 263,218 273,747 284,697 296,085
NOI 259,500 265,035 270,646 276,332 282,091 287,921 293,822 299,789
Debt Service 293,398 293,398 293,398 293,398 293,398 293,398 293,398 293,398
Before Tax Cash Flow (1,225,000) (33,898) (28,363) (22,752) (17,067) (11,308) (5,477) 423 6,391
Return on Equity -2.77% -2.32% -1.86% -1.39% -0.92% -0.45% 0.03% 0.52%
Tax Calculations
Deductions Available:
OPEX 225,000 234,000 243,360 253,094 263,218 273,747 284,697 296,085
Interest Expenses 256,067 253,369 250,475 247,372 244,045 240,477 236,651 232,549
Deprec. Expenses 130,667 178,182 178,182 178,182 178,182 178,182 178,182 178,182
EGI 484,500 499,035 514,006 529,426 545,309 561,668 578,518 595,874
Deductions
OPEX Claimed 225,000 234,000 243,360 253,094 263,218 273,747 284,697 296,085
Income Remaining 259,500 265,035 270,646 276,332 282,091 287,921 293,822 299,789
Current Interest Claimed 256,067 253,369 250,475 247,372 244,045 240,477 236,651 232,549
Surplus Current Interest - - - - - - - -
Income Remaining 3,433 11,666 20,171 28,960 38,046 47,444 57,170 67,240
Banked Interest BOY - - - - - - - -
Draw on Banked Interest - - - - - - - -
Balance of Banked Int. EOY - - - - - - - -
Income Remaining 3,433 11,666 20,171 28,960 38,046 47,444 57,170 67,240
Current Deprec. Claimed 3,433 11,666 20,171 28,960 38,046 47,444 57,170 67,240
Surplus Deprec. 127,234 166,516 158,011 149,222 140,136 130,737 121,012 110,942
Income Remaining - - - - - - - -
Banked Deprec. BOY - 127,234 293,750 451,760 600,982 741,118 871,856 992,867
Draw Banked Deprec. - - - - - - - -
Balance of Banked Deprec. EOY 127,234 293,750 451,760 600,982 741,118 871,856 992,867 1,103,809
Income Remaining - - - - - - - -
Tax on Remaining Income - - - - - - - -
After Tax Cash Flow (33,898) (28,363) (22,752) (17,067) (11,308) (5,477) 423 6,391
Return on Equity -2.77% -2.32% -1.86% -1.39% -0.92% -0.45% 0.03% 0.52%
Reversion Year Year Year Year Year Year Year Year
1 2 3 4 5 6 7 8
Property Value 4,900,000$ 5,047,000 5,198,410 5,354,362 5,514,993 5,680,443 5,850,856 6,026,382 6,207,173
Selling Costs 227,115 233,928 240,946 248,175 255,620 263,289 271,187 279,323
Loan Balance 3,637,669 3,597,639 3,554,716 3,508,690 3,459,336 3,406,415 3,349,667 3,288,818
Net Sale Proceeds 1,182,216 1,366,842 1,558,700 1,758,129 1,965,487 2,181,153 2,405,527 2,639,032
Cash Flow Before Tax (1,225,000) 1,148,318 1,338,479 1,535,948 1,741,062 1,954,180 2,175,676 2,405,950 2,645,423
IRR before Tax
Capital Gain (80,115) 64,482 213,416 366,818 524,823 687,568 855,195 1,027,851
Tax on Cap. Gain - 9,672 32,012 55,023 78,723 103,135 128,279 154,178
Cummulative Depreciation 3,433 15,099 35,270 64,230 102,276 149,720 206,890 274,131
Recapture of Depreciation 858 3,775 8,817 16,057 25,569 37,430 51,723 68,533
Recapture on Credit - - - - - - - -
Cash Flow After Tax 1,181,358 1,353,395 1,517,870 1,687,049 1,861,195 2,040,588 2,225,525 2,416,322
Tot. Cash Flow AT (1,225,000) 1,147,459 1,325,032 1,495,118 1,669,982 1,849,887 2,035,111 2,225,949 2,422,713
IRR After Tax
Rehabilition Tax Credit Calculations
TDC 4,900,000
Land Costs 735,000
Deprec Basis After Credits 4,165,000
Hist. Rehab Costs -
Credit (20%) of Costs -
Syndication Proceeds -
Deprec. Basis After Credit 4,165,000
Sources of Financing
Conventional Loan 3,675,000
Equity: Syndication -
Equity: Developer Investment 1,225,000
Alternative 2 Year Year Year Year Year Year Year Year
Historic Rehab. 1 2 3 4 5 6 7 8
Gross Possible Income 441,000$ 454,230 467,857 481,893 496,349 511,240 526,577 542,374
Vacancy Loss 22,050 22,712 23,393 24,095 24,817 25,562 26,329 27,119
Eff. Gross Income 418,950 431,519 444,464 457,798 471,532 485,678 500,248 515,256
OPEX 199,500 209,475 219,949 230,946 242,493 254,618 267,349 280,717
NOI 219,450 222,044 224,515 226,852 229,038 231,060 232,899 234,539
Debt Service 290,733 290,733 290,733 290,733 290,733 290,733 290,733 290,733
Before Tax Cash Flow (431,400) (71,283) (68,690) (66,218) (63,882) (61,695) (59,674) (57,834) (56,194)
Return on Equity -16.52% -15.92% -15.35% -14.81% -14.30% -13.83% -13.41% -13.03%
Tax Calculations
Deductions Available:
OPEX 199,500 209,475 219,949 230,946 242,493 254,618 267,349 280,717
Interest Expenses 258,792 256,312 253,640 250,760 247,657 244,313 240,709 236,826
Deprec. Expenses 168,000 168,000 168,000 168,000 168,000 168,000 168,000 168,000
EGI 418,950 431,519 444,464 457,798 471,532 485,678 500,248 515,256
Deductions
OPEX Claimed 199,500 209,475 219,949 230,946 242,493 254,618 267,349 280,717
Income Remaining 219,450 222,044 224,515 226,852 229,038 231,060 232,899 234,539
Current Interest Claimed 219,450 222,044 224,515 226,852 229,038 231,060 232,899 234,539
Surplus Current Interest 39,342 34,269 29,125 23,908 18,619 13,253 7,810 2,287
Income Remaining - - - - - - - -
Banked Interest BOY - 39,342 73,610 102,735 126,644 145,262 158,515 166,325
Draw on Banked Interest - - - - - - - -
Balance of Banked Int. EOY 39,342 73,610 102,735 126,644 145,262 158,515 166,325 168,612
Income Remaining - - - - - - - -
Current Deprec. Claimed - - - - - - - -
Surplus Deprec. 168,000 168,000 168,000 168,000 168,000 168,000 168,000 168,000
Income Remaining - - - - - - - -
Banked Deprec. BOY - 168,000 336,000 504,000 672,000 840,000 1,008,000 1,176,000
Draw Banked Deprec. - - - - - - - -
Balance of Banked Deprec. EOY 168,000 336,000 504,000 672,000 840,000 1,008,000 1,176,000 1,344,000
Income Remaining - - - - - - - -
Tax on Remaining Income - - - - - - - -
After Tax Cash Flow (431,400) (71,283) (68,690) (66,218) (63,882) (61,695) (59,674) (57,834) (56,194)
Return on Equity -16.52% -15.92% -15.35% -14.81% -14.30% -13.83% -13.41% -13.03%
Reversion Year Year Year Year Year Year Year Year
1 2 3 4 5 6 7 8
Property Value 4,620,000$ 4,758,600 4,901,358 5,048,399 5,199,851 5,355,846 5,516,522 5,682,017 5,852,478
Selling Costs 214,137 220,561 227,178 233,993 241,013 248,243 255,691 263,361
Loan Balance 3,433,058 3,398,637 3,361,544 3,321,571 3,278,494 3,232,074 3,182,049 3,128,142
Net Sale Proceeds 1,111,405 1,282,160 1,459,677 1,644,287 1,836,339 2,036,204 2,244,277 2,460,975
Cash Flow Before Tax (431,400) 1,040,121 1,213,470 1,393,459 1,580,405 1,774,644 1,976,531 2,186,443 2,404,780
IRR before Tax
Capital Gain (75,537) 60,797 201,221 345,857 494,833 648,278 806,326 969,116
Tax on Cap. Gain - 9,120 30,183 51,879 74,225 97,242 120,949 145,367
Cummulative Depreciation - - - - - - - -
Recapture of Depreciation - - - - - - - -
Recapture on Credit 804,000 643,200 482,400 321,600 160,800 - - -
Cash Flow After Tax 307,405 629,840 947,094 1,270,808 1,601,314 1,938,963 2,123,328 2,315,607
Tot. Cash Flow AT (431,400) 236,121 561,150 880,876 1,206,927 1,539,619 1,879,289 2,065,494 2,259,413
IRR After Tax
Rehabilition Tax Credit Calculations
TDC 4,620,000
Land Costs 600,000
Deprec Basis After Credits 4,020,000
Hist. Rehab Costs 4,020,000
Credit (20%) of Costs 804,000
Syndication Proceeds 723,600
Deprec. Basis After Credit 3,216,000
Sources of Financing
Conventional Loan 3,465,000
Equity: Syndication 723,600
Equity: Developer Investment 431,400
Alternative 3 Year Year Year Year Year Year Year Year
Hybrid Approach 1 2 3 4 5 6 7 8
Gross Possible Income 469,200$ 483,276 497,774 512,708 528,089 543,931 560,249 577,057
Vacancy Loss 23,460 24,164 24,889 25,635 26,404 27,197 28,012 28,853
Eff. Gross Income 445,740 459,112 472,886 487,072 501,684 516,735 532,237 548,204
OPEX 211,600 221,122 231,072 241,471 252,337 263,692 275,558 287,958
NOI 234,140 237,990 241,813 245,601 249,347 253,043 256,679 260,246
Debt Service 268,300 268,300 268,300 268,300 268,300 268,300 268,300 268,300
Before Tax Cash Flow (1,092,500) (34,160) (30,310) (26,487) (22,699) (18,953) (15,257) (11,621) (8,054)
Return on Equity -3.13% -2.77% -2.42% -2.08% -1.73% -1.40% -1.06% -0.74%
Tax Calculations
Deductions Available:
OPEX 211,600 221,122 231,072 241,471 252,337 263,692 275,558 287,958
Interest Expenses 236,578 234,201 231,645 228,897 225,943 222,768 219,355 215,687
Deprec. Expenses 132,182 132,182 132,182 132,182 132,182 132,182 132,182 132,182
EGI 445,740 459,112 472,886 487,072 501,684 516,735 532,237 548,204
Deductions
OPEX Claimed 211,600 221,122 231,072 241,471 252,337 263,692 275,558 287,958
Income Remaining 234,140 237,990 241,813 245,601 249,347 253,043 256,679 260,246
Current Interest Claimed 234,140 234,201 231,645 228,897 225,943 222,768 219,355 215,687
Surplus Current Interest 2,438 - - - - - - -
Income Remaining - 3,790 10,168 16,704 23,404 30,274 37,323 44,559
Banked Interest BOY - 2,438 - - - - - -
Draw on Banked Interest - 2,438 - - - - - -
Balance of Banked Int. EOY 2,438 - - - - - - -
Income Remaining - 1,351 10,168 16,704 23,404 30,274 37,323 44,559
Current Deprec. Claimed - 1,351 10,168 16,704 23,404 30,274 37,323 44,559
Surplus Deprec. 132,182 130,831 122,013 115,477 108,778 101,908 94,859 87,623
Income Remaining - - - - - - - -
Banked Deprec. BOY - 132,182 263,012 385,026 500,503 609,281 711,189 806,047
Draw Banked Deprec. - - - - - - - -
Balance of Banked Deprec. EOY 132,182 263,012 385,026 500,503 609,281 711,189 806,047 893,670
Income Remaining - - - - - - - -
Tax on Remaining Income - - - - - - - -
After Tax Cash Flow (34,160) (30,310) (26,487) (22,699) (18,953) (15,257) (11,621) (8,054)
Return on Equity -2.79% -2.47% -2.16% -1.85% -1.55% -1.25% -0.95% -0.66%
Reversion Year Year Year Year Year Year Year Year
1 2 3 4 5 6 7 8
Property Value 4,370,000$ 4,501,100 4,636,133 4,775,217 4,918,473 5,066,028 5,218,009 5,374,549 5,535,785
Selling Costs 202,550 208,626 214,885 221,331 227,971 234,810 241,855 249,110
Loan Balance 3,245,778 3,211,679 3,175,024 3,135,621 3,093,264 3,047,733 2,998,788 2,946,175
Net Sale Proceeds 1,052,772 1,215,828 1,385,308 1,561,521 1,744,792 1,935,465 2,133,906 2,340,500
Cash Flow Before Tax (1,092,500) 1,018,612 1,185,518 1,358,821 1,538,823 1,725,839 1,920,208 2,122,284 2,332,445
IRR before Tax 1.07
Capital Gain (71,450) 57,507 190,332 327,142 468,056 613,198 762,694 916,675
Tax on Cap. Gain - 8,626 28,550 49,071 70,208 91,980 114,404 137,501
Cummulative Depreciation - 1,351 11,520 28,224 51,628 81,902 119,225 163,784
Recapture of Depreciation - 338 2,880 7,056 12,907 20,476 29,806 40,946
Recapture on Credit - - - - - - - -
Cash Flow After Tax 1,052,772 1,206,864 1,353,879 1,505,394 1,661,677 1,823,010 1,989,695 2,162,052
Tot. Cash Flow AT (1,092,500) 1,018,612 1,176,554 1,327,392 1,482,695 1,642,724 1,807,753 1,978,074 2,153,998
IRR After Tax
Rehabilition Tax Credit Calculations
TDC 4,370,000
Land Costs 735,000
Deprec Basis After Credits 3,635,000
Hist. Rehab Costs -
Credit (20%) of Costs -
Syndication Proceeds -
Deprec. Basis After Credit 3,635,000
Sources of Financing
Conventional Loan 3,277,500
Equity: Syndication -
Equity: Developer Investment 1,092,500
IRR Tables
NEW CONST
YRSOLDBTIRR EQUITY CFY1 CFY2 CFY3 CFY4 CFY5 CFY6 CFY7 CFY8
8 9.08% (1,225,000) (33,898) (28,363) (22,752) (17,067) (11,308) (5,477) 423 2,645,423
7 8.95% (1,225,000) (33,898) (28,363) (22,752) (17,067) (11,308) (5,477) 2,405,950
6 8.72% (1,225,000) (33,898) (28,363) (22,752) (17,067) (11,308) 2,175,676
5 8.31% (1,225,000) (33,898) (28,363) (22,752) (17,067) 1,954,180
4 7.59% (1,225,000) (33,898) (28,363) (22,752) 1,741,062
3 6.21% (1,225,000) (33,898) (28,363) 1,535,948
2 3.15% (1,225,000) (33,898) 1,338,479
1 -6.26% (1,225,000) 1,148,318
ATIRR
8 7.86% (1,225,000) (33,898) (28,363) (22,752) (17,067) (11,308) (5,477) 423 2,422,713
7 7.71% (1,225,000) (33,898) (28,363) (22,752) (17,067) (11,308) (5,477) 2,225,949
6 7.48% (1,225,000) (33,898) (28,363) (22,752) (17,067) (11,308) 2,035,111
5 7.10% (1,225,000) (33,898) (28,363) (22,752) (17,067) 1,849,887
4 6.45% (1,225,000) (33,898) (28,363) (22,752) 1,669,982
3 5.24% (1,225,000) (33,898) (28,363) 1,495,118
2 2.63% (1,225,000) (33,898) 1,325,032
1 -6.33% (1,225,000) 1,147,459
HISTORIC REHAB
YRSOLDBTIRR EQUITY CFY1 CFY2 CFY3 CFY4 CFY5 CFY6 CFY7 CFY8
8 16.91% (431,400) (71,283) (68,690) (66,218) (63,882) (61,695) (59,674) (57,834) 2,404,780
7 18.67% (431,400) (71,283) (68,690) (66,218) (63,882) (61,695) (59,674) 2,186,443
6 21.06% (431,400) (71,283) (68,690) (66,218) (63,882) (61,695) 1,976,531
5 24.47% (431,400) (71,283) (68,690) (66,218) (63,882) 1,774,644
4 29.76% (431,400) (71,283) (68,690) (66,218) 1,580,405
3 39.06% (431,400) (71,283) (68,690) 1,393,459
2 59.66% (431,400) (71,283) 1,213,470
1 141.10% (431,400) 1,040,121
YRSOLDATIRR EQUITY CFY1 CFY2 CFY3 CFY4 CFY5 CFY6 CFY7 CFY8
8 15.83% (431,400) (71,283) (68,690) (66,218) (63,882) (61,695) (59,674) (57,834) 2,259,413
7 17.55% (431,400) (71,283) (68,690) (66,218) (63,882) (61,695) (59,674) 2,065,494
6 19.89% (431,400) (71,283) (68,690) (66,218) (63,882) (61,695) 1,879,289
5 20.50% (431,400) (71,283) (68,690) (66,218) (63,882) 1,539,619
4 20.31% (431,400) (71,283) (68,690) (66,218) 1,206,927
3 17.59% (431,400) (71,283) (68,690) 880,876
2 6.09% (431,400) (71,283) 561,150
1 -45.27% (431,400) 236,121
HYBRID
YRSOLDBTIRR EQUITY CFY1 CFY2 CFY3 CFY4 CFY5 CFY6 CFY7 CFY8
8 8.49% (1,092,500) (34,160) (30,310) (26,487) (22,699) (18,953) (15,257) (11,621) 2,332,445
7 8.37% (1,092,500) (34,160) (30,310) (26,487) (22,699) (18,953) (15,257) 2,122,284
6 8.15% (1,092,500) (34,160) (30,310) (26,487) (22,699) (18,953) 1,920,208
5 7.75% (1,092,500) (34,160) (30,310) (26,487) (22,699) 1,725,839
4 7.03% (1,092,500) (34,160) (30,310) (26,487) 1,538,823
3 5.66% (1,092,500) (34,160) (30,310) 1,358,821
2 2.62% (1,092,500) (34,160) 1,185,518
1 -6.76% (1,092,500) 1,018,612
YRSOLDATIRR EQUITY CFY1 CFY2 CFY3 CFY4 CFY5 CFY6 CFY7 CFY8
8 7.37% (1,092,500) (34,160) (30,310) (26,487) (22,699) (18,953) (15,257) (11,621) 2,153,998
7 7.24% (1,092,500) (34,160) (30,310) (26,487) (22,699) (18,953) (15,257) 1,978,074
6 7.02% (1,092,500) (34,160) (30,310) (26,487) (22,699) (18,953) 1,807,753
5 6.65% (1,092,500) (34,160) (30,310) (26,487) (22,699) 1,642,724
4 6.01% (1,092,500) (34,160) (30,310) (26,487) 1,482,695
3 4.82% (1,092,500) (34,160) (30,310) 1,327,392
2 2.22% (1,092,500) (34,160) 1,176,554
1 -6.76% (1,092,500) 1,018,612
YRSOLDHURDLE
8 10%
7 10%
6 10%
5 10%
4 10%
3 10%
2 10%
1 10%
0.00%
5.00%
10.00%
15.00%
20.00%
87654321
New Construction
Historic Rehabilitation
"Hybrid" Approach
Hurdle Rate

RE1-6

  • 1.
    MEMORANDUM FR: Clifton Hall TO:Kirk McClure RE: Pro Forma for Historic Rehab. Tax Credit DATE: Nov. 20, 2014 Overview A proposed multi-family residential development containing no more than 50 units is being vetted for construction in our city. An historic landmark is on the build site, and the developer is exploring 3 different alternatives, some involving historic rehabilitation and/or the related tax credit available: 1. New Start: Demolition of structure and new construction. (50 units) 2. Historic Rehabilitation: Full historic rehabilitation of structure. 3. “Hybrid”: A mixture of structure rehabilitation and new construction (not eligible for historic rehabilitation tax credit.) The developer has expressed a desired 10 percent internal rate of return on the project. Analysis Results Pro forma analysis was conducted for each of the three options. Analysis showed that in a vacuum, all three alternatives have low earning potential. Only the new start alternative had a positive cash flow within the study time frame, producing a return-on-equity of barely ½ of a percent. Alternative Units Total Dev. Cost After Tax IRR Max Max IRR Yr. New Start 50 $4,900,000 7.86% 8+ His. Rehab. 42 $4,620,000 20.50% 5 “Hybrid” 46 $4,370,000 7.37% 8+ The historic tax credit, on the other hand, has an injection of capital from tax credit syndication at the beginning of the project, lowering the amount of capital investors need to raise for the project to start. The project’s internal rate of return peaks at 5 years, so the owner will likely sell the property then as the IRR begins to decline after that year as seen in Figure 1. Recommendation: Staff recommends the developer pursue the full historic rehabilitation option of partial rehabilitation, as it provides an acceptable rate of return for the developer and contributes to local public goals for historic preservation.
  • 2.
    Figure 1: Endof Year IRR for 3 Alternatives Conclusion Based on analysis of the alternatives, the historic rehabilitation tax credit works exceedingly well for the developer, and achieves local goals of historic rehabilitation. The city needs to be wary of the likelihood the developer will sell the property within the 8-year study frame. Since the maximum IRR is nearly double the developer’s “hurdle rate,” the city can likely use this as a bargaining chip to maintain higher tenant performance if the owner sells. 0.00% 5.00% 10.00% 15.00% 20.00% 87654321 New Construction Historic Rehabilitation "Hybrid" Approach
  • 3.
    ALTERNATIVE RATES Alterative: NewCons. His. Rehab Mixed Res. Units 50 42 46 Res. Rents per Unit Y1 850$ 875$ 850$ Res. Rent Infl./Yr. 3.0% 3.0% 3.0% Res. Vac. Loss/Yr. 5.0% 5.0% 5.0% OPEX Y1 4,500$ 4,750$ 4,600$ OPEX Infl./Yr. 4.0% 5.0% 4.5% TDC 4,900,000$ 4,620,000$ 4,370,000$ Land Cost 735,000$ 600,000$ 735,000$ New Const. 4,165,000$ -$ 2,000,000$ Rehab. Costs -$ 4,020,000$ 1,635,000$ Loan-Value Ratio 75.00% 75.00% 75.00% Market APR (comp. monthly) 7.00% 7.50% 7.25% Loan Term (Yrs.) 30 30 30 Property Appreciation/Yr. 3.00% 3.00% 3.00% Selling Cost (%) 4.50% 4.50% 4.50% Cap. Gain Tax Rate of Owner 15.00% 15.00% 15.00% Recapture Rate on Depreciation 25.00% 25.00% 25.00% Income Tax Rate of Owner 28.00% 28.00% 28.00% Syndication Net Proceeds 90.00%
  • 4.
    Alternative 1 YearYear Year Year Year Year Year Year New Construction 1 2 3 4 5 6 7 8 Gross Possible Income 510,000$ 525,300 541,059 557,291 574,009 591,230 608,967 627,236 Vacancy Loss 25,500 26,265 27,053 27,865 28,700 29,561 30,448 31,362 Eff. Gross Income 484,500 499,035 514,006 529,426 545,309 561,668 578,518 595,874 OPEX 225,000 234,000 243,360 253,094 263,218 273,747 284,697 296,085 NOI 259,500 265,035 270,646 276,332 282,091 287,921 293,822 299,789 Debt Service 293,398 293,398 293,398 293,398 293,398 293,398 293,398 293,398 Before Tax Cash Flow (1,225,000) (33,898) (28,363) (22,752) (17,067) (11,308) (5,477) 423 6,391 Return on Equity -2.77% -2.32% -1.86% -1.39% -0.92% -0.45% 0.03% 0.52% Tax Calculations Deductions Available: OPEX 225,000 234,000 243,360 253,094 263,218 273,747 284,697 296,085 Interest Expenses 256,067 253,369 250,475 247,372 244,045 240,477 236,651 232,549 Deprec. Expenses 130,667 178,182 178,182 178,182 178,182 178,182 178,182 178,182 EGI 484,500 499,035 514,006 529,426 545,309 561,668 578,518 595,874 Deductions OPEX Claimed 225,000 234,000 243,360 253,094 263,218 273,747 284,697 296,085 Income Remaining 259,500 265,035 270,646 276,332 282,091 287,921 293,822 299,789 Current Interest Claimed 256,067 253,369 250,475 247,372 244,045 240,477 236,651 232,549 Surplus Current Interest - - - - - - - - Income Remaining 3,433 11,666 20,171 28,960 38,046 47,444 57,170 67,240 Banked Interest BOY - - - - - - - - Draw on Banked Interest - - - - - - - - Balance of Banked Int. EOY - - - - - - - - Income Remaining 3,433 11,666 20,171 28,960 38,046 47,444 57,170 67,240 Current Deprec. Claimed 3,433 11,666 20,171 28,960 38,046 47,444 57,170 67,240 Surplus Deprec. 127,234 166,516 158,011 149,222 140,136 130,737 121,012 110,942 Income Remaining - - - - - - - - Banked Deprec. BOY - 127,234 293,750 451,760 600,982 741,118 871,856 992,867 Draw Banked Deprec. - - - - - - - - Balance of Banked Deprec. EOY 127,234 293,750 451,760 600,982 741,118 871,856 992,867 1,103,809 Income Remaining - - - - - - - - Tax on Remaining Income - - - - - - - - After Tax Cash Flow (33,898) (28,363) (22,752) (17,067) (11,308) (5,477) 423 6,391 Return on Equity -2.77% -2.32% -1.86% -1.39% -0.92% -0.45% 0.03% 0.52% Reversion Year Year Year Year Year Year Year Year 1 2 3 4 5 6 7 8 Property Value 4,900,000$ 5,047,000 5,198,410 5,354,362 5,514,993 5,680,443 5,850,856 6,026,382 6,207,173 Selling Costs 227,115 233,928 240,946 248,175 255,620 263,289 271,187 279,323 Loan Balance 3,637,669 3,597,639 3,554,716 3,508,690 3,459,336 3,406,415 3,349,667 3,288,818 Net Sale Proceeds 1,182,216 1,366,842 1,558,700 1,758,129 1,965,487 2,181,153 2,405,527 2,639,032 Cash Flow Before Tax (1,225,000) 1,148,318 1,338,479 1,535,948 1,741,062 1,954,180 2,175,676 2,405,950 2,645,423 IRR before Tax Capital Gain (80,115) 64,482 213,416 366,818 524,823 687,568 855,195 1,027,851 Tax on Cap. Gain - 9,672 32,012 55,023 78,723 103,135 128,279 154,178 Cummulative Depreciation 3,433 15,099 35,270 64,230 102,276 149,720 206,890 274,131 Recapture of Depreciation 858 3,775 8,817 16,057 25,569 37,430 51,723 68,533 Recapture on Credit - - - - - - - - Cash Flow After Tax 1,181,358 1,353,395 1,517,870 1,687,049 1,861,195 2,040,588 2,225,525 2,416,322 Tot. Cash Flow AT (1,225,000) 1,147,459 1,325,032 1,495,118 1,669,982 1,849,887 2,035,111 2,225,949 2,422,713 IRR After Tax Rehabilition Tax Credit Calculations TDC 4,900,000 Land Costs 735,000 Deprec Basis After Credits 4,165,000 Hist. Rehab Costs - Credit (20%) of Costs - Syndication Proceeds - Deprec. Basis After Credit 4,165,000 Sources of Financing Conventional Loan 3,675,000 Equity: Syndication - Equity: Developer Investment 1,225,000
  • 5.
    Alternative 2 YearYear Year Year Year Year Year Year Historic Rehab. 1 2 3 4 5 6 7 8 Gross Possible Income 441,000$ 454,230 467,857 481,893 496,349 511,240 526,577 542,374 Vacancy Loss 22,050 22,712 23,393 24,095 24,817 25,562 26,329 27,119 Eff. Gross Income 418,950 431,519 444,464 457,798 471,532 485,678 500,248 515,256 OPEX 199,500 209,475 219,949 230,946 242,493 254,618 267,349 280,717 NOI 219,450 222,044 224,515 226,852 229,038 231,060 232,899 234,539 Debt Service 290,733 290,733 290,733 290,733 290,733 290,733 290,733 290,733 Before Tax Cash Flow (431,400) (71,283) (68,690) (66,218) (63,882) (61,695) (59,674) (57,834) (56,194) Return on Equity -16.52% -15.92% -15.35% -14.81% -14.30% -13.83% -13.41% -13.03% Tax Calculations Deductions Available: OPEX 199,500 209,475 219,949 230,946 242,493 254,618 267,349 280,717 Interest Expenses 258,792 256,312 253,640 250,760 247,657 244,313 240,709 236,826 Deprec. Expenses 168,000 168,000 168,000 168,000 168,000 168,000 168,000 168,000 EGI 418,950 431,519 444,464 457,798 471,532 485,678 500,248 515,256 Deductions OPEX Claimed 199,500 209,475 219,949 230,946 242,493 254,618 267,349 280,717 Income Remaining 219,450 222,044 224,515 226,852 229,038 231,060 232,899 234,539 Current Interest Claimed 219,450 222,044 224,515 226,852 229,038 231,060 232,899 234,539 Surplus Current Interest 39,342 34,269 29,125 23,908 18,619 13,253 7,810 2,287 Income Remaining - - - - - - - - Banked Interest BOY - 39,342 73,610 102,735 126,644 145,262 158,515 166,325 Draw on Banked Interest - - - - - - - - Balance of Banked Int. EOY 39,342 73,610 102,735 126,644 145,262 158,515 166,325 168,612 Income Remaining - - - - - - - - Current Deprec. Claimed - - - - - - - - Surplus Deprec. 168,000 168,000 168,000 168,000 168,000 168,000 168,000 168,000 Income Remaining - - - - - - - - Banked Deprec. BOY - 168,000 336,000 504,000 672,000 840,000 1,008,000 1,176,000 Draw Banked Deprec. - - - - - - - - Balance of Banked Deprec. EOY 168,000 336,000 504,000 672,000 840,000 1,008,000 1,176,000 1,344,000 Income Remaining - - - - - - - - Tax on Remaining Income - - - - - - - - After Tax Cash Flow (431,400) (71,283) (68,690) (66,218) (63,882) (61,695) (59,674) (57,834) (56,194) Return on Equity -16.52% -15.92% -15.35% -14.81% -14.30% -13.83% -13.41% -13.03% Reversion Year Year Year Year Year Year Year Year 1 2 3 4 5 6 7 8 Property Value 4,620,000$ 4,758,600 4,901,358 5,048,399 5,199,851 5,355,846 5,516,522 5,682,017 5,852,478 Selling Costs 214,137 220,561 227,178 233,993 241,013 248,243 255,691 263,361 Loan Balance 3,433,058 3,398,637 3,361,544 3,321,571 3,278,494 3,232,074 3,182,049 3,128,142 Net Sale Proceeds 1,111,405 1,282,160 1,459,677 1,644,287 1,836,339 2,036,204 2,244,277 2,460,975 Cash Flow Before Tax (431,400) 1,040,121 1,213,470 1,393,459 1,580,405 1,774,644 1,976,531 2,186,443 2,404,780 IRR before Tax Capital Gain (75,537) 60,797 201,221 345,857 494,833 648,278 806,326 969,116 Tax on Cap. Gain - 9,120 30,183 51,879 74,225 97,242 120,949 145,367 Cummulative Depreciation - - - - - - - - Recapture of Depreciation - - - - - - - - Recapture on Credit 804,000 643,200 482,400 321,600 160,800 - - - Cash Flow After Tax 307,405 629,840 947,094 1,270,808 1,601,314 1,938,963 2,123,328 2,315,607 Tot. Cash Flow AT (431,400) 236,121 561,150 880,876 1,206,927 1,539,619 1,879,289 2,065,494 2,259,413 IRR After Tax Rehabilition Tax Credit Calculations TDC 4,620,000 Land Costs 600,000 Deprec Basis After Credits 4,020,000 Hist. Rehab Costs 4,020,000 Credit (20%) of Costs 804,000 Syndication Proceeds 723,600 Deprec. Basis After Credit 3,216,000 Sources of Financing Conventional Loan 3,465,000 Equity: Syndication 723,600 Equity: Developer Investment 431,400
  • 6.
    Alternative 3 YearYear Year Year Year Year Year Year Hybrid Approach 1 2 3 4 5 6 7 8 Gross Possible Income 469,200$ 483,276 497,774 512,708 528,089 543,931 560,249 577,057 Vacancy Loss 23,460 24,164 24,889 25,635 26,404 27,197 28,012 28,853 Eff. Gross Income 445,740 459,112 472,886 487,072 501,684 516,735 532,237 548,204 OPEX 211,600 221,122 231,072 241,471 252,337 263,692 275,558 287,958 NOI 234,140 237,990 241,813 245,601 249,347 253,043 256,679 260,246 Debt Service 268,300 268,300 268,300 268,300 268,300 268,300 268,300 268,300 Before Tax Cash Flow (1,092,500) (34,160) (30,310) (26,487) (22,699) (18,953) (15,257) (11,621) (8,054) Return on Equity -3.13% -2.77% -2.42% -2.08% -1.73% -1.40% -1.06% -0.74% Tax Calculations Deductions Available: OPEX 211,600 221,122 231,072 241,471 252,337 263,692 275,558 287,958 Interest Expenses 236,578 234,201 231,645 228,897 225,943 222,768 219,355 215,687 Deprec. Expenses 132,182 132,182 132,182 132,182 132,182 132,182 132,182 132,182 EGI 445,740 459,112 472,886 487,072 501,684 516,735 532,237 548,204 Deductions OPEX Claimed 211,600 221,122 231,072 241,471 252,337 263,692 275,558 287,958 Income Remaining 234,140 237,990 241,813 245,601 249,347 253,043 256,679 260,246 Current Interest Claimed 234,140 234,201 231,645 228,897 225,943 222,768 219,355 215,687 Surplus Current Interest 2,438 - - - - - - - Income Remaining - 3,790 10,168 16,704 23,404 30,274 37,323 44,559 Banked Interest BOY - 2,438 - - - - - - Draw on Banked Interest - 2,438 - - - - - - Balance of Banked Int. EOY 2,438 - - - - - - - Income Remaining - 1,351 10,168 16,704 23,404 30,274 37,323 44,559 Current Deprec. Claimed - 1,351 10,168 16,704 23,404 30,274 37,323 44,559 Surplus Deprec. 132,182 130,831 122,013 115,477 108,778 101,908 94,859 87,623 Income Remaining - - - - - - - - Banked Deprec. BOY - 132,182 263,012 385,026 500,503 609,281 711,189 806,047 Draw Banked Deprec. - - - - - - - - Balance of Banked Deprec. EOY 132,182 263,012 385,026 500,503 609,281 711,189 806,047 893,670 Income Remaining - - - - - - - - Tax on Remaining Income - - - - - - - - After Tax Cash Flow (34,160) (30,310) (26,487) (22,699) (18,953) (15,257) (11,621) (8,054) Return on Equity -2.79% -2.47% -2.16% -1.85% -1.55% -1.25% -0.95% -0.66% Reversion Year Year Year Year Year Year Year Year 1 2 3 4 5 6 7 8 Property Value 4,370,000$ 4,501,100 4,636,133 4,775,217 4,918,473 5,066,028 5,218,009 5,374,549 5,535,785 Selling Costs 202,550 208,626 214,885 221,331 227,971 234,810 241,855 249,110 Loan Balance 3,245,778 3,211,679 3,175,024 3,135,621 3,093,264 3,047,733 2,998,788 2,946,175 Net Sale Proceeds 1,052,772 1,215,828 1,385,308 1,561,521 1,744,792 1,935,465 2,133,906 2,340,500 Cash Flow Before Tax (1,092,500) 1,018,612 1,185,518 1,358,821 1,538,823 1,725,839 1,920,208 2,122,284 2,332,445 IRR before Tax 1.07 Capital Gain (71,450) 57,507 190,332 327,142 468,056 613,198 762,694 916,675 Tax on Cap. Gain - 8,626 28,550 49,071 70,208 91,980 114,404 137,501 Cummulative Depreciation - 1,351 11,520 28,224 51,628 81,902 119,225 163,784 Recapture of Depreciation - 338 2,880 7,056 12,907 20,476 29,806 40,946 Recapture on Credit - - - - - - - - Cash Flow After Tax 1,052,772 1,206,864 1,353,879 1,505,394 1,661,677 1,823,010 1,989,695 2,162,052 Tot. Cash Flow AT (1,092,500) 1,018,612 1,176,554 1,327,392 1,482,695 1,642,724 1,807,753 1,978,074 2,153,998 IRR After Tax Rehabilition Tax Credit Calculations TDC 4,370,000 Land Costs 735,000 Deprec Basis After Credits 3,635,000 Hist. Rehab Costs - Credit (20%) of Costs - Syndication Proceeds - Deprec. Basis After Credit 3,635,000 Sources of Financing Conventional Loan 3,277,500 Equity: Syndication - Equity: Developer Investment 1,092,500
  • 7.
    IRR Tables NEW CONST YRSOLDBTIRREQUITY CFY1 CFY2 CFY3 CFY4 CFY5 CFY6 CFY7 CFY8 8 9.08% (1,225,000) (33,898) (28,363) (22,752) (17,067) (11,308) (5,477) 423 2,645,423 7 8.95% (1,225,000) (33,898) (28,363) (22,752) (17,067) (11,308) (5,477) 2,405,950 6 8.72% (1,225,000) (33,898) (28,363) (22,752) (17,067) (11,308) 2,175,676 5 8.31% (1,225,000) (33,898) (28,363) (22,752) (17,067) 1,954,180 4 7.59% (1,225,000) (33,898) (28,363) (22,752) 1,741,062 3 6.21% (1,225,000) (33,898) (28,363) 1,535,948 2 3.15% (1,225,000) (33,898) 1,338,479 1 -6.26% (1,225,000) 1,148,318 ATIRR 8 7.86% (1,225,000) (33,898) (28,363) (22,752) (17,067) (11,308) (5,477) 423 2,422,713 7 7.71% (1,225,000) (33,898) (28,363) (22,752) (17,067) (11,308) (5,477) 2,225,949 6 7.48% (1,225,000) (33,898) (28,363) (22,752) (17,067) (11,308) 2,035,111 5 7.10% (1,225,000) (33,898) (28,363) (22,752) (17,067) 1,849,887 4 6.45% (1,225,000) (33,898) (28,363) (22,752) 1,669,982 3 5.24% (1,225,000) (33,898) (28,363) 1,495,118 2 2.63% (1,225,000) (33,898) 1,325,032 1 -6.33% (1,225,000) 1,147,459 HISTORIC REHAB YRSOLDBTIRR EQUITY CFY1 CFY2 CFY3 CFY4 CFY5 CFY6 CFY7 CFY8 8 16.91% (431,400) (71,283) (68,690) (66,218) (63,882) (61,695) (59,674) (57,834) 2,404,780 7 18.67% (431,400) (71,283) (68,690) (66,218) (63,882) (61,695) (59,674) 2,186,443 6 21.06% (431,400) (71,283) (68,690) (66,218) (63,882) (61,695) 1,976,531 5 24.47% (431,400) (71,283) (68,690) (66,218) (63,882) 1,774,644 4 29.76% (431,400) (71,283) (68,690) (66,218) 1,580,405 3 39.06% (431,400) (71,283) (68,690) 1,393,459 2 59.66% (431,400) (71,283) 1,213,470 1 141.10% (431,400) 1,040,121 YRSOLDATIRR EQUITY CFY1 CFY2 CFY3 CFY4 CFY5 CFY6 CFY7 CFY8 8 15.83% (431,400) (71,283) (68,690) (66,218) (63,882) (61,695) (59,674) (57,834) 2,259,413 7 17.55% (431,400) (71,283) (68,690) (66,218) (63,882) (61,695) (59,674) 2,065,494 6 19.89% (431,400) (71,283) (68,690) (66,218) (63,882) (61,695) 1,879,289 5 20.50% (431,400) (71,283) (68,690) (66,218) (63,882) 1,539,619 4 20.31% (431,400) (71,283) (68,690) (66,218) 1,206,927 3 17.59% (431,400) (71,283) (68,690) 880,876 2 6.09% (431,400) (71,283) 561,150 1 -45.27% (431,400) 236,121 HYBRID YRSOLDBTIRR EQUITY CFY1 CFY2 CFY3 CFY4 CFY5 CFY6 CFY7 CFY8 8 8.49% (1,092,500) (34,160) (30,310) (26,487) (22,699) (18,953) (15,257) (11,621) 2,332,445 7 8.37% (1,092,500) (34,160) (30,310) (26,487) (22,699) (18,953) (15,257) 2,122,284 6 8.15% (1,092,500) (34,160) (30,310) (26,487) (22,699) (18,953) 1,920,208 5 7.75% (1,092,500) (34,160) (30,310) (26,487) (22,699) 1,725,839 4 7.03% (1,092,500) (34,160) (30,310) (26,487) 1,538,823 3 5.66% (1,092,500) (34,160) (30,310) 1,358,821 2 2.62% (1,092,500) (34,160) 1,185,518 1 -6.76% (1,092,500) 1,018,612 YRSOLDATIRR EQUITY CFY1 CFY2 CFY3 CFY4 CFY5 CFY6 CFY7 CFY8 8 7.37% (1,092,500) (34,160) (30,310) (26,487) (22,699) (18,953) (15,257) (11,621) 2,153,998 7 7.24% (1,092,500) (34,160) (30,310) (26,487) (22,699) (18,953) (15,257) 1,978,074 6 7.02% (1,092,500) (34,160) (30,310) (26,487) (22,699) (18,953) 1,807,753 5 6.65% (1,092,500) (34,160) (30,310) (26,487) (22,699) 1,642,724 4 6.01% (1,092,500) (34,160) (30,310) (26,487) 1,482,695 3 4.82% (1,092,500) (34,160) (30,310) 1,327,392 2 2.22% (1,092,500) (34,160) 1,176,554 1 -6.76% (1,092,500) 1,018,612 YRSOLDHURDLE 8 10% 7 10% 6 10% 5 10% 4 10% 3 10% 2 10% 1 10% 0.00% 5.00% 10.00% 15.00% 20.00% 87654321 New Construction Historic Rehabilitation "Hybrid" Approach Hurdle Rate