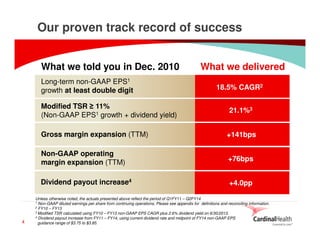
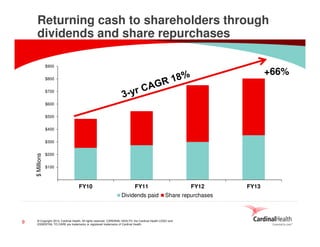
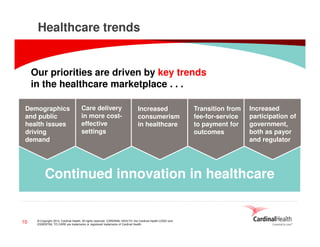
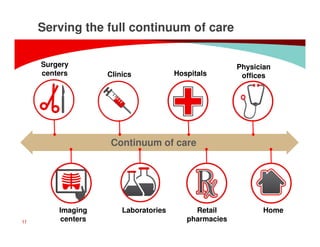
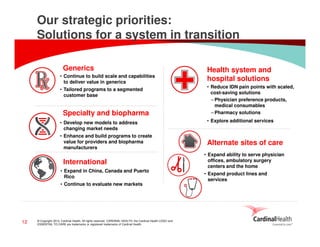
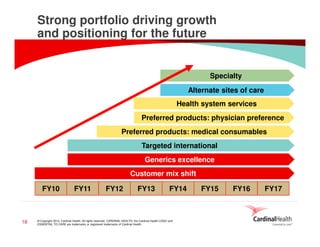
Cardinal Health:
Well-balanced. Well-prepared. Well-focused.

Jeff Henderson
Chief Financial Officer
Raymond James Institutional Investors Conference, March 4, 2014
© Copyright 2014, Cardinal Health. All rights reserved. CARDINAL HEALTH, the Cardinal Health LOGO and
ESSENTIAL TO CARE are trademarks or registered trademarks of Cardinal Health.
Cautions concerning forward-looking statements
Today’s presentation contains forward-looking statements addressing expectations, prospects, estimates and
other matters that are dependent upon future events or developments. These statements may be identified by
words such as "expect," "anticipate," "intend," "plan," "believe," "will," "should," "could," "would," "project,"
"continue," "likely," and similar expressions, and include statements reflecting future results or guidance,
statements of outlook and expense accruals. These matters are subject to risks and uncertainties that could
cause actual results to differ materially from those projected, anticipated or implied. These risks and
uncertainties include competitive pressures in Cardinal Health's various lines of business; the ability to
achieve the expected benefits from the generic sourcing joint venture with CVS Caremark; the timing of
generic and branded pharmaceutical introductions and the frequency or rate of pharmaceutical price
appreciation or deflation; the non-renewal, early termination or a default under one or more key customer or
supplier arrangements or changes to the terms of or level of purchases under those arrangements;
uncertainties due to government health care reform including federal health care reform legislation; changes in
the distribution patterns or reimbursement rates for health care products and services; the effects of any
investigation or action by any regulatory authority; and changes in the cost of commodities such as oil-based
resins, cotton, latex and diesel fuel. Cardinal Health is subject to additional risks and uncertainties described
in Cardinal Health's Form 10-K, Form 10-Q and Form 8-K reports and exhibits to those reports. These
presentations reflect management's views as of March 4, 2014. Except to the extent required by applicable
law, Cardinal Health undertakes no obligation to update or revise any forward-looking statement. In addition,
these presentations contain Non-GAAP financial measures. Cardinal Health provides GAAP numbers,
definitions and reconciling information in the Financial Appendix at the end of these presentations and on its
Investors page at www.cardinalhealth.com. An audio replay of this presentation will be available on the
Investors page at www.cardinalhealth.com.

2

© Copyright 2014, Cardinal Health. All rights reserved. CARDINAL HEALTH, the Cardinal Health LOGO and
ESSENTIAL TO CARE are trademarks or registered trademarks of Cardinal Health.
Our profile

Outstanding record of financial growth based
on strong execution and focus on the right
strategic priorities
Thoughtful deployment of capital and
substantial returns for shareholders
Positioned for future growth in an evolving
healthcare landscape

3

© Copyright 2014, Cardinal Health. All rights reserved. CARDINAL HEALTH, the Cardinal Health LOGO and
ESSENTIAL TO CARE are trademarks or registered trademarks of Cardinal Health.
Our proven track record of success
What we told you in Dec. 2010
Long-term non-GAAP EPS1
growth at least double digit
Modified TSR ≥ 11%
(Non-GAAP EPS1 growth + dividend yield)

What we delivered
18.5% CAGR2
21.1%3

Gross margin expansion (TTM)
Non-GAAP operating
margin expansion (TTM)

+76bps

Dividend payout increase4

4

+141bps

+4.0pp

Unless otherwise noted, the actuals presented above reflect the period of Q1FY11 – Q2FY14
1 Non-GAAP diluted earnings per share from continuing operations; Please see appendix for definitions and reconciling information.
2 FY10 – FY13
3 Modified TSR calculated using FY10 – FY13 non-GAAP EPS CAGR plus 2.6% dividend yield on 6/30/2013.
4 Dividend payout increase from FY11 – FY14, using current dividend rate and midpoint of FY14 non-GAAP EPS
© Copyright 2014, Cardinal Health. All rights reserved. CARDINAL HEALTH, the Cardinal Health LOGO and
guidance range are trademarks or registered trademarks of Cardinal Health.
ESSENTIAL TO CAREof $3.75 to $3.85.
Driving consistent operating
margin expansion
Non-GAAP operating earnings as a
percent of revenue (TTM)

2.4%

2.2%

2.0%

1.8%

1.6%

1.4%
Q1

Q2

Q3
2011

Q4

Q1

Q2

Q3

Q4

2012

Please see appendix for GAAP/non-GAAP definitions and reconciling information.

5

© Copyright 2014, Cardinal Health. All rights reserved. CARDINAL HEALTH, the Cardinal Health LOGO and
ESSENTIAL TO CARE are trademarks or registered trademarks of Cardinal Health.

Q1

Q2

Q3
2013

Q4

Q1

Q2
2014
Non-GAAP operating earnings:
Historical trend
(In millions)
$2,046
$1,866
$1,644
$1,394

FY10

6

FY11

© Copyright 2014, Cardinal Health. All rights reserved. CARDINAL HEALTH, the Cardinal Health LOGO and
ESSENTIAL TO CARE are trademarks or registered trademarks of Cardinal Health.

FY12

FY13
Non-GAAP EPS1: Historical trend
$3.73
$3.21
Includes
$0.18 favorable
tax settlement

$2.80
$2.24

FY10
1

7

FY11

Non-GAAP diluted earnings per share from continuing operations.
Please see appendix for definitions and reconciling information.

© Copyright 2014, Cardinal Health. All rights reserved. CARDINAL HEALTH, the Cardinal Health LOGO and
ESSENTIAL TO CARE are trademarks or registered trademarks of Cardinal Health.

FY12

FY13
Thoughtful capital deployment approach

Capital deployment post CareFusion spin1

Dividends
Capital expenditures
Share repurchases
Acquisitions, net of
diverstures

1

8

Capital deployment from Q2 FY10 to Q1 FY14.

© Copyright 2014, Cardinal Health. All rights reserved. CARDINAL HEALTH, the Cardinal Health LOGO and
ESSENTIAL TO CARE are trademarks or registered trademarks of Cardinal Health.
Returning cash to shareholders through
dividends and share repurchases
$900

+66%

$800
$700
$600
$500
$400

$ Millions

$300
$200
$100
$0

FY10

FY11
Dividends paid

9

FY12
Share repurchases

© Copyright 2014, Cardinal Health. All rights reserved. CARDINAL HEALTH, the Cardinal Health LOGO and
ESSENTIAL TO CARE are trademarks or registered trademarks of Cardinal Health.

FY13
Healthcare trends

Our priorities are driven by key trends
in the healthcare marketplace . . .
Demographics
and public
health issues
driving
demand

Care delivery
in more costeffective
settings

Increased
consumerism
in healthcare

Transition from
fee-for-service
to payment for
outcomes

Increased
participation of
government,
both as payor
and regulator

Continued innovation in healthcare

10

© Copyright 2014, Cardinal Health. All rights reserved. CARDINAL HEALTH, the Cardinal Health LOGO and
ESSENTIAL TO CARE are trademarks or registered trademarks of Cardinal Health.
Serving the full continuum of care
Surgery
centers

Clinics

Hospitals

Physician
offices

Continuum of care

11

Imaging
centers

Laboratories

© Copyright 2014, Cardinal Health. All rights reserved. CARDINAL HEALTH, the Cardinal Health LOGO and
ESSENTIAL TO CARE are trademarks or registered trademarks of Cardinal Health.

Retail
pharmacies

Home
Our strategic priorities:
Solutions for a system in transition
Generics
• Continue to build scale and capabilities
to deliver value in generics
• Tailored programs to a segmented
customer base

Specialty and biopharma
• Develop new models to address
changing market needs
• Enhance and build programs to create
value for providers and biopharma
manufacturers

International
• Expand in China, Canada and Puerto
Rico
• Continue to evaluate new markets

12

© Copyright 2014, Cardinal Health. All rights reserved. CARDINAL HEALTH, the Cardinal Health LOGO and
ESSENTIAL TO CARE are trademarks or registered trademarks of Cardinal Health.

Health system and
hospital solutions
• Reduce IDN pain points with scaled,
cost-saving solutions
– Physician preference products,
medical consumables
– Pharmacy solutions
• Explore additional services

Alternate sites of care
• Expand ability to serve physician
offices, ambulatory surgery
centers and the home
• Expand product lines and
services
CVS Caremark and Cardinal Health create largest generic sourcing entity
in the U.S. – the world’s largest generic drug market

▪

Largest U.S. pharmacy health care provider
with over $120 billion in revenue

▪

Focused on enhancing access to care, lowering
overall health care costs, and improving health
outcomes

▪

▪

Filled >1 billion prescriptions last year through
its retail and mail order pharmacies

▪

▪

Leading health care services company with
$101 billion in revenue
Focused on improving the cost-effectiveness
and efficiency of health care so providers can
focus on their patients
Serve more than 100,000 locations daily

Sourcing Joint Venture
50/50 U.S.-based joint venture; largest generics sourcing entity in the U.S.
Combines deep sourcing expertise of two leading companies
Joint venture sources and negotiates generic supply contracts for both companies
Joint venture will not take ownership of products or hold inventory on behalf of either company
Will maintain CVS Caremark and Cardinal Health’s leadership positions as they drive value
for customers, clients and shareholders in a capital-efficient manner

Generic Manufacturers negotiate with Sourcing Joint Venture
New entity will collaborate with generic manufacturers to develop innovative supply chain and
purchasing strategies
Both CVS Caremark and Cardinal Health will continue to manage their product orders and
logistics processes in the same way as they do today
We add value in Specialty by connecting
stakeholders to better serve patients
Payors
Integrating clinical
pathways with Specialty
Pharmacy will enable
payors and providers to
improve patient care while
reducing the cost of care

Providers
Proven 20+ year track
record in specialty
distribution, increasing
scale with community
specialists through
innovative offerings

14

Biopharma

Patient

© Copyright 2014, Cardinal Health. All rights reserved. CARDINAL HEALTH, the Cardinal Health LOGO and
ESSENTIAL TO CARE are trademarks or registered trademarks of Cardinal Health.

Investing in assets and
capabilities essential to
biopharma’s success in
the changing specialty
therapeutics market
International: China, growing into the future
Broaden geographic reach
– Expand from 10 to ~25 local wholesaling companies through
tuck-in acquisitions
– Expand from 29 to over 50 DTP specialty pharmacies

Expand direct-to-patient for chronic care
– Focus on disease-centric, patient support model

Invest in innovative healthcare solutions
– Hospital and retail pharmacy focused

Accelerate brand recognition

15

© Copyright 2014, Cardinal Health. All rights reserved. CARDINAL HEALTH, the Cardinal Health LOGO and
ESSENTIAL TO CARE are trademarks or registered trademarks of Cardinal Health.
Health systems and hospital solutions

Aligning in support of customer needs

1

Increasing the breadth of our consumable
product portfolio; more launches in Q1 than all
of last year

2 Launching solutions focused on reducing the
cost of physician preference items

Fracture fixation

3 Expanding our service offerings through new
launches and acquisitions

4 Providing a new platform for serving patients in
the home

16

© Copyright 2014, Cardinal Health. All rights reserved. CARDINAL HEALTH, the Cardinal Health LOGO and
ESSENTIAL TO CARE are trademarks or registered trademarks of Cardinal Health.
AssuraMed supports care in the Home;
Opportunities extend across care continuum

Cardinal Health

Edgepark® referral sources

DME

17

Pharmacies

Hospital
systems

Hospitals

Home
healthcare
agency

© Copyright 2014, Cardinal Health. All rights reserved. CARDINAL HEALTH, the Cardinal Health LOGO and
ESSENTIAL TO CARE are trademarks or registered trademarks of Cardinal Health.

Surgery
centers

Physician
offices

Payors
Strong portfolio driving growth
and positioning for the future

Specialty
Alternate sites of care
Health system services
Preferred products: physician preference
Preferred products: medical consumables
Targeted international
Generics excellence
Customer mix shift
FY10

18

FY11

FY12

FY13

FY14

© Copyright 2014, Cardinal Health. All rights reserved. CARDINAL HEALTH, the Cardinal Health LOGO and
ESSENTIAL TO CARE are trademarks or registered trademarks of Cardinal Health.

FY15

FY16

FY17
Our profile

Outstanding record of financial growth based
on strong execution and focus on the right
strategic priorities
Thoughtful deployment of capital and
substantial returns for shareholders
Positioned for future growth in an evolving
healthcare landscape

19

© Copyright 2014, Cardinal Health. All rights reserved. CARDINAL HEALTH, the Cardinal Health LOGO and
ESSENTIAL TO CARE are trademarks or registered trademarks of Cardinal Health.
Financial appendix

© Copyright 2014 Cardinal Health. All rights reserved. CARDINAL HEALTH, the Cardinal Health LOGO and
ESSENTIAL TO CARE are trademarks or registered trademarks of Cardinal Health.
Cardinal Health, Inc. and Subsidiaries
GAAP / Non-GAAP Reconciliation

(in millions, except per common share amounts)
GAAP
Restructuring and employee severance
Amortization and other acquisition-related costs
Impairments and loss on disposal of assets
Litigation (recoveries)/charges, net
Other Spin-Off costs
Gain on sale of CareFusion stock
Non-GAAP

GAAP
Restructuring and employee severance
Amortization and other acquisition-related costs
Impairments and loss on disposal of assets
Litigation (recoveries)/charges, net
Other Spin-Off costs
Gain on sale of CareFusion stock
Non-GAAP

GAAP
Restructuring and employee severance
Amortization and other acquisition-related costs
Impairments and loss on disposal of assets
Litigation (recoveries)/charges, net
Other Spin-Off costs
Gain on sale of CareFusion stock
Non-GAAP

GAAP
Restructuring and employee severance
Amortization and other acquisition-related costs
Impairments and loss on disposal of assets
Litigation (recoveries)/charges, net
Other Spin-Off Costs
Gain on sale of CareFusion stock
Non-GAAP

Operating
Earnings
$
996
71
158
859
(38)
$
2,046

$

$

$

$

$

$

1,792
21
33
21
(3)
2
1,866

1,514
15
90
9
6
10
1,644

1,307
91
18
29
(62)
11
1,394

Fiscal Year 2013
Operating Earnings Before
Provision
Earnings Earnings from Diluted EPS
Diluted EPS
Earnings
Incom e Taxes
for
from
Continuing
from
from Continuing
Grow th
and Discontinued
Incom e
Continuing
Operations
Continuing
Operations
Rate
Operations
Taxes
Operations Grow th Rate 1 Operations
Grow th Rate 2
(44)% $
888 $
553 $
335
(69)% $
0.97
(68)%
71
27
44
0.13
158
52
106
0.31
859
37
822
2.39
(38)
(15)
(23)
(0.07)
10 % $
1,938 $
654 $
1,284
15 % $
3.73
16 %

18 % $

13 % $

16 % $

18 % $

1% $

(3)% $

1,698 $
21
33
21
(3)
2
1,772 $

Fiscal Year 2012
628 $
1,070
8
13
9
24
8
13
(1)
(2)
1
1
653 $
1,119

1,518 $
15
90
9
6
10
(75)
1,573 $

Fiscal Year 2011
552 $
966
5
10
22
68
3
6
(1)
7
4
6
(75)
585 $
988

1,212 $
91
18
29
(62)
53
(45)
1,296 $

Fiscal Year 2010
625 $
587
32
59
6
12
(5)
34
(23)
(39)
(149)
202
(45)
486 $
810

11 % $

13 % $

65 % $

22 % $

(23)% $

(2)% $

3.06
0.04
0.07
0.04
(0.01)
3.21

2.74
0.03
0.19
0.02
0.02
0.02
(0.21)
2.80

1.62
0.16
0.03
0.09
(0.11)
0.56
(0.12)
2.24

12 %

15 %

69 %

25 %

(23)%

(2)%

1

The 3-year compound annual grow th rate for GAAP and non-GAAP earnings from continuing operations w as -9% and 14%, respectively.

2

The 3-year compound annual grow th rate for GAAP and non-GAAP diluted EPS from continuing operations w as -16% and 19%, respectively. Excluding the $0.18 related to a favorable
tax settlement in Q3 FY13, the 3-year compound annual grow th rate for GAAP and non-GAAP diluted EPS from continuing operations w as -21% and 17%, respectively.
The sum of the components may not equal the total due to rounding.
We apply varying tax rates depending on the item’s nature and tax jurisdiction w here it is incurred.
Cardinal Health, Inc. and Subsidiaries
GAAP / Non-GAAP Reconciliation

(in millions, except per common share amounts)
GAAP
Restructuring and employee severance
Amortization and other acquisition-related costs
Impairments and loss on disposal of assets
Litigation (recoveries)/charges, net
Non-GAAP

Second
Operating Earnings Before Provision
Earnings
Incom e Taxes
for
Operating Grow th and Discontinued Incom e
Earnings
Rate
Operations
Taxes
$
519
2% $
492 $
217
10
10
4
56
56
20
9
9
3
(15)
(15)
(5)
$
579
10 % $
552 $
239

$

(in millions, except per common share amounts)
GAAP
Restructuring and employee severance
Amortization and other acquisition-related costs
Impairments and loss on disposal of assets
Litigation (recoveries)/charges, net
Non-GAAP

Year-to-Date 2014
Operating Earnings Before Provision
Earnings
Earnings from
Earnings
Incom e Taxes
for
from
Continuing
Operating Grow th and Discontinued Incom e
Continuing
Operations
Earnings
Rate
Operations
Taxes
Operations
Grow th Rate
$
990
3% $
934 $
320
$
614
7%
20
20
7
13
105
105
38
67
9
9
3
6
(13)
(13)
(5)
(8)
$
1,111
12 % $
1,055 $
363
$
691
16 %

$

$

506
1
25
5
(12)
525

963
6
53
6
(34)
995

13 % $

11 % $

12 % $

8% $

483 $
1
25
5
(12)
502 $

Second Quarter 2013
180
$
303
1
9
16
5
(5)
(7)
185
$
317

GAAP
Restructuring and employee severance
Amortization and other acquisition-related costs
Impairments and loss on disposal of assets
Litigation (recoveries)/charges, net
Non-GAAP

GAAP
Restructuring and employee severance
Amortization and other acquisition-related costs
Impairments and loss on disposal of assets
Litigation (recoveries)/charges, net
Non-GAAP

$

Quarter 2014
Earnings
Earnings from
from
Continuing
Continuing
Operations
Operations
Grow th Rate
$
275
(9)%
6
36
6
(10)
$
313
(1)%

922 $
6
53
6
(34)
953 $

The sum of the components may not equal the total due to rounding.
We apply varying tax rates depending on the item’s nature and tax jurisdiction w here it is incurred.

Year-to-Date 2013
347
$
575
2
4
19
34
1
5
(14)
(20)
355
$
598

Diluted EPS
Diluted EPS
from
from Continuing
Continuing
Operations
Operations
Grow th Rate 1
$
0.79
(10)%
0.02
0.10
0.02
(0.03)
$
0.90
(3)%

15 % $

13 % $

0.88
0.05
0.01
(0.02)
0.93

16 %

15 %

Diluted EPS
Diluted EPS
from
from Continuing
Continuing
Operations
Operations
Grow th Rate
$
1.78
7%
0.04
0.19
0.02
(0.02)
$
2.00
15 %

15 % $

11 % $

1.67
0.01
0.10
0.01
(0.06)
1.74

16 %

13 %
Cardinal Health, Inc. and Subsidiaries
GAAP / Non-GAAP Reconciliation
Rolling Quarter
2013

2014
(in millions)
Revenue

$

GAAP operating earnings
Restructuring and employee severance
Amortization and other acquisition-related costs
Impairments and loss on disposal of assets
Litigation (recoveries)/charges, net
Other Spin-Off Costs
Non-GAAP operating earnings

$

GAAP operating earnings m argin rate
Non-GAAP operating earnings margin rate
3-year m argin expansion

$

96,735
1,023
85
209
863
(18)
2,163

2012

2011

Q1

Q4

Q3

Q2

Q1

Q4

Q3

Q2

Q1

Q4

Q3

Q2

Q1

$ 99,727

$ 101,093

$ 102,437

$ 104,803

$ 106,648

$ 107,552

$ 107,551

$ 106,705

$ 104,999

$ 102,644

$ 100,340

$ 98,612

$ 98,160

$

$

$

$

$

$

$

$

$

$

$

$

$

Q2

$

1.06 %
2.24 %
76bp

1,011
76
179
859
(15)
2,109
1.01 %
2.11 %

$

996
71
158
859
(38)
2,046
0.99 %
2.02 %

$

1,842
48
117
29
(37)
1,999
1.80 %
1.95 %

$

1,893
22
37
25
(34)
1
1,943
1.81 %
1.85 %

$

1,836
23
34
21
(22)
1
1,893
1.72 %
1.77 %

$

1,792
21
33
21
(3)
2
1,866
1.67 %
1.73 %

$

1,747
17
37
20
(9)
4
1,816
1.62 %
1.69 %

$

1,668
16
94
7
(4)
4
1,786
1.56 %
1.67 %

$

1,562
17
106
8
2
8
1,703
1.49 %
1.62 %

$

1,514
15
90
9
6
10
1,644
1.48 %
1.60 %

$

1,489
17
86
9
(22)
9
1,588
1.48 %
1.58 %

$

1,408
25
58
9
(29)
12
1,483
1.43 %
1.50 %

$

1,431
33
28
7
(60)
12
1,451
1.46 %
1.48 %

The sum of the components may not equal the total due to rounding.
Forw ard-Looking Non-GAAP Financial Measures
We present non-GAAP earnings from continuing operations (and presentations derived from these financial measures, including per share calculations) on a forw ard-looking basis. The most directly comparable forw ard-looking GAAP measures are
earnings from continuing operations. We are unable to provide a quantitative reconciliation of these forw ard-looking non-GAAP measures to the most directly comparable forw ard-looking GAAP measures because w e cannot reliably forecast
restructuring and employee severance, amortiztion and other acquisition-related costs, impairments and loss on disposal of assets and litigation (recoveries)/charges, net, w hich are difficult to predict and estimate and are primarily dependent on future
events. Please note that the unavailable reconciling items could significantly impact our future financial results.
Cardinal Health, Inc. and Subsidiaries
GAAP / Non-GAAP Reconciliation

(in millions)
Revenue

$

GAAP operating earnings
Restructuring and employee severance
Amortization and other acquisition-related costs
Impairments and loss on disposal of assets
Litigation (recoveries)/charges, net
Other Spin-Off Costs
Non-GAAP operating earnings

$

GAAP operating earnings m argin rate
Non-GAAP operating earnings m argin rate

The sum of the components may not equal the total due to rounding.

Fiscal Year
2012
2011

2013

$

101,093
996
71
158
859
(38)
2,046
0.99 %
2.02 %
29bp

$
$

$

107,552
1,792
21
33
21
(3)
2
1,866
1.67 %
1.73 %
13bp

2010

$

102,644

$

$

1,514
15
90
9
6
10
1,644

$

$

1.48 %
1.60 %
18bp

$

98,503
1,307
91
18
29
(62)
11
1,394
1.33 %
1.42 %
Cardinal Health, Inc. and Subsidiaries
Definitions
Non-GAAP Diluted EPS from Continuing Operations and grow th rate calculation1: non-GAAP earnings from continuing operations divided by diluted w eighted-average shares
outstanding.
Non-GAAP Earnings from Continuing Operations: earnings from continuing operations excluding (1) restructuring and employee severance2, (2) amortization and other acquisitionrelated costs 3, (3) impairments and loss on disposal of assets 4, (4) litigation (recoveries)/charges, net5, (5) Other Spin-Off Costs and (6) gain on sale of CareFusion stock, each net of tax.
Non-GAAP Operating Earnings: operating earnings excluding (1) restructuring and employee severance, (2) amortization and other acquisition-related costs, (3) impairments and loss
on disposal of assets, (4) litigation (recoveries)/charges, net and (5) Other Spin-Off Costs.
Non-GAAP Operating Earnings Margin Rate: non-GAAP operating earnings divided by revenue.
Other Spin-Off Costs: costs incurred in connection w ith our Spin-Off of CareFusion w hich are included in distribution, selling, general and administrative expenses.
Segm ent Profit: segment revenue minus (segment cost of products sold and segment distribution, selling, general and administrative expenses).
Segm ent Profit from International6: international revenue minus (international cost of products sold and international distribution, selling, general and administrative expenses).
Segm ent Profit Margin: segment profit divided by segment revenue.
1

Except for compound annual grow th rates (CAGR), grow th rates in this presentation are determined by dividing the difference betw een current period results and prior period results by
prior period results. CAGR is determined by subtracting one from ((the ending value divided by the beginning value) raised to the pow er of (one divided by the number of years)).

2

Programs w hereby Cardinal Health fundamentally changes its operations such as closing and consolidating facilities, moving manufacturing of a product to another location, production or
business process sourcing, employee severance (including rationalizing headcount or other significant changes in personnel) and realigning operations (including substantial realignment
of the management structure of a business unit in response to changing market conditions).

3

Costs that consist primarily of amortization of acquisition-related intangible assets, transaction costs, integration costs and changes in the fair value of contingent consideration obligations.

4

Asset impairments and losses from the disposal of assets not eligible to be classified as discontinued operations are classified w ithin impairments and loss on disposal of assets w ithin the
consolidated statements of earnings.

5

Loss contingencies related to litigation and regulatory matters and income from favorable resolution of legal matters.

6

Includes CAH Puerto Rico and our non-U.S. operations.

Raymond james presentation 03 04 2014

  • 1.
    Cardinal Health: Well-balanced. Well-prepared.Well-focused. Jeff Henderson Chief Financial Officer Raymond James Institutional Investors Conference, March 4, 2014 © Copyright 2014, Cardinal Health. All rights reserved. CARDINAL HEALTH, the Cardinal Health LOGO and ESSENTIAL TO CARE are trademarks or registered trademarks of Cardinal Health.
  • 2.
    Cautions concerning forward-lookingstatements Today’s presentation contains forward-looking statements addressing expectations, prospects, estimates and other matters that are dependent upon future events or developments. These statements may be identified by words such as "expect," "anticipate," "intend," "plan," "believe," "will," "should," "could," "would," "project," "continue," "likely," and similar expressions, and include statements reflecting future results or guidance, statements of outlook and expense accruals. These matters are subject to risks and uncertainties that could cause actual results to differ materially from those projected, anticipated or implied. These risks and uncertainties include competitive pressures in Cardinal Health's various lines of business; the ability to achieve the expected benefits from the generic sourcing joint venture with CVS Caremark; the timing of generic and branded pharmaceutical introductions and the frequency or rate of pharmaceutical price appreciation or deflation; the non-renewal, early termination or a default under one or more key customer or supplier arrangements or changes to the terms of or level of purchases under those arrangements; uncertainties due to government health care reform including federal health care reform legislation; changes in the distribution patterns or reimbursement rates for health care products and services; the effects of any investigation or action by any regulatory authority; and changes in the cost of commodities such as oil-based resins, cotton, latex and diesel fuel. Cardinal Health is subject to additional risks and uncertainties described in Cardinal Health's Form 10-K, Form 10-Q and Form 8-K reports and exhibits to those reports. These presentations reflect management's views as of March 4, 2014. Except to the extent required by applicable law, Cardinal Health undertakes no obligation to update or revise any forward-looking statement. In addition, these presentations contain Non-GAAP financial measures. Cardinal Health provides GAAP numbers, definitions and reconciling information in the Financial Appendix at the end of these presentations and on its Investors page at www.cardinalhealth.com. An audio replay of this presentation will be available on the Investors page at www.cardinalhealth.com. 2 © Copyright 2014, Cardinal Health. All rights reserved. CARDINAL HEALTH, the Cardinal Health LOGO and ESSENTIAL TO CARE are trademarks or registered trademarks of Cardinal Health.
  • 3.
    Our profile Outstanding recordof financial growth based on strong execution and focus on the right strategic priorities Thoughtful deployment of capital and substantial returns for shareholders Positioned for future growth in an evolving healthcare landscape 3 © Copyright 2014, Cardinal Health. All rights reserved. CARDINAL HEALTH, the Cardinal Health LOGO and ESSENTIAL TO CARE are trademarks or registered trademarks of Cardinal Health.
  • 4.
    Our proven trackrecord of success What we told you in Dec. 2010 Long-term non-GAAP EPS1 growth at least double digit Modified TSR ≥ 11% (Non-GAAP EPS1 growth + dividend yield) What we delivered 18.5% CAGR2 21.1%3 Gross margin expansion (TTM) Non-GAAP operating margin expansion (TTM) +76bps Dividend payout increase4 4 +141bps +4.0pp Unless otherwise noted, the actuals presented above reflect the period of Q1FY11 – Q2FY14 1 Non-GAAP diluted earnings per share from continuing operations; Please see appendix for definitions and reconciling information. 2 FY10 – FY13 3 Modified TSR calculated using FY10 – FY13 non-GAAP EPS CAGR plus 2.6% dividend yield on 6/30/2013. 4 Dividend payout increase from FY11 – FY14, using current dividend rate and midpoint of FY14 non-GAAP EPS © Copyright 2014, Cardinal Health. All rights reserved. CARDINAL HEALTH, the Cardinal Health LOGO and guidance range are trademarks or registered trademarks of Cardinal Health. ESSENTIAL TO CAREof $3.75 to $3.85.
  • 5.
    Driving consistent operating marginexpansion Non-GAAP operating earnings as a percent of revenue (TTM) 2.4% 2.2% 2.0% 1.8% 1.6% 1.4% Q1 Q2 Q3 2011 Q4 Q1 Q2 Q3 Q4 2012 Please see appendix for GAAP/non-GAAP definitions and reconciling information. 5 © Copyright 2014, Cardinal Health. All rights reserved. CARDINAL HEALTH, the Cardinal Health LOGO and ESSENTIAL TO CARE are trademarks or registered trademarks of Cardinal Health. Q1 Q2 Q3 2013 Q4 Q1 Q2 2014
  • 6.
    Non-GAAP operating earnings: Historicaltrend (In millions) $2,046 $1,866 $1,644 $1,394 FY10 6 FY11 © Copyright 2014, Cardinal Health. All rights reserved. CARDINAL HEALTH, the Cardinal Health LOGO and ESSENTIAL TO CARE are trademarks or registered trademarks of Cardinal Health. FY12 FY13
  • 7.
    Non-GAAP EPS1: Historicaltrend $3.73 $3.21 Includes $0.18 favorable tax settlement $2.80 $2.24 FY10 1 7 FY11 Non-GAAP diluted earnings per share from continuing operations. Please see appendix for definitions and reconciling information. © Copyright 2014, Cardinal Health. All rights reserved. CARDINAL HEALTH, the Cardinal Health LOGO and ESSENTIAL TO CARE are trademarks or registered trademarks of Cardinal Health. FY12 FY13
  • 8.
    Thoughtful capital deploymentapproach Capital deployment post CareFusion spin1 Dividends Capital expenditures Share repurchases Acquisitions, net of diverstures 1 8 Capital deployment from Q2 FY10 to Q1 FY14. © Copyright 2014, Cardinal Health. All rights reserved. CARDINAL HEALTH, the Cardinal Health LOGO and ESSENTIAL TO CARE are trademarks or registered trademarks of Cardinal Health.
  • 9.
    Returning cash toshareholders through dividends and share repurchases $900 +66% $800 $700 $600 $500 $400 $ Millions $300 $200 $100 $0 FY10 FY11 Dividends paid 9 FY12 Share repurchases © Copyright 2014, Cardinal Health. All rights reserved. CARDINAL HEALTH, the Cardinal Health LOGO and ESSENTIAL TO CARE are trademarks or registered trademarks of Cardinal Health. FY13
  • 10.
    Healthcare trends Our prioritiesare driven by key trends in the healthcare marketplace . . . Demographics and public health issues driving demand Care delivery in more costeffective settings Increased consumerism in healthcare Transition from fee-for-service to payment for outcomes Increased participation of government, both as payor and regulator Continued innovation in healthcare 10 © Copyright 2014, Cardinal Health. All rights reserved. CARDINAL HEALTH, the Cardinal Health LOGO and ESSENTIAL TO CARE are trademarks or registered trademarks of Cardinal Health.
  • 11.
    Serving the fullcontinuum of care Surgery centers Clinics Hospitals Physician offices Continuum of care 11 Imaging centers Laboratories © Copyright 2014, Cardinal Health. All rights reserved. CARDINAL HEALTH, the Cardinal Health LOGO and ESSENTIAL TO CARE are trademarks or registered trademarks of Cardinal Health. Retail pharmacies Home
  • 12.
    Our strategic priorities: Solutionsfor a system in transition Generics • Continue to build scale and capabilities to deliver value in generics • Tailored programs to a segmented customer base Specialty and biopharma • Develop new models to address changing market needs • Enhance and build programs to create value for providers and biopharma manufacturers International • Expand in China, Canada and Puerto Rico • Continue to evaluate new markets 12 © Copyright 2014, Cardinal Health. All rights reserved. CARDINAL HEALTH, the Cardinal Health LOGO and ESSENTIAL TO CARE are trademarks or registered trademarks of Cardinal Health. Health system and hospital solutions • Reduce IDN pain points with scaled, cost-saving solutions – Physician preference products, medical consumables – Pharmacy solutions • Explore additional services Alternate sites of care • Expand ability to serve physician offices, ambulatory surgery centers and the home • Expand product lines and services
  • 13.
    CVS Caremark andCardinal Health create largest generic sourcing entity in the U.S. – the world’s largest generic drug market ▪ Largest U.S. pharmacy health care provider with over $120 billion in revenue ▪ Focused on enhancing access to care, lowering overall health care costs, and improving health outcomes ▪ ▪ Filled >1 billion prescriptions last year through its retail and mail order pharmacies ▪ ▪ Leading health care services company with $101 billion in revenue Focused on improving the cost-effectiveness and efficiency of health care so providers can focus on their patients Serve more than 100,000 locations daily Sourcing Joint Venture 50/50 U.S.-based joint venture; largest generics sourcing entity in the U.S. Combines deep sourcing expertise of two leading companies Joint venture sources and negotiates generic supply contracts for both companies Joint venture will not take ownership of products or hold inventory on behalf of either company Will maintain CVS Caremark and Cardinal Health’s leadership positions as they drive value for customers, clients and shareholders in a capital-efficient manner Generic Manufacturers negotiate with Sourcing Joint Venture New entity will collaborate with generic manufacturers to develop innovative supply chain and purchasing strategies Both CVS Caremark and Cardinal Health will continue to manage their product orders and logistics processes in the same way as they do today
  • 14.
    We add valuein Specialty by connecting stakeholders to better serve patients Payors Integrating clinical pathways with Specialty Pharmacy will enable payors and providers to improve patient care while reducing the cost of care Providers Proven 20+ year track record in specialty distribution, increasing scale with community specialists through innovative offerings 14 Biopharma Patient © Copyright 2014, Cardinal Health. All rights reserved. CARDINAL HEALTH, the Cardinal Health LOGO and ESSENTIAL TO CARE are trademarks or registered trademarks of Cardinal Health. Investing in assets and capabilities essential to biopharma’s success in the changing specialty therapeutics market
  • 15.
    International: China, growinginto the future Broaden geographic reach – Expand from 10 to ~25 local wholesaling companies through tuck-in acquisitions – Expand from 29 to over 50 DTP specialty pharmacies Expand direct-to-patient for chronic care – Focus on disease-centric, patient support model Invest in innovative healthcare solutions – Hospital and retail pharmacy focused Accelerate brand recognition 15 © Copyright 2014, Cardinal Health. All rights reserved. CARDINAL HEALTH, the Cardinal Health LOGO and ESSENTIAL TO CARE are trademarks or registered trademarks of Cardinal Health.
  • 16.
    Health systems andhospital solutions Aligning in support of customer needs 1 Increasing the breadth of our consumable product portfolio; more launches in Q1 than all of last year 2 Launching solutions focused on reducing the cost of physician preference items Fracture fixation 3 Expanding our service offerings through new launches and acquisitions 4 Providing a new platform for serving patients in the home 16 © Copyright 2014, Cardinal Health. All rights reserved. CARDINAL HEALTH, the Cardinal Health LOGO and ESSENTIAL TO CARE are trademarks or registered trademarks of Cardinal Health.
  • 17.
    AssuraMed supports carein the Home; Opportunities extend across care continuum Cardinal Health Edgepark® referral sources DME 17 Pharmacies Hospital systems Hospitals Home healthcare agency © Copyright 2014, Cardinal Health. All rights reserved. CARDINAL HEALTH, the Cardinal Health LOGO and ESSENTIAL TO CARE are trademarks or registered trademarks of Cardinal Health. Surgery centers Physician offices Payors
  • 18.
    Strong portfolio drivinggrowth and positioning for the future Specialty Alternate sites of care Health system services Preferred products: physician preference Preferred products: medical consumables Targeted international Generics excellence Customer mix shift FY10 18 FY11 FY12 FY13 FY14 © Copyright 2014, Cardinal Health. All rights reserved. CARDINAL HEALTH, the Cardinal Health LOGO and ESSENTIAL TO CARE are trademarks or registered trademarks of Cardinal Health. FY15 FY16 FY17
  • 19.
    Our profile Outstanding recordof financial growth based on strong execution and focus on the right strategic priorities Thoughtful deployment of capital and substantial returns for shareholders Positioned for future growth in an evolving healthcare landscape 19 © Copyright 2014, Cardinal Health. All rights reserved. CARDINAL HEALTH, the Cardinal Health LOGO and ESSENTIAL TO CARE are trademarks or registered trademarks of Cardinal Health.
  • 20.
    Financial appendix © Copyright2014 Cardinal Health. All rights reserved. CARDINAL HEALTH, the Cardinal Health LOGO and ESSENTIAL TO CARE are trademarks or registered trademarks of Cardinal Health.
  • 21.
    Cardinal Health, Inc.and Subsidiaries GAAP / Non-GAAP Reconciliation (in millions, except per common share amounts) GAAP Restructuring and employee severance Amortization and other acquisition-related costs Impairments and loss on disposal of assets Litigation (recoveries)/charges, net Other Spin-Off costs Gain on sale of CareFusion stock Non-GAAP GAAP Restructuring and employee severance Amortization and other acquisition-related costs Impairments and loss on disposal of assets Litigation (recoveries)/charges, net Other Spin-Off costs Gain on sale of CareFusion stock Non-GAAP GAAP Restructuring and employee severance Amortization and other acquisition-related costs Impairments and loss on disposal of assets Litigation (recoveries)/charges, net Other Spin-Off costs Gain on sale of CareFusion stock Non-GAAP GAAP Restructuring and employee severance Amortization and other acquisition-related costs Impairments and loss on disposal of assets Litigation (recoveries)/charges, net Other Spin-Off Costs Gain on sale of CareFusion stock Non-GAAP Operating Earnings $ 996 71 158 859 (38) $ 2,046 $ $ $ $ $ $ 1,792 21 33 21 (3) 2 1,866 1,514 15 90 9 6 10 1,644 1,307 91 18 29 (62) 11 1,394 Fiscal Year 2013 Operating Earnings Before Provision Earnings Earnings from Diluted EPS Diluted EPS Earnings Incom e Taxes for from Continuing from from Continuing Grow th and Discontinued Incom e Continuing Operations Continuing Operations Rate Operations Taxes Operations Grow th Rate 1 Operations Grow th Rate 2 (44)% $ 888 $ 553 $ 335 (69)% $ 0.97 (68)% 71 27 44 0.13 158 52 106 0.31 859 37 822 2.39 (38) (15) (23) (0.07) 10 % $ 1,938 $ 654 $ 1,284 15 % $ 3.73 16 % 18 % $ 13 % $ 16 % $ 18 % $ 1% $ (3)% $ 1,698 $ 21 33 21 (3) 2 1,772 $ Fiscal Year 2012 628 $ 1,070 8 13 9 24 8 13 (1) (2) 1 1 653 $ 1,119 1,518 $ 15 90 9 6 10 (75) 1,573 $ Fiscal Year 2011 552 $ 966 5 10 22 68 3 6 (1) 7 4 6 (75) 585 $ 988 1,212 $ 91 18 29 (62) 53 (45) 1,296 $ Fiscal Year 2010 625 $ 587 32 59 6 12 (5) 34 (23) (39) (149) 202 (45) 486 $ 810 11 % $ 13 % $ 65 % $ 22 % $ (23)% $ (2)% $ 3.06 0.04 0.07 0.04 (0.01) 3.21 2.74 0.03 0.19 0.02 0.02 0.02 (0.21) 2.80 1.62 0.16 0.03 0.09 (0.11) 0.56 (0.12) 2.24 12 % 15 % 69 % 25 % (23)% (2)% 1 The 3-year compound annual grow th rate for GAAP and non-GAAP earnings from continuing operations w as -9% and 14%, respectively. 2 The 3-year compound annual grow th rate for GAAP and non-GAAP diluted EPS from continuing operations w as -16% and 19%, respectively. Excluding the $0.18 related to a favorable tax settlement in Q3 FY13, the 3-year compound annual grow th rate for GAAP and non-GAAP diluted EPS from continuing operations w as -21% and 17%, respectively. The sum of the components may not equal the total due to rounding. We apply varying tax rates depending on the item’s nature and tax jurisdiction w here it is incurred.
  • 22.
    Cardinal Health, Inc.and Subsidiaries GAAP / Non-GAAP Reconciliation (in millions, except per common share amounts) GAAP Restructuring and employee severance Amortization and other acquisition-related costs Impairments and loss on disposal of assets Litigation (recoveries)/charges, net Non-GAAP Second Operating Earnings Before Provision Earnings Incom e Taxes for Operating Grow th and Discontinued Incom e Earnings Rate Operations Taxes $ 519 2% $ 492 $ 217 10 10 4 56 56 20 9 9 3 (15) (15) (5) $ 579 10 % $ 552 $ 239 $ (in millions, except per common share amounts) GAAP Restructuring and employee severance Amortization and other acquisition-related costs Impairments and loss on disposal of assets Litigation (recoveries)/charges, net Non-GAAP Year-to-Date 2014 Operating Earnings Before Provision Earnings Earnings from Earnings Incom e Taxes for from Continuing Operating Grow th and Discontinued Incom e Continuing Operations Earnings Rate Operations Taxes Operations Grow th Rate $ 990 3% $ 934 $ 320 $ 614 7% 20 20 7 13 105 105 38 67 9 9 3 6 (13) (13) (5) (8) $ 1,111 12 % $ 1,055 $ 363 $ 691 16 % $ $ 506 1 25 5 (12) 525 963 6 53 6 (34) 995 13 % $ 11 % $ 12 % $ 8% $ 483 $ 1 25 5 (12) 502 $ Second Quarter 2013 180 $ 303 1 9 16 5 (5) (7) 185 $ 317 GAAP Restructuring and employee severance Amortization and other acquisition-related costs Impairments and loss on disposal of assets Litigation (recoveries)/charges, net Non-GAAP GAAP Restructuring and employee severance Amortization and other acquisition-related costs Impairments and loss on disposal of assets Litigation (recoveries)/charges, net Non-GAAP $ Quarter 2014 Earnings Earnings from from Continuing Continuing Operations Operations Grow th Rate $ 275 (9)% 6 36 6 (10) $ 313 (1)% 922 $ 6 53 6 (34) 953 $ The sum of the components may not equal the total due to rounding. We apply varying tax rates depending on the item’s nature and tax jurisdiction w here it is incurred. Year-to-Date 2013 347 $ 575 2 4 19 34 1 5 (14) (20) 355 $ 598 Diluted EPS Diluted EPS from from Continuing Continuing Operations Operations Grow th Rate 1 $ 0.79 (10)% 0.02 0.10 0.02 (0.03) $ 0.90 (3)% 15 % $ 13 % $ 0.88 0.05 0.01 (0.02) 0.93 16 % 15 % Diluted EPS Diluted EPS from from Continuing Continuing Operations Operations Grow th Rate $ 1.78 7% 0.04 0.19 0.02 (0.02) $ 2.00 15 % 15 % $ 11 % $ 1.67 0.01 0.10 0.01 (0.06) 1.74 16 % 13 %
  • 23.
    Cardinal Health, Inc.and Subsidiaries GAAP / Non-GAAP Reconciliation Rolling Quarter 2013 2014 (in millions) Revenue $ GAAP operating earnings Restructuring and employee severance Amortization and other acquisition-related costs Impairments and loss on disposal of assets Litigation (recoveries)/charges, net Other Spin-Off Costs Non-GAAP operating earnings $ GAAP operating earnings m argin rate Non-GAAP operating earnings margin rate 3-year m argin expansion $ 96,735 1,023 85 209 863 (18) 2,163 2012 2011 Q1 Q4 Q3 Q2 Q1 Q4 Q3 Q2 Q1 Q4 Q3 Q2 Q1 $ 99,727 $ 101,093 $ 102,437 $ 104,803 $ 106,648 $ 107,552 $ 107,551 $ 106,705 $ 104,999 $ 102,644 $ 100,340 $ 98,612 $ 98,160 $ $ $ $ $ $ $ $ $ $ $ $ $ Q2 $ 1.06 % 2.24 % 76bp 1,011 76 179 859 (15) 2,109 1.01 % 2.11 % $ 996 71 158 859 (38) 2,046 0.99 % 2.02 % $ 1,842 48 117 29 (37) 1,999 1.80 % 1.95 % $ 1,893 22 37 25 (34) 1 1,943 1.81 % 1.85 % $ 1,836 23 34 21 (22) 1 1,893 1.72 % 1.77 % $ 1,792 21 33 21 (3) 2 1,866 1.67 % 1.73 % $ 1,747 17 37 20 (9) 4 1,816 1.62 % 1.69 % $ 1,668 16 94 7 (4) 4 1,786 1.56 % 1.67 % $ 1,562 17 106 8 2 8 1,703 1.49 % 1.62 % $ 1,514 15 90 9 6 10 1,644 1.48 % 1.60 % $ 1,489 17 86 9 (22) 9 1,588 1.48 % 1.58 % $ 1,408 25 58 9 (29) 12 1,483 1.43 % 1.50 % $ 1,431 33 28 7 (60) 12 1,451 1.46 % 1.48 % The sum of the components may not equal the total due to rounding. Forw ard-Looking Non-GAAP Financial Measures We present non-GAAP earnings from continuing operations (and presentations derived from these financial measures, including per share calculations) on a forw ard-looking basis. The most directly comparable forw ard-looking GAAP measures are earnings from continuing operations. We are unable to provide a quantitative reconciliation of these forw ard-looking non-GAAP measures to the most directly comparable forw ard-looking GAAP measures because w e cannot reliably forecast restructuring and employee severance, amortiztion and other acquisition-related costs, impairments and loss on disposal of assets and litigation (recoveries)/charges, net, w hich are difficult to predict and estimate and are primarily dependent on future events. Please note that the unavailable reconciling items could significantly impact our future financial results.
  • 24.
    Cardinal Health, Inc.and Subsidiaries GAAP / Non-GAAP Reconciliation (in millions) Revenue $ GAAP operating earnings Restructuring and employee severance Amortization and other acquisition-related costs Impairments and loss on disposal of assets Litigation (recoveries)/charges, net Other Spin-Off Costs Non-GAAP operating earnings $ GAAP operating earnings m argin rate Non-GAAP operating earnings m argin rate The sum of the components may not equal the total due to rounding. Fiscal Year 2012 2011 2013 $ 101,093 996 71 158 859 (38) 2,046 0.99 % 2.02 % 29bp $ $ $ 107,552 1,792 21 33 21 (3) 2 1,866 1.67 % 1.73 % 13bp 2010 $ 102,644 $ $ 1,514 15 90 9 6 10 1,644 $ $ 1.48 % 1.60 % 18bp $ 98,503 1,307 91 18 29 (62) 11 1,394 1.33 % 1.42 %
  • 25.
    Cardinal Health, Inc.and Subsidiaries Definitions Non-GAAP Diluted EPS from Continuing Operations and grow th rate calculation1: non-GAAP earnings from continuing operations divided by diluted w eighted-average shares outstanding. Non-GAAP Earnings from Continuing Operations: earnings from continuing operations excluding (1) restructuring and employee severance2, (2) amortization and other acquisitionrelated costs 3, (3) impairments and loss on disposal of assets 4, (4) litigation (recoveries)/charges, net5, (5) Other Spin-Off Costs and (6) gain on sale of CareFusion stock, each net of tax. Non-GAAP Operating Earnings: operating earnings excluding (1) restructuring and employee severance, (2) amortization and other acquisition-related costs, (3) impairments and loss on disposal of assets, (4) litigation (recoveries)/charges, net and (5) Other Spin-Off Costs. Non-GAAP Operating Earnings Margin Rate: non-GAAP operating earnings divided by revenue. Other Spin-Off Costs: costs incurred in connection w ith our Spin-Off of CareFusion w hich are included in distribution, selling, general and administrative expenses. Segm ent Profit: segment revenue minus (segment cost of products sold and segment distribution, selling, general and administrative expenses). Segm ent Profit from International6: international revenue minus (international cost of products sold and international distribution, selling, general and administrative expenses). Segm ent Profit Margin: segment profit divided by segment revenue. 1 Except for compound annual grow th rates (CAGR), grow th rates in this presentation are determined by dividing the difference betw een current period results and prior period results by prior period results. CAGR is determined by subtracting one from ((the ending value divided by the beginning value) raised to the pow er of (one divided by the number of years)). 2 Programs w hereby Cardinal Health fundamentally changes its operations such as closing and consolidating facilities, moving manufacturing of a product to another location, production or business process sourcing, employee severance (including rationalizing headcount or other significant changes in personnel) and realigning operations (including substantial realignment of the management structure of a business unit in response to changing market conditions). 3 Costs that consist primarily of amortization of acquisition-related intangible assets, transaction costs, integration costs and changes in the fair value of contingent consideration obligations. 4 Asset impairments and losses from the disposal of assets not eligible to be classified as discontinued operations are classified w ithin impairments and loss on disposal of assets w ithin the consolidated statements of earnings. 5 Loss contingencies related to litigation and regulatory matters and income from favorable resolution of legal matters. 6 Includes CAH Puerto Rico and our non-U.S. operations.