Downloaded 52 times
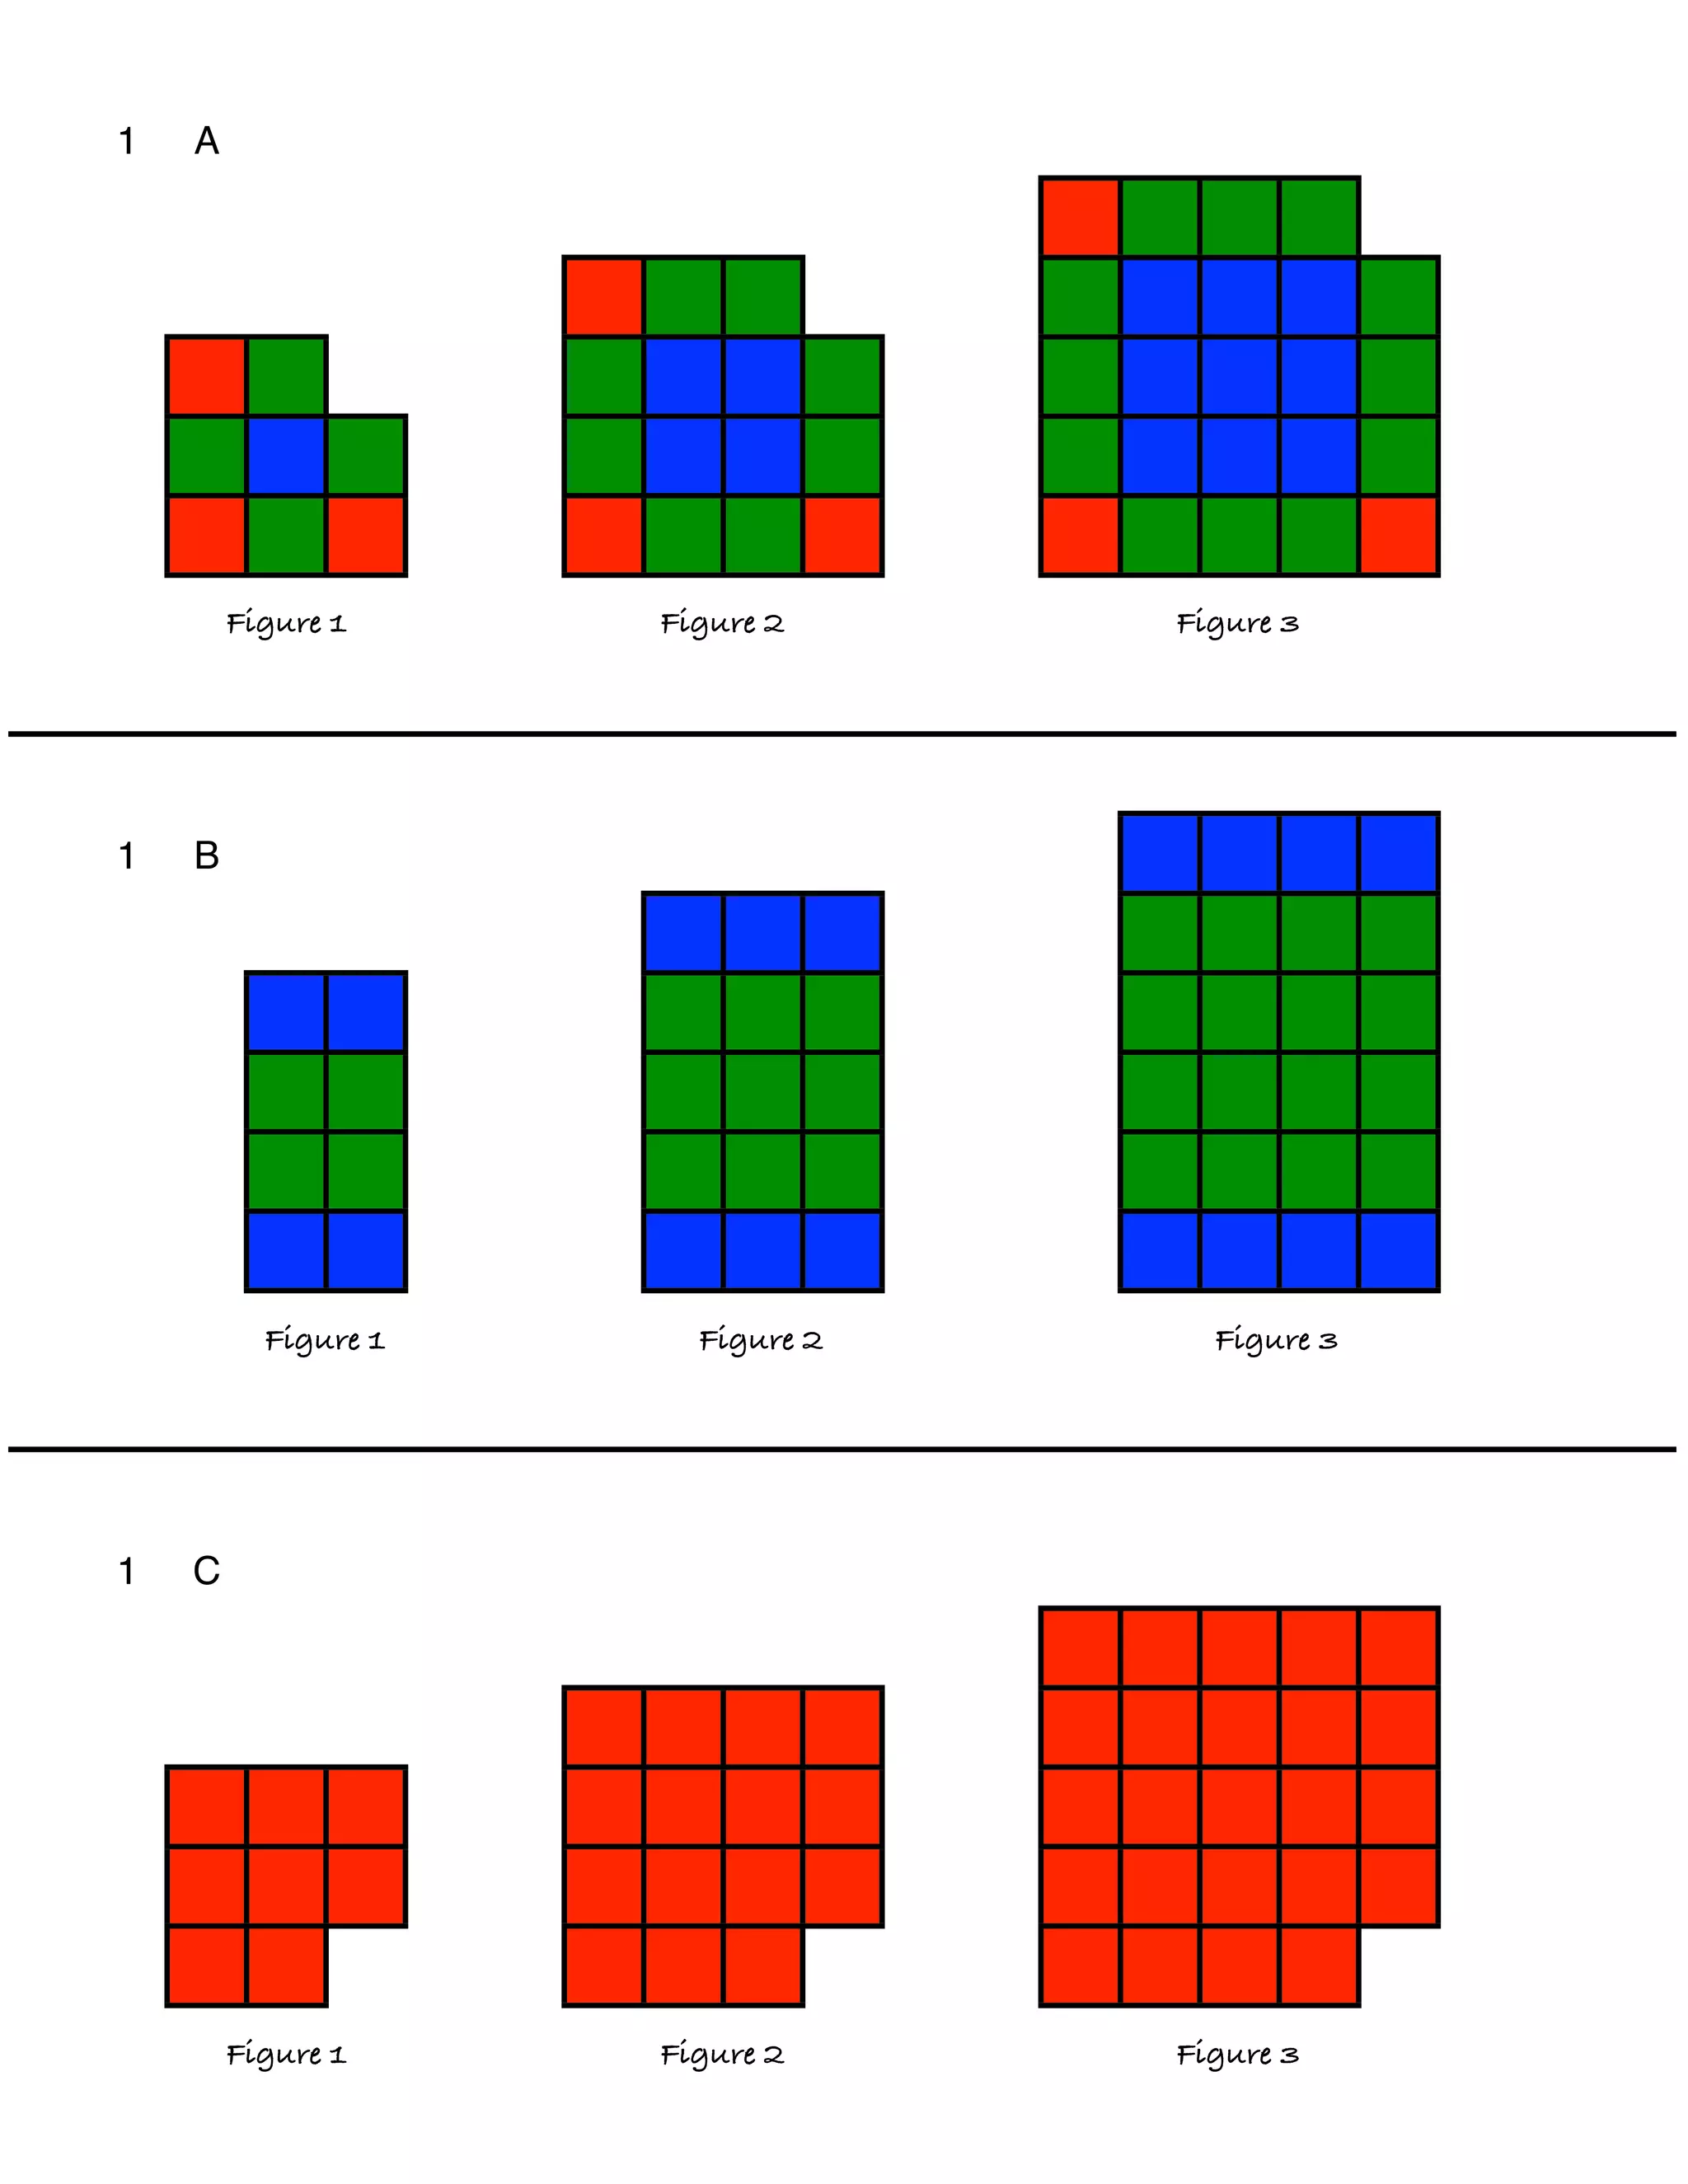
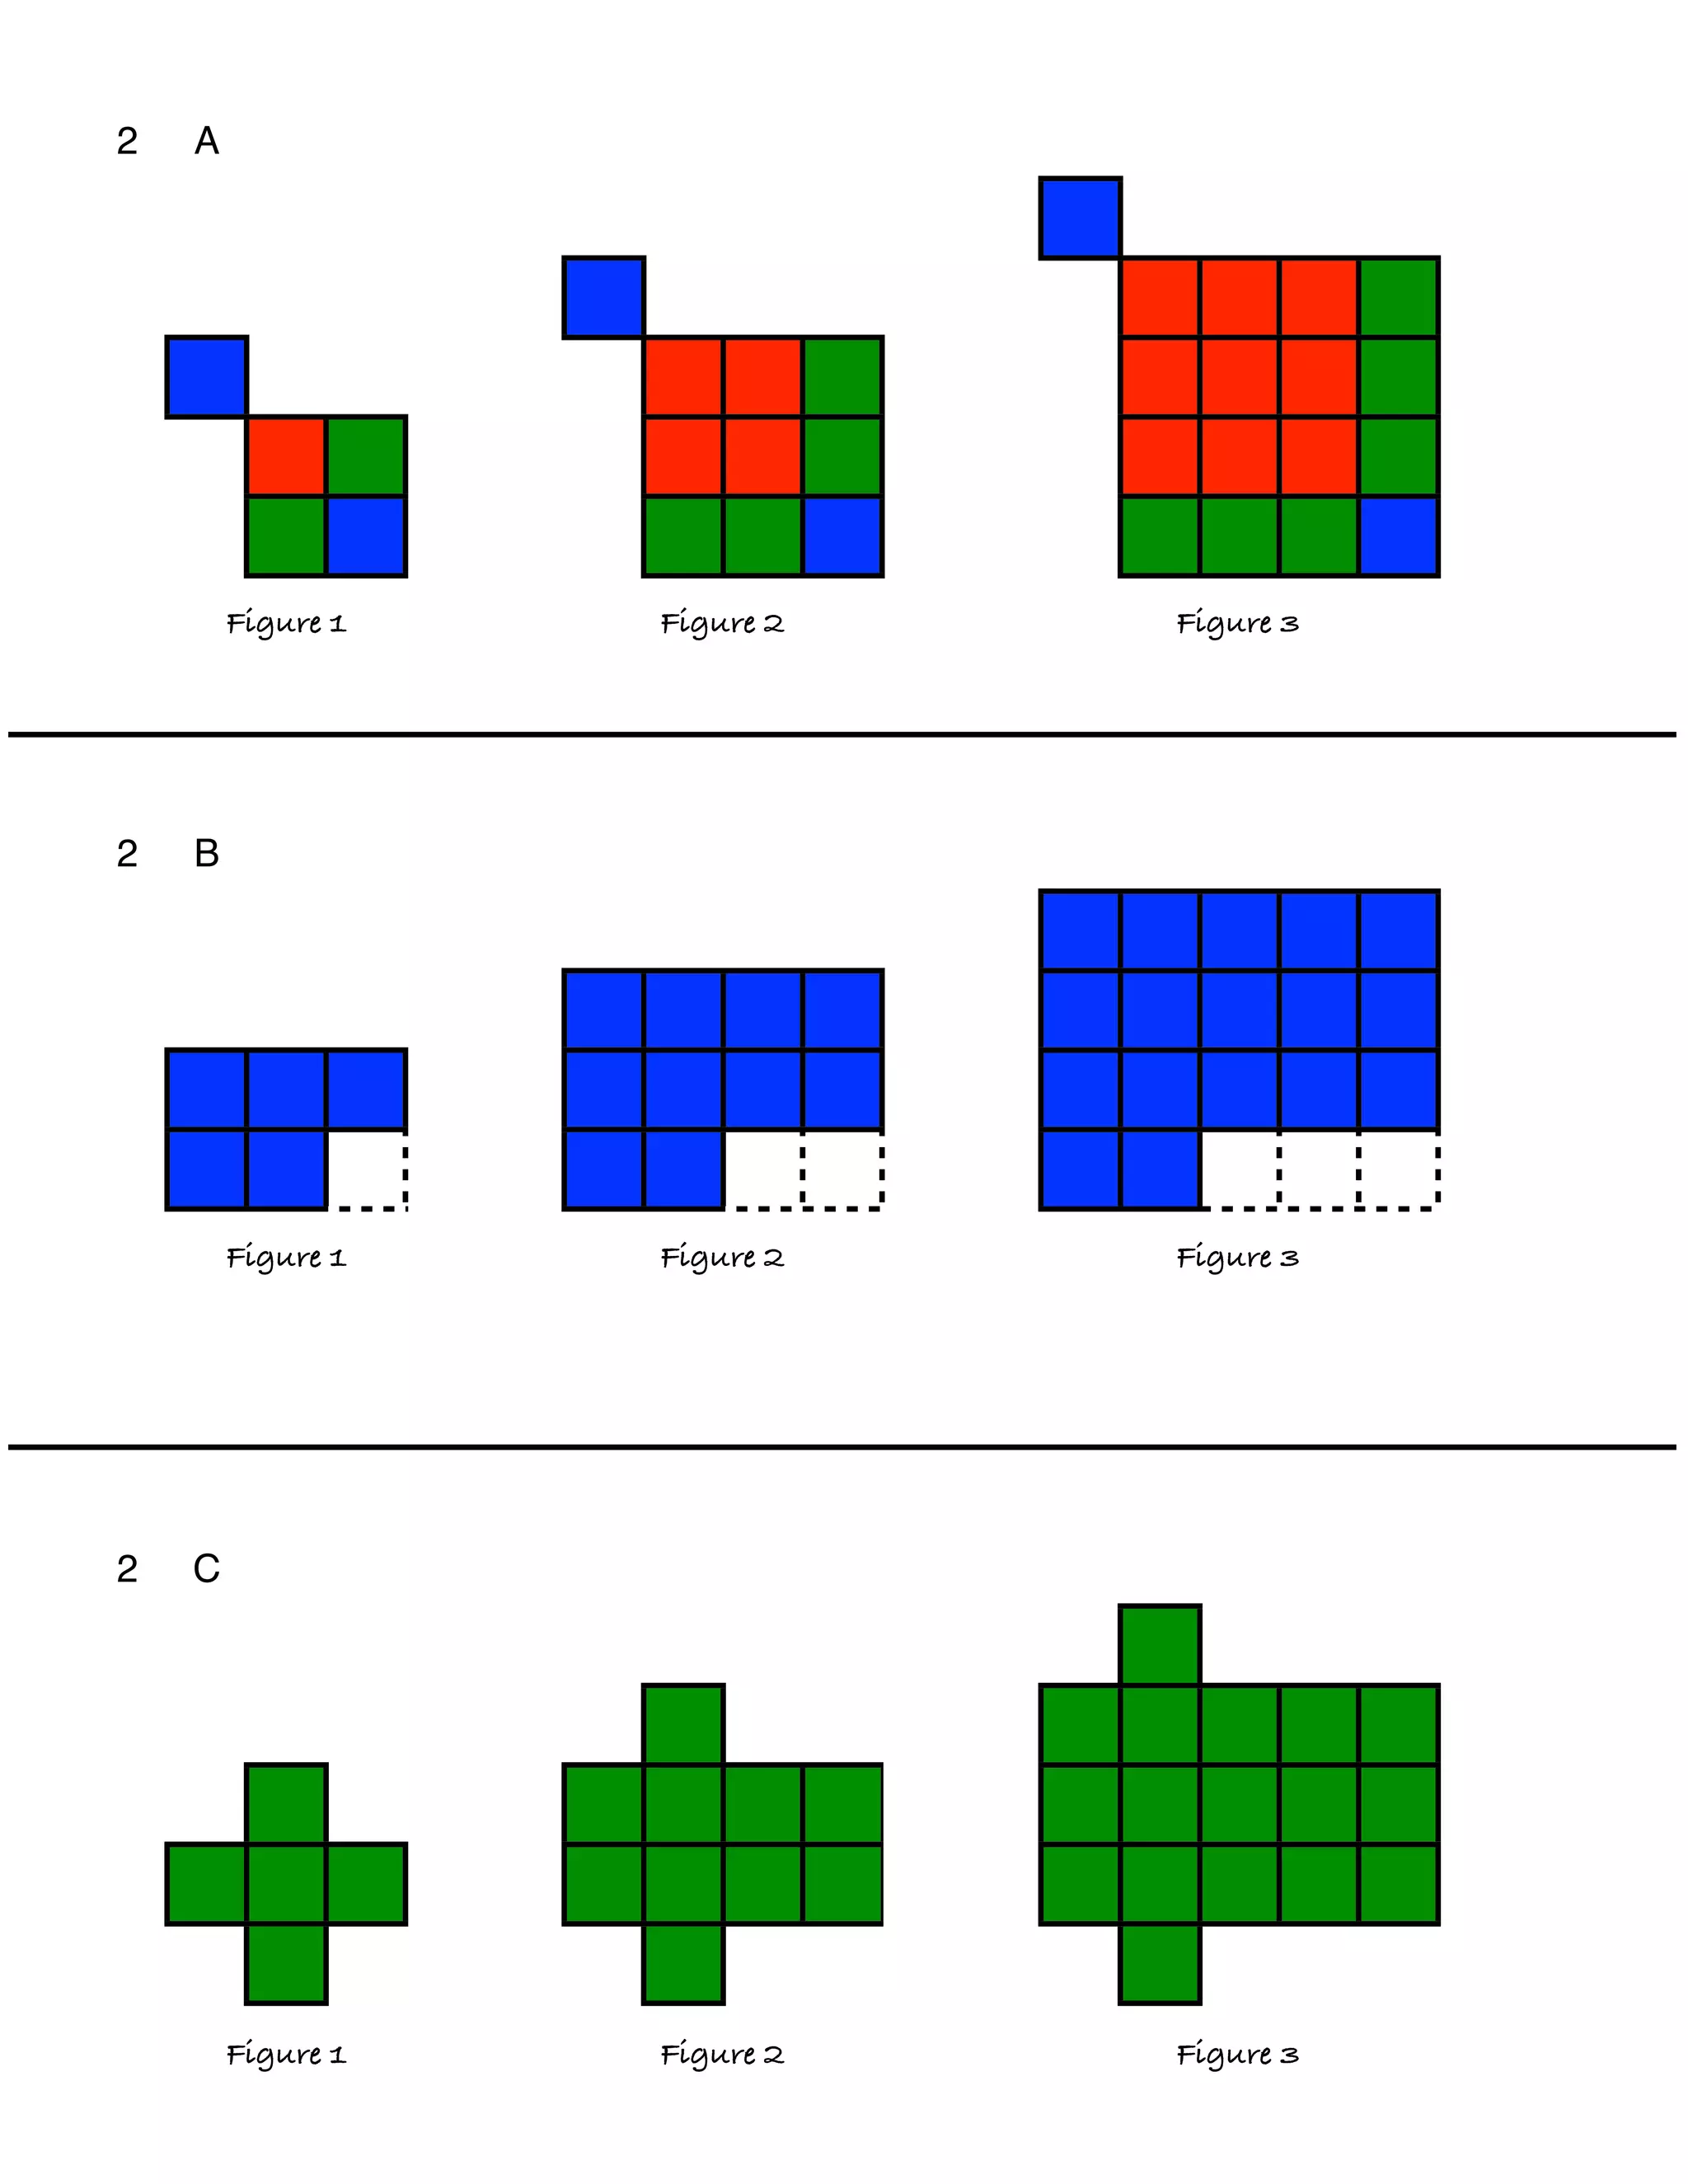
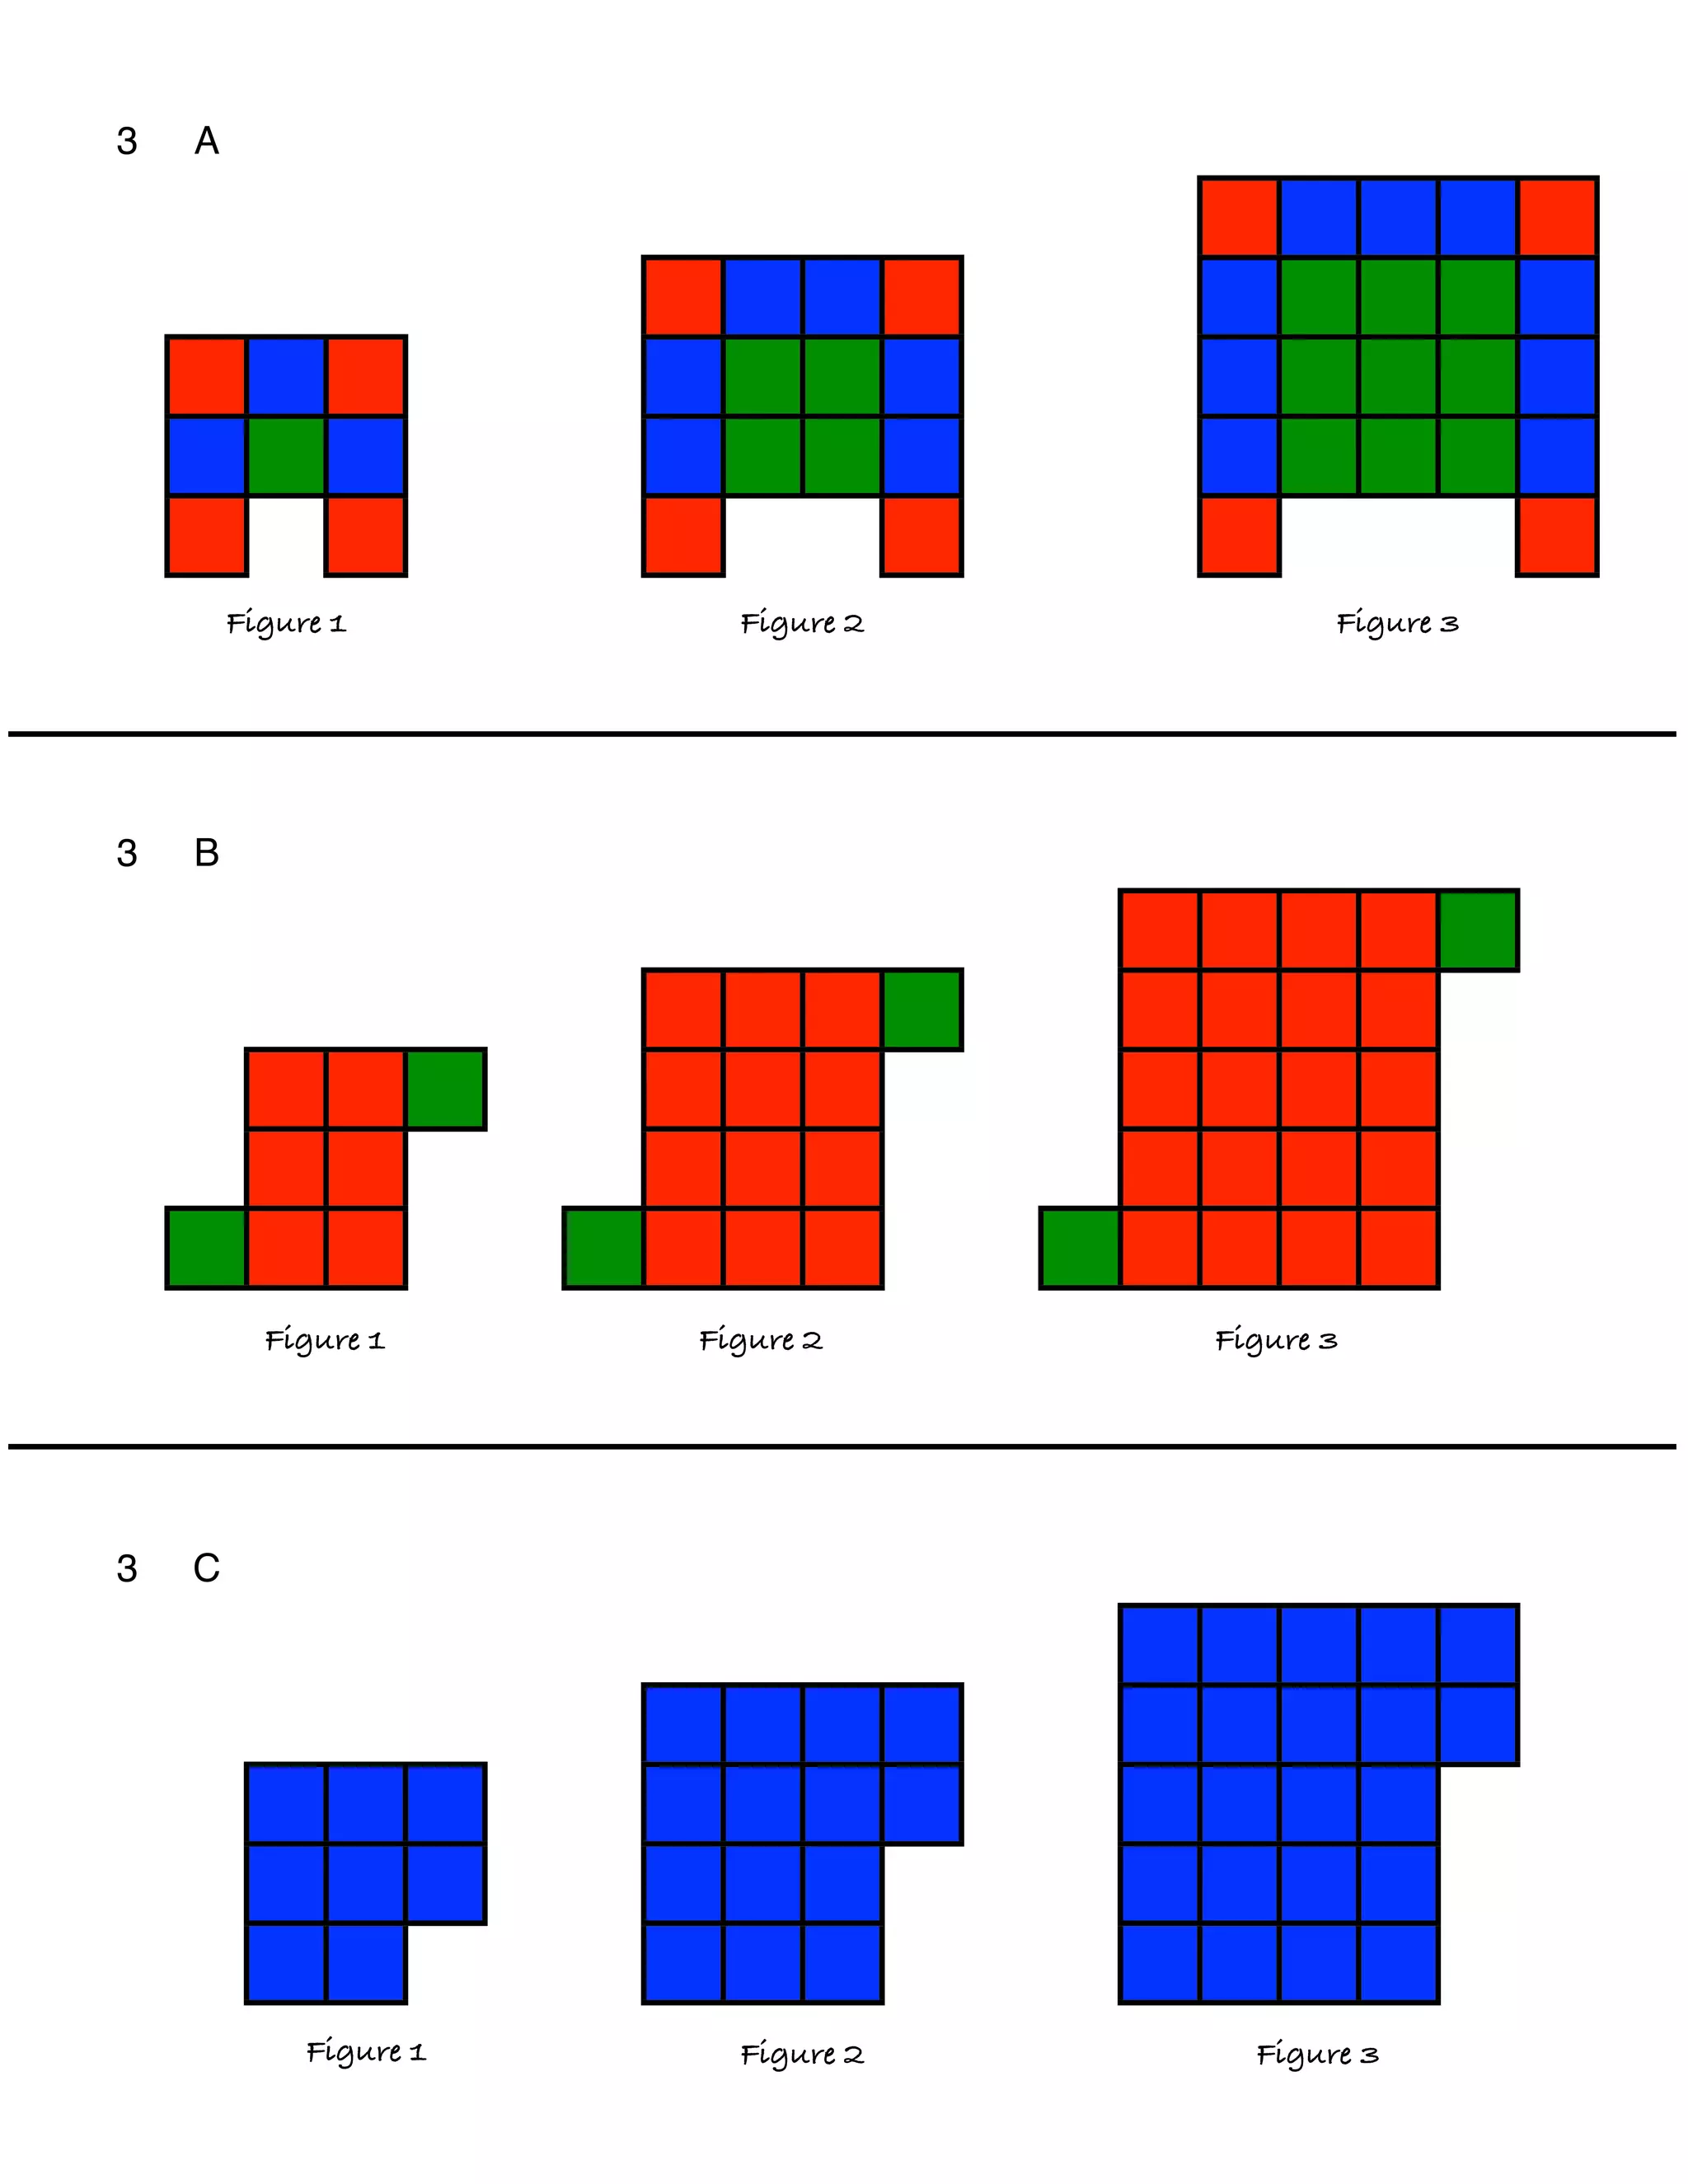
The document presents data across 3 sections and 3 subsections within each section. Each subsection contains 3 figures showing some type of data or results. There are a total of 27 figures displayed in a grid-like format across the 3 sections and their 3 subsections each.
![[STA 2025] 5 Favourite Problems for Intermediate Mathematics.pdf](https://cdn.slidesharecdn.com/ss_thumbnails/sta20255favouriteproblemsforintermediatemathematics-250416174716-ddcc5c22-thumbnail.jpg?width=640&height=640&fit=bounds)

![[myPITA] Multiplication -- More Than Repeated Addition and Times Tables.pdf](https://cdn.slidesharecdn.com/ss_thumbnails/mypitamultiplication-morethanrepeatedadditionandtimestables-250414175625-0d454b02-thumbnail.jpg?width=640&height=640&fit=bounds)


