QNBFS Daily Market Report October 31, 2021
•
0 likes•162 views

The QE Index rose 1.2% to close at 11,806.5. Gains were led by the Banks & Financial Services and Consumer Goods & Services indices, gaining 2.1% and 1.2%, respectively.

Recommended
Recommended
More Related Content
What's hot
What's hot (20)
Similar to QNBFS Daily Market Report October 31, 2021
Similar to QNBFS Daily Market Report October 31, 2021 (20)
More from QNB Group
More from QNB Group (20)
Recently uploaded
Recently uploaded (20)
QNBFS Daily Market Report October 31, 2021
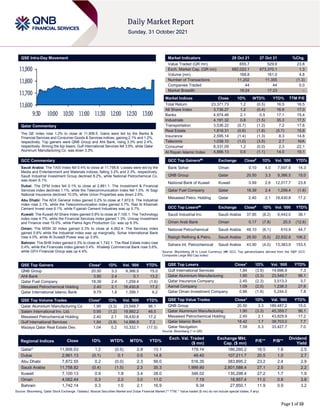
- 1. Page 1 of 10 QSE Intra-Day Movement Qatar Commentary The QE Index rose 1.2% to close at 11,806.5. Gains were led by the Banks & Financial Services and Consumer Goods & Services indices, gaining 2.1% and 1.2%, respectively. Top gainers were QNB Group and Ahli Bank, rising 3.3% and 2.4%, respectively. Among the top losers, Gulf International Services fell 3.9%, while Qatar Aluminum Manufacturing Co. was down 3.3%. GCC Commentary Saudi Arabia: The TASI Index fell 0.4% to close at 11,758.8. Losses were led by the Media and Entertainment and Materials indices, falling 3.2% and 2.3%, respectively. Saudi Industrial Investment Group declined 8.2%, while National Petrochemical Co. was down 6.1%. Dubai: The DFM Index fell 0.1% to close at 2,861.1. The Investment & Financial Services index declined 1.1%, while the Telecommunication index fell 1.0%. Al Sagr National Insurance declined 10.0%, while Union Properties was down 2.6%. Abu Dhabi: The ADX General Index gained 0.2% to close at 7,872.6. The Industrial index rose 2.1%, while the Telecommunication index gained 0.7%. Ras Al Khaimah Cement Invest rose 6.1%, while Fujairah Cement Industries was up 5.7%. Kuwait: The Kuwait All Share Index gained 0.9% to close at 7,100.1. The Technology index rose 4.7%, while the Financial Services index gained 1.3%. Unicap Investment and Finance rose 15.0%, while Palms Agro Production Co. was up 9.3%. Oman: The MSM 30 Index gained 0.3% to close at 4,062.4. The Services index gained 0.6% while the Industrial index was up marginally. Sohar International Bank rose 4.0%, while Al Suwadi Power was up 3.9%. Bahrain: The BHB Index gained 0.3% to close at 1,742.1. The Real Estate index rose 0.4%, while the Financials index gained 0.4%. Khaleeji Commercial Bank rose 5.6%, while GFH Financial Group was up 4.4%. QSE Top Gainers Close* 1D% Vol. ‘000 YTD% QNB Group 20.50 3.3 9,366.5 15.0 Ahli Bank 3.90 2.4 0.1 13.2 Qatar Fuel Company 18.39 2.4 1,259.4 (1.6) Mesaieed Petrochemical Holding 2.40 2.1 18,430.8 17.2 Qatar International Islamic Bank 9.79 1.8 1,399.1 8.2 QSE Top Volume Trades Close* 1D% Vol. ‘000 YTD% Qatar Aluminium Manufacturing Co 1.90 (3.3) 23,549.7 96.1 Salam International Inv. Ltd. 0.95 (1.2) 19,992.2 46.5 Mesaieed Petrochemical Holding 2.40 2.1 18,430.8 17.2 Gulf International Services 1.84 (3.9) 14,896.9 7.3 Mazaya Qatar Real Estate Dev. 1.04 0.2 10,332.1 (17.5) Market Indicators 28 Oct 21 27 Oct 21 %Chg. Value Traded (QR mn) 655.7 529.8 23.8 Exch. Market Cap. (QR mn) 682,022.1 673,370.1 1.3 Volume (mn) 168.8 161.0 4.8 Number of Transactions 11,202 11,355 (1.3) Companies Traded 44 44 0.0 Market Breadth 18:24 17:23 – Market Indices Close 1D% WTD% YTD% TTM P/E Total Return 23,371.73 1.2 (0.5) 16.5 16.5 All Share Index 3,736.27 1.2 (0.4) 16.8 17.0 Banks 4,974.46 2.1 0.5 17.1 15.4 Industrials 4,191.32 0.8 (1.5) 35.3 17.5 Transportation 3,536.22 (0.7) (1.2) 7.2 17.6 Real Estate 1,818.31 (0.6) (1.8) (5.7) 15.6 Insurance 2,595.14 (1.4) (1.3) 8.3 14.8 Telecoms 1,038.10 (1.0) (3.5) 2.7 N/A Consumer 8,331.09 1.2 (0.0) 2.3 22.1 Al Rayan Islamic Index 4,866.13 0.6 (1.1) 14.0 19.1 GCC Top Gainers## Exchange Close# 1D% Vol. ‘000 YTD% Bank Sohar Oman 0.10 4.0 7,697.9 14.3 QNB Group Qatar 20.50 3.3 9,366.5 15.0 National Bank of Kuwait Kuwait 0.99 2.6 12,017.7 23.8 Qatar Fuel Company Qatar 18.39 2.4 1,259.4 (1.6) Mesaieed Petro. Holding Qatar 2.40 2.1 18,430.8 17.2 GCC Top Losers## Exchange Close# 1D% Vol. ‘000 YTD% Saudi Industrial Inv. Saudi Arabia 37.85 (8.2) 6,443.0 38.1 Oman Arab Bank Oman 0.17 (7.8) 20.5 (12.6) National Petrochemical Saudi Arabia 48.10 (6.1) 610.9 44.7 Rabigh Refining & Petro. Saudi Arabia 28.50 (5.0) 22,932.8 106.2 Sahara Int. Petrochemical Saudi Arabia 43.90 (4.0) 13,383.9 153.5 Source: Bloomberg (# in Local Currency) (## GCC Top gainers/losers derived from the S&P GCC Composite Large Mid Cap Index) QSE Top Losers Close* 1D% Vol. ‘000 YTD% Gulf International Services 1.84 (3.9) 14,896.9 7.3 Qatar Aluminium Manufacturing 1.90 (3.3) 23,549.7 96.1 Qatar Insurance Company 2.45 (2.3) 3,513.3 3.7 Aamal Company 1.09 (2.0) 1,238.3 27.6 Qatar Oman Investment Company 0.96 (1.9) 5,244.0 7.8 QSE Top Value Trades Close* 1D% Val. ‘000 YTD% QNB Group 20.50 3.3 189,487.2 15.0 Qatar Aluminium Manufacturing 1.90 (3.3) 45,359.7 96.1 Mesaieed Petrochemical Holding 2.40 2.1 43,829.9 17.2 Qatar Islamic Bank 18.42 1.7 39,703.0 7.7 Qatar Navigation 7.59 0.3 33,427.7 7.0 Source: Bloomberg (* in QR) Regional Indices Close 1D% WTD% MTD% YTD% Exch. Val. Traded ($ mn) Exchange Mkt. Cap. ($ mn) P/E** P/B** Dividend Yield Qatar* 11,806.53 1.2 (0.5) 2.8 13.1 179.14 186,260.2 16.5 1.8 2.5 Dubai 2,861.13 (0.1) 0.1 0.5 14.8 49.40 107,211.7 20.5 1.0 2.7 Abu Dhabi 7,872.55 0.2 (0.0) 2.3 56.0 516.35 383,895.2 23.2 2.4 2.9 Saudi Arabia 11,758.82 (0.4) (1.5) 2.3 35.3 1,999.90 2,801,588.4 27.1 2.5 2.2 Kuwait 7,100.13 0.9 1.8 3.4 28.0 346.02 135,298.4 27.2 1.7 1.9 Oman 4,062.44 0.3 2.0 3.0 11.0 7.19 18,957.4 11.0 0.8 3.8 Bahrain 1,742.14 0.3 1.0 2.1 16.9 9.34 27,850.1 11.9 0.9 3.2 Source: Bloomberg, Qatar Stock Exchange, Tadawul, Muscat Securities Market and Dubai Financial Market (** TTM; * Value traded ($ mn) do not include special trades, if any) 11,600 11,700 11,800 11,900 9:30 10:00 10:30 11:00 11:30 12:00 12:30 13:00
- 2. Page 2 of 10 Qatar Market Commentary The QE Index rose 1.2% to close at 11,806.5. The Banks & Financial Services and Consumer Goods & Services indices led the gains. The index rose on the back of buying support from GCC and foreign shareholders despite selling pressure from Qatari and Arab shareholders. QNB Group and Ahli Bank were the top gainers, rising 3.3% and 2.4%, respectively. Among the top losers, Gulf International Services fell 3.9%, while Qatar Aluminum Manufacturing Co. was down 3.3%. Volume of shares traded on Thursday rose by 4.8% to 168.8mn from 161.0mn on Wednesday. However, as compared to the 30-day moving average of 196.8mn, volume for the day was 14.2% lower. Qatar Aluminum Manufacturing Co. and Salam International Inv. Ltd. were the most active stocks, contributing 14.0% and 11.8% to the total volume, respectively. Source: Qatar Stock Exchange (*as a % of traded value) Earnings Releases, Global Economic Data and Earnings Calendar Earnings Releases Company Market Currency Revenue (mn) 3Q2021 % Change YoY Operating Profit (mn) 3Q2021 % Change YoY Net Profit (mn) 3Q2021 % Change YoY United Wire Factories Co. Saudi Arabia SR 185.7 15.9% 10.5 -50.5% 8.1 -54.5% Zamil Industrial Investment Co. Saudi Arabia SR 827.0 0.3% 13.0 N/A 0.9 N/A Arab Sea Information System Co. Saudi Arabia SR 11.7 107.1% 1.4 N/A 1.2 N/A Saudi Basic Industries Corp. Saudi Arabia SR 43.7 49.1% 7.7 266.7% 5.6 412.8% Saudi Vitrified Clay Pipes Co. Saudi Arabia SR 20.2 -28.1% (1.5) N/A (1.8) N/A National Industrialization Co. Saudi Arabia SR 1,004.3 75.3% 526.2 517.6% 333.4 N/A Leejam Sports Co. Saudi Arabia SR 253.8 20.1% 89.7 130.4% 76.2 186.8% Dubai Financial Market Dubai AED 47.1 -47.9% – – (1.9) N/A Eshraq Properties Co. Abu Dhabi AED 5.1 30.2% – – 17.2 -25.5% Source: Company data, DFM, ADX, MSM, TASI, BHB. Global Economic Data Date Market Source Indicator Period Actual Consensus Previous 10-28 US Department of Labor Initial Jobless Claims 23-Oct 281k 288k 291k 10-28 US Department of Labor Continuing Claims 16-Oct 2243k 2420k 2480k 10-28 US Bureau of Economic Analysis GDP Annualized QoQ 3Q 2.00% 2.60% 6.70% 10-28 US Bureau of Economic Analysis Personal Consumption 3Q 1.60% 0.90% 12.00% 10-29 US Bureau of Labor Statistics Employment Cost Index 3Q 1.30% 0.90% 0.70% 10-29 US Bureau of Economic Analysis Personal Income Sep -1.00% -0.30% 0.20% 10-29 US Bureau of Economic Analysis Personal Spending Sep 0.60% 0.60% 1.00% 10-29 UK Bank of England M4 Money Supply YoY Sep 7.00% -- 7.10% 10-29 UK Bank of England Money Supply M4 MoM Sep 0.60% -- 0.50% 10-29 UK Bank of England M4 Ex IOFCs 3M Annualised Sep 5.50% -- 6.20% 10-28 EU European Commission Consumer Confidence Oct -4.8 -- -4.8 10-28 EU European Commission Economic Confidence Oct 118.6 116.7 117.8 10-28 EU European Commission Industrial Confidence Oct 14.2 12.9 14.1 10-28 EU European Commission Services Confidence Oct 18.2 14.6 15.2 10-29 EU Eurostat CPI MoM Oct 0.80% 0.50% 0.50% 10-29 EU Eurostat CPI Estimate YoY Oct 4.10% 3.70% 3.40% 10-29 EU Eurostat CPI Core YoY Oct 2.10% 1.90% 1.90% 10-28 Germany Deutsche Bundesbank Unemployment Change (000's) Oct -39.0k -20.0k -31.0k 10-28 Germany Deutsche Bundesbank Unemployment Claims Rate SA Oct 5.40% 5.40% 5.50% 10-28 Germany German Federal Statistical Office CPI MoM Oct 0.50% 0.40% 0.00% Overall Activity Buy %* Sell %* Net (QR) Qatari Individuals 26.12% 28.07% (12,794,240.7) Qatari Institutions 13.25% 42.92% (194,571,574.5) Qatari 39.36% 70.99% (207,365,815.2) GCC Individuals 0.98% 0.75% 1,504,828.0 GCC Institutions 31.14% 4.09% 177,412,366.4 GCC 32.12% 4.83% 178,917,194.4 Arab Individuals 6.41% 8.89% (16,247,798.8) Arab Institutions 0.00% 0.00% – Arab 6.41% 8.89% (16,247,798.8) Foreigners Individuals 2.46% 2.15% 2,042,035.7 Foreigners Institutions 19.66% 13.15% 42,654,383.8 Foreigners 22.11% 15.30% 44,696,419.5
- 3. Page 3 of 10 Date Market Source Indicator Period Actual Consensus Previous 10-28 Germany German Federal Statistical Office CPI YoY Oct 4.50% 4.40% 4.10% 10-28 Germany German Federal Statistical Office CPI EU Harmonized MoM Oct 0.50% 0.40% 0.30% 10-28 Germany German Federal Statistical Office CPI EU Harmonized YoY Oct 4.60% 4.50% 4.10% 10-29 France INSEE National Statistics Office Consumer Spending MoM Sep -0.20% 0.50% 0.70% 10-29 France INSEE National Statistics Office Consumer Spending YoY Sep -2.30% -1.30% -5.40% 10-29 France INSEE National Statistics Office GDP QoQ 3Q 3.00% 2.20% 1.30% 10-29 France INSEE National Statistics Office GDP YoY 3Q 3.30% 2.40% 18.80% 10-29 France INSEE National Statistics Office CPI MoM Oct 0.40% 0.30% -0.20% 10-29 France INSEE National Statistics Office CPI YoY Oct 2.60% 2.50% 2.20% 10-29 Japan Japan CPI Tokyo YoY Tokyo CPI YoY Oct 0.10% 0.40% 0.30% 10-29 Japan Japan Jobs to Applicants Ratio Job-To-Applicant Ratio Sep 1.16 1.14 1.14 10-29 Japan Japan Unemployment Rate Jobless Rate Sep 2.80% 2.80% 2.80% 10-29 Japan Ministry of Economy Trade and Industry Industrial Production MoM Sep -5.40% -2.70% -3.60% 10-29 Japan Ministry of Economy Trade and Industry Industrial Production YoY Sep -2.30% 0.20% 8.80% 10-29 Japan Economic and Social Research Consumer Confidence Index Oct 39.2 40.5 37.8 Source: Bloomberg (s.a. = seasonally adjusted; n.s.a. = non-seasonally adjusted; w.d.a. = working day adjusted) News Qatar GISS' net profit rises to 42.0mn in 3Q2021, above our estimate – Gulf International Services (GISS) reported net profit of QR42.0mn in 3Q2021 as compared to net loss of QR5.2mn in 3Q2020 and net profit of QR4.8mn in 2Q2021, above our estimate of QR17.4mn. The company's revenue came in at QR815.0mn in 3Q2021, which represents an increase of 15.2% YoY (+12.2% QoQ). Earnings per share amounted to QR0.023 in 3Q2021 as compared to earnings per share of QR0.003 in 2Q2021. Gulf International Services (GISS) - a holding entity of Gulf Drilling International, Gulf Helicopters, Al Koot and Amwaj - has reported a net profit of QR41mn during the first nine months (9M) of 2021, translating as earnings-per-share of QR0.022. The group’s revenue was however, down 1% YoY to QR2.2bn. The revenue growth from insurance and aviation was offset by revenue decline in both drilling and catering segments. "The decline in group revenues led to a decline in net earnings. Moreover, direct costs increased by 3%, negatively affecting the group’s profitability, and was mainly due to increase in activity within drilling and aviation segments coupled with increased claims within insurance segment, partially offset by direct cost reduction noted in catering segment," a GISS spokesman said. GISS' finance cost fell 27% to QR96mn, against a backdrop of lower interest rates. Similarly, general and administrative expenses were down 1% on continued optimization programs. Total assets were valued at QR10.2bn at the end of September 2021. Cash and short term investments stood at QR763mn. Total debt at group level was QR4.4bn. The current levels of debt continue to impact the group’s net earnings. The drilling segment saw 1% fall in revenue to QR716mn, mainly impacted by rigs’ suspension within onshore fleet carried forward since last year until the first half of 2021, where two of the suspended rigs had commenced operations during 3Q2021. In addition, rig day-rates remained depressed during first half of the year and impacted revenue growth on a year-on-year basis. However, the rig-day rates applicable to the offshore fleet improved during the third quarter of 2021, as the newly day-rates applicable to offshore fleet took effect from July this year. Moreover, deployment of three additional rigs as part of Gulfdrill joint venture's fleet during the second quarter of 2021, has also added value to segment’s revenue recovery. The segment reported a net loss of QR159mn against a net loss of QR120mn during 9M2020, primarily attributed to lower revenue. However, this was partially offset by a decline of QR31mn in segment’s finance cost compared to 9M2020, on account of lower interest rates. The aviation segment reported an 8% yearly increase in revenue to QR528mn during 9M2021, due to higher flying hours within both domestic and global operations, coupled with revenue growth across all the businesses within the segment. The segment’s net profit reached QR175mn, representing a year-on-year increase of 13%, mainly on account of revenue growth. The revenue within the insurance segment was up 1% YoY to QR745mn as the growth in premiums from general insurance line of business was offset by decline in premiums from medical line of business. The segmental net earnings increased by 44% YoY to QR50mn during 9M-2021, mainly on strong recovery within investment portfolio on the back of recovery in capital markets. Besides, the unrealized gain on revaluation of investment portfolio contributed QR38mn positively towards segment’s net earnings during 9M2021. The catering segment saw a 19% decline in revenue to QR258mn, mainly due to ongoing Covid-19 related restrictions, which resulted in lower number of meals being served across majority of catering locations. The segment reported a net loss of QR19mn during 9M-2021 against a net loss of QR4mn, mainly on lowered margins and declining revenues (QNB FS Research, QSE, Gulf- Times.com) BLDN reports net profit of QR15.5mn in 3Q2021 – Baladna's (BLDN) net profit declined 46.4% YoY (-63.4% QoQ) to QR15.5mn in 3Q2021. The company's revenue came in at QR182.0mn in 3Q2021, which represents a decrease of 0.1% YoY (-8.2% QoQ). EPS amounted to QR0.008 in 3Q2021 as compared to QR0.015 in 3Q2020 and QR0.022 in 2Q2021. Baladna announced that the company registered revenue of QR563mn and a net profit of QR102mn in the first nine months of the year 2021 compared to QR568mn and QR102mn in the same period last year. Confirming the industry-leading net profit margin of 18% in the third quarter of 2021, the company said its market share increased across the majority of product categories. Baladna continued to deliver strong operational and financial results, reporting a net profit of QR16mn in the third quarter of 2021. Despite the continuation of a weak retail market in the third quarter of 2021, increased commodity and feed costs, Baladna presented its resilience and agility by gaining further market share in the retail sector across key products categories and additional
- 4. Page 4 of 10 market share gains in UHT milk by 1.5%, juice by 2.5%, yoghurt by 3.8%, cheese by 3.9% and cream by 14.4% compared to the same period last year. Product portfolio management remains a key strategic pillar of Baladna’s success. Identifying products that are value accretive and in-line with the market requirements, having the research and development capabilities to create innovative products and the ability to bring products successfully to market in a very short period of time. Therefore, Baladna managed despite a temporarily overall lower market demand in the third quarter of 2021, to grow its market share across core categories while at the same time successfully launching 10 SKUs and growing the total product portfolio by 13% compared to the beginning of the year and by 18% compared to the same period in the previous year. Baladna successfully mitigated the challenges during the third quarter of 2021 brought upon the dairy industry due to an increase in commodity prices and feed costs, as well as the planned reduction in government compensation, through the continuation of costs reduction and further enhancing efficiencies across the whole value chain. As a result, Baladna remains a regional industry leader in terms of net profit margin presented to its shareholders. In addition to the operational business development of its existing facilities and product offering, the management announced in the second quarter of 2021 the company’s plans to establish an evaporated milk processing factory (evaporated milk and sterilized creams). As of the third quarter of 2021, the project is progressing well. Baladna remains committed to fulfilling its vision and mission by delivering superior products and expanding its dairy and juice portfolio to become the most trusted brand of nutritional foods and healthy beverages in Qatar, as well as delivering shareholder value. The company’s operating profits amounted to QR128mn compared to QR135mn during the same period in 2020. Cashflows from operations remain strong with Baladna recording operational cashflows of QR222mn compared to operational cashflows of QR155mn during the same period in the previous year. Baladna achieved these results on a solid asset base which is primarily funded by equity. (QSE, QNB FS Research, Qatar Tribune) QGRI reports net profit of QR6.4mn in 3Q2021 – Qatar General Insurance & Reinsurance Company's (QGRI) net profit declined 86.5% YoY (-65.7% QoQ) to QR6.4mn in 3Q2021. The company's net earned premiums came in at QR28.3mn in 3Q2021, which represents a decrease of 28.5% YoY (-21.2% QoQ). EPS amounted to QR0.082 in 9M2021 as compared to QR0.085 in 9M2020. (QSE, QNB FS Research) ZHCD's net profit declines 1.5% YoY in 3Q2021 – Zad Holding Company's (ZHCD) net profit declined 1.5% YoY (-50.5% QoQ) to QR30.5mn in 3Q2021. The company's operating revenue came in at QR308.7mn in 3Q2021, which represents an increase of 19.4% YoY (+17.9% QoQ). EPS amounted to QR0.52 in 9M2021 as compared to QR0.53 in 9M2020. (QSE, QNB FS Research) Mekdam Holding Group signs financing agreement Arab Bank – Mekdam Holding Group announces it has signed agreement of banking facilities (direct and indirect facilities) with Arab Bank P.L.C. with a total value of QR67.5mn to finance the projects that were recently awarded to Mekdam Holding Group. Granting these banking facilities is an indication of the trust and credit reputation of Mekdam Holding Group in the banking sector. (QSE) PSA: Qatar's PPI soars 87.2% YoY in September – Energy-rich Qatar's hydrocarbons and manufacturing sectors continued to face significant price pressure this September, as the country's producers' price index (PPI) zoomed 87.2% YoY, according to the official estimates. Qatar's PPI, which captures price pressure felt by producers of goods and services, grew 4.4% on a monthly basis, said the figures released by the Planning and Statistics Authority (PSA). The PSA had released a new PPI series in late 2015. With a base of 2013, it draws on an updated sampling frame and new weights. The previous sampling frame dates from 2006, when the Qatari economy was much smaller than today and the range of products made domestically much narrower. The hardening of the global crude oil and industrial input prices had its reflection in the PPI. The mining PPI, which carries the maximum weight of 72.7%, reported a robust 102.2% increase YoY in September 2021 as the selling price of crude petroleum and natural gas was seen soaring 102.8%; even as that of stone, sand and clay declined 3.8%. The mining PPI registered a 5.2% jump on a monthly basis in September this year on the back of a 5.2% jump in the average selling price of crude petroleum and natural gas and 2.6% in stone, sand and clay. The manufacturing sector PPI, which has a weight of 26.8% in the basket, saw a 63.3% growth YoY in September 2021 on the back of a 92.4% surge in the price of basic chemicals, 67.6% in refined petroleum products, 38.3% in basic metals, 9.7% in rubber and plastics products, 3.1% in other chemical products and fibres, 0.8% in dairy products and 0.6% in beverages. (Gulf-Times.com) PSA: Qatar population shrinks by 80,000 in September – Over a span of one year, Qatar saw its population shrink by 80,000 people, according to the Planning and Statistics Authority (PSA). In the latest edition of PSA’s monthly report, the authority said Qatar’s population reduced from 2.72mn in September 2020 to 2.64mn in September 2021. The report said the country recorded 2,026 live births in September, which also saw Qatari live births decreasing by 4.4 percent when compared to the previous month. On the other hand, 168 deaths were recorded in September, down 24% against that in August, 2021. While 363 couples got married in September, 213 divorces were finalized in the month, down 12.3% from that in the previous month. September saw 7.1% increase in marriages MoM. (Qatar Tribune) Value of sold properties in Qatar rises 71.3% in September – The total number and value of sold properties in Qatar increased 39.2% and 71.3% respectively compared to the previous month, according to the monthly report of Planning and Statistics Authority (PSA) released on Saturday. In addition, the Consumer Price Index (CPI) increased, where the general family consumption index rose by 0.03% compared to August 2021. The largest increase was in clothes and shoes, followed by food and beverages by 2.8% and 1.78%, respectively, compared to August 2021. Furthermore, among the most notable changes is the increase in the total number of marriage contracts for Qatari males and females by 30.5% and 37%, respectively compared to August 2021. As for the banking sector, the total broad money supply (M2) recorded about QR617.4bn during September 2021, an annual increase of 4.2% compared with September 2020. On the other hand, cash equivalents including commercial bank deposits reached QR975.5bn during September 2021. The figure has recorded an annual increase of 10.9% compared to September 2020, when deposits recorded approximately QR879.9bn. Regarding the data of buildings permits issued, the total number of permits has reached 736 permits during September 2021, recording a monthly increase of 17.6% and an annual decrease of 2.8%. (Qatar Tribune) New vehicle registration rises 5.8% in September – As much as 7,388 new vehicles were registered in September 2021, showing a monthly increase of 5.8% and an annual increase of 19.3%. This came in 93th ‘Qatar Monthly Statistics’ bulletin, a series of statistical newsletters released on a monthly basis by the Planning and Statistics Authority (PSA). (Peninsula Qatar) QIBK releases its 1st sustainability report – Qatar Islamic Bank (QIBK) has released its first sustainability report in line with Qatar National Vison 2030 and the recently launched National Strategy for the Environment and Climate Change. The report
- 5. Page 5 of 10 highlights QIBK’s efforts to contribute to the accomplishment of global sustainable development goals and highlights the bank’s achievements in implementing Environmental, Social and Governance (ESG) standards. The report is providing a high-level overview of QIBK’s sustainability framework that covers the Bank’s strategy, objectives, plans and results as well as its positioning on the most important issues for its key stakeholders. The bank’s sustainability framework consists of five pillars, crucial for supporting the bank’s goal in contributing to the growth of Qatar and to the country’s sustainable development in the future. The five pillars are Sustainable Finance, Responsible Banking, Governance, Ethics & Risk Management, Empowering QIBK’s People and Positive Community Impacts. These pillars and their corresponding topics reflect the bank’s strategic priorities to enable sustainable growth while delivering an outstanding customer experience. (QSE) Qatar Energy aims for $10bn in green bonds – Qatar Energy Company is looking to raise between 5 to 10bn dollars from its first green bond offerings, in the first quarter of next year. The US economic channel, CNBC, quoted three unnamed banking sources as saying today, Thursday, that this step by Qatar Energy comes in conjunction with a global trend towards reducing carbon emissions. She stated that Qatar Energy is currently working on developing an environmental framework in cooperation with international investment banks, including Goldman Sachs; With a view to heading towards the green bond market. The sources expected that the offering process will take place in the first quarter of next year, or the end of June 2022 at the latest, at a time when the company is heading towards collecting the necessary liquidity to finance the expansions of the North Field. A green bond is a debt instrument issued to obtain funds earmarked for financing climate or environmental projects. It is noteworthy that Qatar Energy Company (formerly Qatar Petroleum) had issued bonds worth 12.5bn dollars in the middle of this year, which is the largest offering at the level of emerging markets so far in 2021. The issuance aims to finance the expansion of gas operations in the North Field to increase production by 64% up to to 126mn tons by 2027. (Bloomberg) Qatar is said to invest in Pakistan’s next LNG import terminal – Qatar, the world’s top supplier of liquefied natural gas, will invest in Pakistan’s next import terminal in a bid to support one of the fastest growing buyers of the super-chilled fuel. Qasim Terminal Holding Co., a subsidiary of Qatar Energy, has applied for clearance with Pakistan’s government to take a stake in Energas Terminal Pvt., according to people familiar with the matter. Qatar Energy and Energas did not respond to requests for comments while Pakistan’s competition commission declined to comment. The deal comes as Qatar plans to dramatically increase production over the next decade, which will require the Middle Eastern nation to find more buyers for its fuel. Qatar is already Pakistan’s largest gas supplier with its latest long-term deal slated to start this year. (Bloomberg) Qatar plans 25% cut in Greenhouse Gas Emissions by 2030 – Qatar plans to reduce greenhouse gas emissions by 25% by 2030, state-run Qatar News Agency reports. Announcement came during ceremony to launch Qatar’s national strategy for environment and climate change. (Bloomberg) US House of Representatives’ Doha visit to boost trade, investment opportunities – The US-Qatar Business Council (USQBC) has concluded a business & investment program it organized for members of the US House of Representatives who were in Doha recently. The Congressional delegation consisted of eight members who participated in an extensive program agenda that included meetings with both Qatari government and private sector officials. The participants also met with US government and US private sector officials to discuss and learn more about enhancing business opportunities for the members’ districts. The delegation was sponsored by USQBC to strengthen commercial ties, facilitate business engagements, and enhance investment and trade in the US. It is comprised of Darrell Issa (CA-50), Lou Correa (CA-46), Darin LaHood (IL-18), Claudia Tenney (NY-22), Matt Gaetz (FL-1), Andrew Garbarino (NY-2), Jay Obernolte (CA-8), and Victoria Spartz (IN-5). “The program was a resounding success,” The US and Qatar’s economic relationship continues to grow, and the delegation’s participation in this program will enhance trade and investment opportunities for the US. We look forward to supporting additional American companies in expanding their business internationally,” said USQBC managing director Mohamed Barakat. (Gulf-Times.com) Qatar is seen as export, investment destination by Indiana, US firms – The Embassy of the State of Qatar Office of the Commercial Attaché, US-Qatar Business Council (USQBC), and the Indiana Economic Development Corporation (IEDC) have collaborated on a visit to the State of Indiana to engage with the local business community and key policymakers to enhance economic partnerships between Qatar and Indiana. The visit featured Eric Holcomb, governor of the State of Indiana; Fahad Al-Dosari, Commercial Attaché of the Embassy of the State of Qatar to the US; Brad Chambers, Secretary of Commerce for the State of Indiana and CEO of Indiana Economic Development Corporation (IEDC); and Mohamed Barakat, managing director of USQBC. This visit highlighted potential partnerships and investment opportunities specific for Indiana companies while also identifying key areas of interest, how Indiana-based companies can start conducting business in Qatar, and what resources are available to them. (Gulf-Times.com) Dukhan Bank, Visa campaign offers hospitality packages for Arab Cup '21 – Dukhan Bank has announced the launch of a new campaign in partnership with Visa, offering Dukhan Bank customers the chance to win hospitality packages for the eagerly anticipated FIFA Arab Cup Qatar 2021, thanks to Visa. The FIFA Arab Cup Qatar 2021 will be hosted from November 30 to December 18 at stadiums across the country, offering fans the chance to experience the football league ahead of the FIFA World Cup Qatar 2022. The event is set to host 16 teams, gathering the best players from the region. Ezdan Oasis occupancy rates hit 90% in 3Q2021 – Ezdan Real Estate Company (ERES) disclosed recent occupancy rates of its residential units that were inaugurated under Ezdan Oasis project, reflecting a surge above 90% in the third quarter of 2021, marking a significant leap. Ezdan Oasis, an Al Wukair-based mega project, is now accommodating more than 15,000 individuals. The most prominent real estate project in the area provides thousands of residential units, retail outlets, and shops, featuring sports and recreational facilities, as well as a hypermarket, a school, mosques, and others. “The great demand on accommodation at Ezdan Oasis is witnessing a rapid rise, as customers are seeking to obtain a fully-furnished and distinguished residence that provides a convivial atmosphere and sumptuousness to all its residents, thanks to the painstaking and strenuous efforts that Ezdan Real Estate has made. “We will pursue adding further services into this project, which we consider as one of the key undertakings offered by Ezdan Holding Group in the property market, and a true reflection of the group’s long experience in such scalable vital sector and signifies the culmination of a long process of work and achievements,” said deputy Group CEO Hani Dabash. (Gulf-Times.com) Qatar Chamber supports Gulf joint action seeking economic integration between GCC states, says Al-Sharqi – Qatar Chamber recently hosted the 50th meeting of the Executive Committee of the Federation of the Gulf Cooperation Council Chambers (FGCCC) with the participation of chief executives and
- 6. Page 6 of 10 directors of unions and chambers of GCC States. The meeting was chaired by Qatar Chamber general manager Saleh bin Hamad Al-Sharqi and was attended by FGCCC secretary-general Saud bin Abdulaziz Al-Mishari. Al-Sharqi expressed hope that the meeting would achieve the committee’s main objectives, specifically the activation of the committee’s role in the FGCCC General Secretariat work program. He stressed that Qatar Chamber supports the efforts to achieve integration and boost co- operation among member chambers for the benefit of the Gulf economy, which stems from Qatar’s support for the Gulf joint action to achieve the economic integration between GCC states. (Gulf-Times.com) Doha sees 'largest jump' of any city globally in Kearney's Global Cities Index – Doha saw the largest jump of any city globally on this year’s Kearney's Global Cities Index, rising 15 places, the 11th edition of a Kearney report has shown. Comprising of Global Cities Index (GCI) and Global Cities Outlook (GCO), the Kearney Global Cities Report 2021 measures how globally engaged cities are across five dimensions: Business activity, human capital, information exchange, cultural experience, and political engagement. The report offers key insights into how Covid-19 and the resulting pandemic containment measures have impacted the level of global engagement of 156 cities. According to Kearney, Doha saw the largest jump of any city on this year’s Global Cities Index, rising 15 places “following the restoration of diplomatic relations” between Qatar and its neighboring countries, highlighting the importance of fostering regional relationships in addition to global ones. (Gulf-Times.com) Qatar, Singapore discuss joint cooperation in trade, investment – Minister of Commerce and Industry H E Sheikh Mohammed bin Hamad bin Qassim Al Abdullah Al Thani met yesterday with Minister in the Prime Minister’s Office and Second Minister for Education and Foreign Affairs of the Republic of Singapore H E Dr. Mohamad Maliki bin Osman, who is visiting the country. During the meeting, they reviewed bilateral relations between the two countries in the commercial, industrial and investment fields and ways to enhance and develop them. Also, they discussed trade policies and the efforts made by the two countries in the context of confronting the COVID-19 pandemic. During the meeting, the Minister of Commerce and Industry highlighted the successful economic policies established by the State of Qatar to support the private sector, including incentives, legislation, and promising opportunities that encourage foreign investment and provide more investment opportunities for companies wishing to invest and establish a base in the State of Qatar. The trade and investment cooperation between the State of Qatar and the Republic of Singapore has witnessed significant growth, as the volume of trade exchange between the two countries reached about $3.69bn from January to August 2021. The Republic of Singapore was the sixth trading partner of the State of Qatar in 2020. (Peninsula Qatar) Qatar signs deal with Accor to manage World Cup fan accommodation – Qatar has awarded Europe's largest hotel group Accor to manage apartments and villas that will house fans visiting Qatar during next year’s World Cup, the Cup's organizing committee said on Thursday. Qatar's Supreme Committee for Delivery & Legacy said in a statement it had signed an agreement with Accor to run operations and services across its host country real estate portfolio through the end of 2022. The decision to make full use of the Gulf Arab state's existing residential and apartments and villas will ensure that the country will have "a sustainable hotel market that does not leave Qatar with excess permanent hotel rooms post-2022," Hassan Al Thawadi, who heads Qatar’s organizing body was quoted as saying. Accor will provide staff to manage and operate more than 60,000 rooms in apartments and villas scattered across the Gulf Arab state, a separate Qatari official told Reuters. (Reuters) International US consumer spending strong; robust wage gains hint at long spell of high inflation – US consumer spending increased solidly in September, but was partly flattered by higher prices, with inflation remaining hot as shortages of motor vehicles and other goods persisted amid global supply constraints. Inflation pressures are broadening out, with other data on Friday showing employers boosted wages by the most on record in the third quarter as they competed for scarce workers. The industry-wide surge could undercut Federal Reserve Chair Jerome Powell’s long-held view that high inflation is transitory. The strength in consumer spending at the end of last quarter, together with falling COVID-19 infections and recovering consumer confidence bode well for a pickup in economic activity in the final three months of the year, though shortages and more expensive goods pose risks. The economy grew at its slowest pace in more than a year in the third quarter. Spending was driven by demand for services such as healthcare, dining out as well as hotel and motel accommodation amid declining cases of the coronavirus Delta variant. A wave of infections over summer worsened worker shortages at factories, mines and ports, further stressing supply chains. Services spending increased 0.6% after advancing 0.7% in August. That offset a 0.2% drop in outlays on long-lasting manufactured goods, which largely reflected a decrease in new motor vehicle sales. Outside the shutdown in spring 2020, which severely depressed output, the third quarter was the worst period for motor vehicle production since early 2009 because of a global shortage of semiconductors. Auto inventories have been run down and some shelves are bare, curbing spending and boosting prices. Price pressures remained strong in September, reducing consumers’ buying power. The personal consumption expenditures (PCE) price index, excluding the volatile food and energy components, climbed 0.2%. That was the smallest gain since February and followed a 0.3% rise in August. (Reuters) US labor costs power ahead in third quarter as wages surge – US labor costs increased by the most since 2001 as companies boosted wages and benefits amid a severe worker shortage, suggesting inflation could remain high for sometime. The Employment Cost Index, the broadest measure of labor costs, surged 1.3% last quarter after rising 0.7% in the April-June period, the Labor Department said on Friday. The largest gain since 2001 reflected an increase across industries. Labor costs powered ahead 3.7% on a YoY basis, the largest rise since the fourth quarter of 2004, after increasing 2.9% in the second quarter. The ECI is widely viewed by policymakers and economists as one of the better measures of labor market slack and a predictor of core inflation as it adjusts for composition and job quality changes. Economists polled by Reuters had forecast the ECI advancing 0.9% in the third quarter. Wages and salaries soared 1.5% after increasing 0.9% in the second quarter. They were up 4.2% YoY. Benefits gained 0.9% after rising 0.4% in the April-June quarter. The COVID-19 pandemic has upended labor market dynamics, creating an economy-wide acute shortage of workers. There were 10.4mn job openings at the end of August. The Federal Reserve’s preferred inflation gauge, the personal consumption expenditures (PCE) price index excluding food and energy, rose at a 4.5% rate in the third quarter after increasing at a 6.1% pace in the April- June quarter, the government reported on Thursday. The US central bank has a flexible 2% inflation target. (Reuters) UK sees highest company voluntary liquidations since 2009 – England and Wales have seen a surge in company directors winding up businesses that are unable to pay their debts, taking so-called voluntary liquidations to their highest level since 2009 in the depths of the global financial crisis. Total company
- 7. Page 7 of 10 insolvencies in England and Wales jumped in the three months to the end of September to their highest since the start of the COVID-19 pandemic at 3,765, up 43% on a year earlier, government data showed. Forced liquidations of companies remained near an all-time low, due to legal restrictions on creditors’ ability to act against businesses during the pandemic, as well as a 79bn-Pound ($109bn) program of government loan guarantees. But creditors’ voluntary liquidations - which in normal times account for two thirds of insolvencies - rose to their highest total since the three months to the end of June 2009 in the latest quarter at 3,471, more than 90% of the total. “Relative calm waters - largely due to the unprecedented government economic support over the last 18 months - may be giving way to stormier seas,” said Richard Tett, head of the insolvency practice at law firm Freshfields. Businesses were likely to come under further pressure in the coming months due to a surge in energy prices and the removal of legal restrictions on forced insolvencies, Tett added. Friday’s data showed 26,758 insolvencies for individuals in England and Wales in the three months to September, a third more than 12 months ago, when they hit a five-year low, but below their level in the previous quarter and before the pandemic. Court-ordered bankruptcies of individuals, which account for only a small share of total insolvencies, fell to their lowest since 1989 at 1,938. (Reuters) Eurozone growth, inflation soar, leaving ECB with dilemma – The Eurozone economy continued to boom over the summer as activity rebounded after coronavirus lockdowns but inflation is also blowing past expectations, leaving the European Central Bank with a growing policy headache. Growth has soared as consumers return to stores and venues but many businesses have been unable to keep up with demand, putting further pressure on prices already being driven higher by the rising cost of commodities. The economy of the 19 countries sharing the euro expanded by a quicker-than-forecast 2.2% in the third quarter, its fastest pace in a year and putting it on course to reach its pre-crisis size before the end of the year. This strong performance came even while Germany, the bloc's biggest economy, struggled as a chip shortage held back production in its vast car manufacturing sector. But France, Italy, Belgium and Austria, some of them economic laggards historically, outperformed to lift the bloc. The quick growth along with soaring oil prices, helped push inflation to 4.1% this month, more than twice the European Central Bank's target and equaling the all- time-high for the data series launched in 1997. While inflation was mostly driven by higher energy prices and tax hikes, growing price pressures from supply bottlenecks were also visible in rising prices for services and industrial goods - a worry for the ECB, which is slowly accepting that price growth may be more durable than once thought. (Reuters) France's economy roars in 3Q, inflation jumps – France’s economy grew a faster-than-expected 3% in the third quarter, preliminary data showed on Friday, propelled by a pick-up in consumer spending and exports as the Eurozone’s number two economy rebounds from the COVID-19 pandemic. Finance Minister Bruno Le Maire told France Info radio the figure was an “exceptional result” that showed the economy was heading in the right direction. A Reuters poll of 24 analysts had forecast a 2.1% expansion for the July-September period. The INSEE national statistics agency said the third-quarter growth meant France’s economy was close to getting back to its level before the COVID- 19 pandemic hit. Analysts at investment bank ING hailed the third-quarter figures as “excellent news” but warned they could represent a peak for the year as the global economy battles inflationary concerns and supply chain problems. “The peak has been reached and from now on, economic growth will start to slow,” ING said. Spiraling energy prices in October saw France’s EU-harmonized rate of inflation jump to 3.2% YoY (vs 2.7% the previous month) as the cost of energy leapt 20.1%, INSEE reported. MoM prices rose 0.5%, it added. (Reuters) Italian economy grows more than expected in 3Q as recovery from COVID crisis continues – Italy’s economy grew by 2.6% in the third quarter from the previous three months, preliminary data showed on Friday, a larger rise than expected as a firm recovery continues after last year’s deep recession. On a YoY basis, gross domestic product in the euro zone’s third largest economy was up 3.8%, national statistics burueau ISTAT said. A Reuters survey of 25 analysts had forecast a 2.0% quarterly rise, up 3.0% from the year earlier. The economy has been picking up speed since the spring, as Prime Minister Mario Draghi’s government has scrapped restrictions on business and movement in response to a decline in coronavirus infections and deaths. Second quarter GDP growth was confirmed at 2.7% QoQ, while the YoY rate was revised to 17.0% from a previously reported 17.2%. The YoY surge reflected the deep slump in activity a year ago due to COVID-19 lockdowns. The COVID- crippled economy contracted by 18.9% last year, Italy’s steepest post-war recession. Looking ahead, the government officially forecasts a GDP rebound of 6% this year, but Draghi said that in the light of recent data he now expects growth “well above” this rate. (Reuters) Japan's factory output hit by supply snags as outlook darkens – Japan's factory output shrank for the third straight month in September as the auto sector was hit by a persistent global supply shortage, raising the risk of an economic contraction in the third quarter and throwing the recovery into doubt. Output disruptions across Asia and slowing growth in China have clouded the outlook for the world's third-biggest economy, which has depended heavily on exports to boost growth as the COVID-19 pandemic hurt domestic demand. "The risk looms that third-quarter gross domestic product turned negative," said Takeshi Minami, chief economist at Norinchukin Research Institute. "Shipments of capital goods declined. That suggests business investment has not been growing." Factory production slumped 5.4% in September from the previous month, official data showed on Friday, hurt by falling output of cars as well as general-purpose machinery. That meant output shrunk for the third consecutive month, after falling 3.6% in August and 1.5% in July. It was the largest month-on-month decline since a 6.5% drop in May, and weaker than a 3.2% loss forecast in a Reuters poll of economists. Seven out of eight Japanese automakers are seeing global output drop in September, as the global parts and chip shortage weighed on the sector. (Reuters) Regional OPEC+ softens view of market tightness before ministers meet – OPEC+ technical experts downgraded their expectations for how tight global oil markets will be this quarter, a week before ministers meet to decide production policy. The global oil-supply deficit will be just 300,000 barrels a day on average in the fourth quarter, the coalition’s Joint Technical Committee concluded on Thursday, according to delegates. That’s much smaller than the 1.1mn barrel daily shortfall shown in figures initially presented to the panel, which revised its view using fresher data on demand, delegates said. (Bloomberg) Middle east tanker glut sticks above Average as OPEC+ damps outlook – The overhang of supertankers in the Persian Gulf is set to stay above the five-year seasonal average in the coming month. OPEC+ technical experts downgraded their expectations Thursday for how tight global oil markets will be this quarter, a week before ministers meet to decide production policy. The excess of tankers vs cargoes is at 28%, according to the median estimate in a Bloomberg survey of four people involved in the market. (Bloomberg)
- 8. Page 8 of 10 Travel and tourism sector in the Middle East to grow by 27.1% in 2021 – Middle East travel and tourism should grow by 27.1% in 2021, behind the global average of 30.7%, according to the World Travel and Tourism Council (WTTC). The council said that the region’s local economy has benefited from a rise in its domestic tourism spend of 38.6% in 2021, and it is projected to grow by 19.2% in 2022. Changes to international travel restrictions are also expected to provide a significant boost in international spending, growing by 37.9% in 2021, driven by a rise in visitors from neighboring countries, the WTTC said. (Zawya) SABB's net profit falls 15.5% YoY to SR886mn in 3Q2021 – The Saudi British Bank (SABB) recorded net profit of SR886mn in 3Q2021, registering decrease of 15.5% YoY. Total operating profit fell 8.1% YoY to SR1,968mn in 3Q2020. Total income for special commissions/Financing &investments fell 16.1% YoY to SR1,558mn in 3Q2020. Total assets stood at SR269.6bn at the end of September 30, 2021 as compared to SR264.0bn at the end of September 30, 2020. Loans and advances stood at SR163.5bn (+7.6% YoY), while Clients' deposits stood at SR180.2bn at the end of September 30, 2021. EPS came in at SR1.35 in 3Q2021 as compared to loss per share of SR-2.35 in 3Q2020. (Tadawul) Saudi Central Bank assets rise SR18.24bn in September – Assets held by Saudi Arabia’s central bank (SAMA) increased MoM by SR18.24bn to reach SR1.891tn, the bank’s latest statistical report showed. This was accompanied by a monthly growth rate of 0.97%. Looking at the assets’ composition, the central bank’s deposits with banks abroad underwent the largest rise, increasing on a monthly basis by SR42.45bn or 16.1% to SR306.54bn. This might be because it offers higher earnings and is a more liquid asset compared to others. Other miscellaneous assets, on the other hand, fell considerably by SR20.15bn. (Zawya) Saudi Arabia completes early redemption of sukuk valued at $8.8bn – Saudi Arabia on Thursday announced the completion of an early redemption of a portion of outstanding Islamic bonds maturing next year with a total value of SR33bn. The kingdom has also issued new Islamic bonds under its sukuk programme, the finance ministry said in a statement cited by the state news agency. The new sukuk issuance comprises four tranches with a total value of 33.48bn riyals. (Zawya) Saudi Arabia’s September M3 money supply rises 8.4% on year – Saudi Arabian Central Bank in Riyadh has published data on monetary aggregates for September on website. M2 money supply rises 5.7% from year ago. M1 money supply rises 6.9% from year ago. (Bloomberg) Billionaire Olayan family may revive plans for Saudi IPO – The Olayan family, which runs one of Saudi Arabia’s biggest conglomerates, may revive plans to take some of its companies public. Olayan Financing Co. is considering an initial public offering of a holding company of about 25 units, Chief Executive Officer Nabeel Al-Amudi said in an interview with Bloomberg Television. It’s also weighing an IPO of some of its operating firms, he said in Riyadh on the sidelines of Saudi Arabia’s flagship investment forum. (Bloomberg) PIF’s Soudah Development Co. secures SR11bn investment – Public Investment Company-owned Soudah Development Co. has attracted SR11bn of investment for its development of Al Soudah in the Asir region of Saudi Arabia, said CEO Husameddin Al-Madani. Of that $3bn, $800mn is only for infrastructure, including primary and secondary and tertiary roads, and some investment in energy and microgrids, he told Arab News on the sidelines of the FII Summit held in Riyadh. (Zawya) Saudi's Dallah Health buys stake in International Medical Centre Co – Riyadh-based Dallah Healthcare Co has acquired an 8.2% stake in International Medical Co as part of its strategy to expand the business. In a statement to the Tadawul, Dallah Healthcare said that it had acquired the SR289mn stake as part of a plan to eventually acquire 25% as well as to expand its presence to Jeddah. (Zawya) Saudi deal with Euroclear to allow foreigner access to debt – Saudi Arabia reached an agreement with one of the world’s biggest bond clearing systems to settle transactions in its debt market and may appoint four global banks as primary dealers in local government securities. The deal between the kingdom’s Securities Depository Center Company, known as Edaa, and Brussels-based Euroclear Bank will give foreign investors access to the sukuk and bond market within the Saudi Exchange. Under the terms of an agreement signed in Riyadh, the link is expected to become operational in March 2022, according to a statement. (Bloomberg) Saudi Arabia may raise light crude prices to Asia in Dec – Top oil exporter Saudi Arabia may raise prices of light crude grades to Asia in December, supported by a rebound in distillate margins and spot premiums for Middle Eastern oil this month, trade sources said on Friday. After cutting prices for two straight months, state oil giant Saudi Aramco may raise the official selling price (OSP) for flagship Arab Light crude by 30 cents to 90 cents in December, six respondents said in a Reuters survey. The price hike comes as refiners are cranking up output to meet higher demand as countries ease COVID-19 movement restrictions while oil consumption in power sector is rising amid a global crunch in coal and natural gas. (Reuters) Sources: EIG shortlisted as possible buyer for Aramco gas pipelines – US based energy investor EIG has been shortlisted as a potential buyer of Saudi Aramco's gas pipelines, part of a sale that could exceed $17bn and is likely to be completed later this year, three sources familiar with the matter said. Aramco is looking to sell a significant minority stake in its gas pipelines, other sources have previously said. In addition to EIG, private equity firms such Apollo could also be potential buyers, two of the sources said. (Reuters) Moody's affirms the ratings of eight UAE banks, changes outlooks to stable from negative – Moody's Investors Service ("Moody's") has today affirmed the long-term ratings of eight United Arab Emirates (UAE)-based banks: Abu Dhabi Commercial Bank (ADCB), Abu Dhabi Islamic Bank (ADIB), Commercial Bank of Dubai (CBD), Dubai Islamic Bank (DIB), HSBC Bank Middle East Limited (HBME), MashreqBank (Mashreq), National Bank of Fujairah (NBF) and The National Bank of Ras-Al-Khaimah (RAK). Moody's has also affirmed the Baseline Credit Assessments (BCA) and Adjusted BCAs of the eight banks. (Bloomberg) AJMANBAN posts 119.2% YoY rise in net profit to AED28.2mn in 3Q2021 – Ajman Bank (AJMANBAN) recorded net profit of AED28.2mn in 3Q2021, an increase of 119.2% YoY. Income from Islamic financing and investing assets fell 16.3% YoY to AED174.9mn in 3Q2021. Net operating income fell 0.3% YoY to AED144.9mn in 3Q2021. Total assets stood at AED21.5bn at the end of September 30, 2021 as compared to AED21.5bn at the end of December 31, 2020. Islamic financing and investing assets (net) stood at AED15.8bn (-6.8% YTD), while Islamic customers’ deposits stood at AED14bn (-1.5% YTD) at the end of September 30, 2021. EPS came in at AED0.013 in 3Q2021 as compared to AED0.006 in 3Q2020. (DFM) Board of Dubai's DAMAC backs founder's takeover, delisting bid – Dubai’s DAMAC Properties on Thursday said its board has unanimously recommended minority shareholders accept founder Hussain Sajwani’s offer to buy them out and delist the company. If accepted, BlackRock, State Street and other minority
- 9. Page 9 of 10 shareholders will receive AED1.4 in exchange for each share that they hold, according to the offer. Sajwani, who in 2002 set up the developer that owns the only Trump-branded golf course in the Middle East, in September received regulator approval for his takeover bid. (Reuters) Maple launches offer to acquire 100% of Damac’s share capital – Maple Invest Co Limited, a fully-owned vehicle by Hussain Sajwani, has launched its offer to acquire 100% of the issued and paid-up ordinary share capital of Damac Properties Dubai Co PJSC that will pave the way to delist the company. Under the terms of the offer, holders of shares in Damac [excluding Maple and its associated groups] will be entitled to receive Dh1.40 in cash for each Damac share they hold. The compay’s shares closed unchanged at Dh1.25 in Dubai on Thursday. Sajwani, who in 2002 set up the developer that owns the only Trump-branded golf course in the Middle East, in September received regulatory approval for his takeover bid to buy the rest of Damac Properties by about eight per cent. Thebnaire and his family currently hold just under 84% of the company. (Zawya) FAB posts 53.8% YoY rise in net profit to AED3,853.6mn in 3Q2021 – First Abu Dhabi Bank (FAB) recorded net profit of AED3,853.6mn in 3Q2021, an increase of 53.8% YoY. Net interest income rose 10.0% YoY to AED3,140.8mn in 3Q2021. Operating income rose 48.9% YoY to AED6,410.9mn in 3Q2021. Total assets stood at AED982.8bn at the end of September 30, 2021 as compared to AED919.1bn at the end of December 31, 2020. Loans and advances stood at AED403.8bn (+4.4% YTD), while customer accounts and other deposits stood at AED606bn (+12% YTD) at the end of September 30, 2021. Diluted EPS came in at AED0.34 in 3Q2021 as compared to AED0.22 in 3Q2020. (ADX) NBQ posts 29.6% YoY rise in net profit to AED63.2mn in 3Q2021 – National Bank of Umm Al-Qaiwain (NBQ) recorded net profit of AED63.2mn in 3Q2021, an increase of 29.6% YoY. Total interest income and income from Islamic financing products fell 16.1% YoY to AED81.9mn in 3Q2021. Operating Income fell 21.3% YoY to AED59.6mn in 3Q2020. Total assets stood at AED13.3bn at the end of September 30, 2021 as compared to AED13.5bn at the end of December 31, 2021. Loans and advances stood at AED7bn (-8.1% YTD), while customers’ deposits stood at AED7.9bn (-4.3% YTD) at the end of September 30, 2021. EPS came in at AED0.03 in 3Q2021 as compared to AED0.03 in 3Q2020. (ADX) Etisalat completes acquisition of additional stake in EINA – Emirates Telecommunications Group (Etisalat) has completed the acquisition of Abu Dhabi Fund for Development’s 8.7% stake in Etisalat Investment North Africa (EINA). This acquisition has enabled Etisalat to raise its ownership in EINA to 100%, according to a bourse filing on Thursday. The final paid consideration amounted to AED 1.863bn, financed by bank borrowings. EINA holds investments in Société de Participation dans les Télécommunications (SPT) that invests in Maroc Telecom Group. (Zawya) Chipmaker GlobalFoundries valued at $26bn in lackluster Nasdaq debut – Shares of GlobalFoundries Inc (GFS.O), which is owned by Abu Dhabi's sovereign wealth fund Mubadala Investment Co, opened flat on the Nasdaq on Thursday, giving the chipmaker a market capitalization of about $26bn. GlobalFoundries finished its first day of trading at $46.40, slightly lower than the $47 per share it priced in the initial public offering (IPO). The chip maker raised $2.6bn in the third-largest IPO in the United States so far this year, trailing South Korean e- commerce giant Coupang Inc (788.F) and ride hailing company Didi Global Inc. (Reuters) NBB announces 9.3% increase in net profit – National Bank of Bahrain (NBB) has reported a 9.3% increase in its net profit attributable to equity shareholders at BD15.3mn for the third quarter ended 30 September 2021, compared to BD14m in the same period of 2020. The increase in net profit is predominantly due to strong business fundamentals such as higher net interest income resulting from higher loan volumes and following the active repricing of the Group’s balance sheet in line with recent interest rate trends, and increased volume of fees received from debt capital market related activities. Basic and diluted earnings per share increased to 8 fils for the third quarter of 2021 compared with 7 fils in the same period of 2020. (Zawya) BBK net profit increases 3.8% in 9 months – BBK has reported a net profit attributable to the owners of the bank of BHD40.5mn for the nine months ended September 30, 2021, representing an increase of 3.8%. For the third quarter of 2021, the bank achieved a net profit attributable to the owners of BHD12.4mn compared to BHD9.9mn in the same period of last year, an increase of 25.3%. The basic and diluted earnings per share amounted to 8 fils compared to 7 fils during the corresponding period of last year. Total comprehensive income attributable to the owners of the Bank amounted to BD7mn during the third quarter of 2021, compared to BHD19.9mn during the same period last year, representing a decrease of 64.8%. (Zawya)
- 10. Contacts QNB Financial Services Co. W.L.L. Contact Center: (+974) 4476 6666 info@qnbfs.com.qa Doha, Qatar Saugata Sarkar, CFA, CAIA Shahan Keushgerian Head of Research Senior Research Analyst saugata.sarkar@qnbfs.com.qa shahan.keushgerian@qnbfs.com.qa Disclaimer and Copyright Notice: This publication has been prepared by QNB Financial Services Co. W.L.L. (“QNBFS”) a wholly-owned subsidiary of Qatar National Bank (Q.P.S.C.). QNBFS is regulated by the Qatar Financial Markets Authority and the Qatar Exchange. Qatar National Bank (Q.P.S.C.) is regulated by the Qatar Central Bank. This publication expresses the views and opinions of QNBFS at a given time only. It is not an offer, promotion or recommendation to buy or sell securities or other investments, nor is it intended to constitute legal, tax, accounting, or financial advice. QNBFS accepts no liability whatsoever for any direct or indirect losses arising from use of this report. Any investment decision should depend on the individual circumstances of the investor and be based on specifically engaged investment advice. We therefore strongly advise potential investors to seek independent professional advice before making any investment decision. Although the information in this report has been obtained from sources that QNBFS believes to be reliable, we have not independently verified such information and it may not be accurate or complete. QNBFS does not make any representations or warranties as to the accuracy and completeness of the information it may contain, and declines any liability in that respect. For reports dealing with Technical Analysis, expressed opinions and/or recommendations may be different or contrary to the opinions/recommendations of QNBFS Fundamental Research as a result of depending solely on the historical technical data (price and volume). QNBFS reserves the right to amend the views and opinions expressed in this publication at any time. It may also express viewpoints or make investment decisions that differ significantly from, or even contradict, the views and opinions included in this report. This report may not be reproduced in whole or in part without permission from QNBFS. COPYRIGHT: No part of this document may be reproduced without the explicit written permission of QNBFS. Page 10 of 10 Rebased Performance Daily Index Performance Source: Bloomberg Source: Bloomberg Source: Bloomberg Source: Bloomberg (*$ adjusted returns) 60.0 80.0 100.0 120.0 140.0 160.0 Sep-17 Sep-18 Sep-19 Sep-20 Sep-21 QSE Index S&P Pan Arab S&P GCC (0.4%) 1.2% 0.9% 0.3% 0.3% 0.2% (0.1%) (0.5%) 0.0% 0.5% 1.0% 1.5% Saudi Arabia Qatar Kuwait Bahrain Oman Abu Dhabi Dubai Asset/Currency Performance Close ($) 1D% WTD% YTD% Global Indices Performance Close 1D%* WTD%* YTD%* Gold/Ounce 1,783.38 (0.9) (0.5) (6.1) MSCI World Index 3,174.73 (0.1) 0.7 18.0 Silver/Ounce 23.90 (0.7) (1.7) (9.5) DJ Industrial 35,819.56 0.2 0.4 17.0 Crude Oil (Brent)/Barrel (FM Future) 84.38 0.1 (1.3) 62.9 S&P 500 4,605.38 0.2 1.3 22.6 Crude Oil (WTI)/Barrel (FM Future) 83.57 0.9 (0.2) 72.2 NASDAQ 100 15,498.39 0.3 2.7 20.3 Natural Gas (Henry Hub)/MMBtu 5.42 (3.4) 6.7 126.8 STOXX 600 475.51 (1.1) (0.0) 12.5 LPG Propane (Arab Gulf)/Ton 138.25 2.2 (1.8) 83.7 DAX 15,688.77 (1.2) 0.1 7.4 LPG Butane (Arab Gulf)/Ton 166.00 (1.3) 1.1 121.3 FTSE 100 7,237.57 (1.0) (0.1) 12.2 Euro 1.16 (1.1) (0.7) (5.4) CAC 40 6,830.34 (0.8) 0.6 16.1 Yen 113.95 0.3 0.4 10.4 Nikkei 28,892.69 (0.3) (0.2) (4.7) GBP 1.37 (0.8) (0.5) 0.1 MSCI EM 1,264.75 (0.9) (2.2) (2.1) CHF 1.09 (0.4) 0.1 (3.3) SHANGHAI SE Composite 3,547.34 0.6 (1.3) 4.1 AUD 0.75 (0.3) 0.7 (2.3) HANG SENG 25,377.24 (0.7) (2.9) (7.1) USD Index 94.12 0.8 0.5 4.7 BSE SENSEX 59,306.93 (1.4) (2.5) 21.0 RUB 70.94 1.0 0.9 (4.7) Bovespa 103,500.70 (2.7) (1.6) (20.4) BRL 0.18 0.2 0.2 (7.8) RTS 1,843.83 (1.9) (1.8) 32.9 155.0 145.4 134.2