QNBFS Daily Market Report February 16, 2022
•
0 likes•107 views

The QE Index rose 0.2% to close at 12,714.3. Gains were led by the Transportation and Real Estate indices, gaining 1.8% and 0.7%, respectively.

Recommended
Recommended
More Related Content
What's hot
What's hot (20)
Similar to QNBFS Daily Market Report February 16, 2022
Similar to QNBFS Daily Market Report February 16, 2022 (20)
More from QNB Group
More from QNB Group (20)
Recently uploaded
Recently uploaded (20)
QNBFS Daily Market Report February 16, 2022
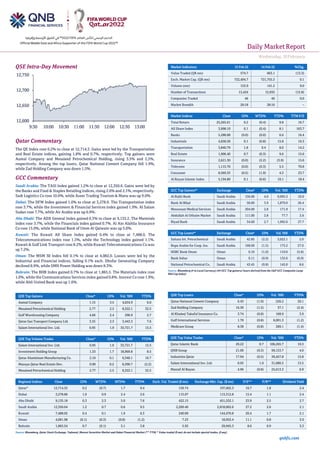
- 1. Daily MarketReport Wednesday,16February 2022 qnbfs.com QSE Intra-Day Movement Qatar Commentary The QE Index rose 0.2% to close at 12,714.3. Gains were led by the Transportation and Real Estate indices, gaining 1.8% and 0.7%, respectively. Top gainers were Aamal Company and Mesaieed Petrochemical Holding, rising 3.5% and 2.5%, respectively. Among the top losers, Qatar National Cement Company fell 1.9%, while Zad Holding Company was down 1.5%. GCC Commentary Saudi Arabia: The TASI Index gained 1.2% to close at 12,350.6. Gains were led by the Banks and Food & Staples Retailing indices, rising 2.6% and 2.1%, respectively. Sadr Logistics Co rose 10.0%, while Aseer Trading Tourism & Manu was up 9.0%. Dubai: The DFM Index gained 1.0% to close at 3,278.9. The Transportation index rose 3.7%, while the Investment & Financial Services index gained 1.9%. Al Salam Sudan rose 7.7%, while Air Arabia was up 6.9%. Abu Dhabi: The ADX General Index gained 0.3% to close at 9,135.2. The Materials index rose 3.7%, while the Financials index gained 0.7%. Al Ain Alahlia Insurance Co rose 15.0%, while National Bank of Umm Al Qaiwain was up 5.0%. Kuwait: The Kuwait All Share Index gained 0.4% to close at 7,488.0. The Telecommunications index rose 1.3%, while the Technology index gained 1.1%. Kuwait & Gulf Link Transport rose 8.2%, while Kuwait Telecommunications Co was up 7.2%. Oman: The MSM 30 Index fell 0.1% to close at 4,082.0. Losses were led by the Industrial and Financial indices, falling 0.1% each. Dhofar Generating Company declined 8.9%, while SMN Power Holding was down 8.3%. Bahrain: The BHB Index gained 0.7% to close at 1,865.5. The Materials index rose 1.0%, while the Communications Services index gained 0.8%. Inovest Co rose 1.9%, while Ahli United Bank was up 1.6%. QSE Top Gainers Close* 1D% Vol. ‘000 YTD% Aamal Company 1.15 3.5 4,634.9 6.0 Mesaieed Petrochemical Holding 2.77 2.5 8,322.1 32.5 Gulf Warehousing Company 4.66 2.4 296.9 2.7 Qatar Gas Transport Company Ltd. 3.55 2.3 3,443.3 7.6 Salam International Inv. Ltd. 0.95 1.9 33,721.7 15.5 QSE Top Volume Trades Close* 1D% Vol. ‘000 YTD% Salam International Inv. Ltd. 0.95 1.9 33,721.7 15.5 Investment Holding Group 1.33 1.7 18,969.8 8.5 Qatar Aluminium Manufacturing Co. 2.10 0.1 9,348.1 16.7 Mazaya Qatar Real Estate Dev. 0.90 0.2 8,390.7 (2.2) Mesaieed Petrochemical Holding 2.77 2.5 8,322.1 32.5 Market Indicators 15 Feb 22 14 Feb 22 %Chg. Value Traded (QR mn) 574.7 663.1 (13.3) Exch. Market Cap. (QR mn) 722,494.7 721,755.3 0.1 Volume (mn) 153.9 141.2 9.0 Number of Transactions 13,424 15,935 (15.8) Companies Traded 46 46 0.0 Market Breadth 26:18 28:16 – Market Indices Close 1D% WTD% YTD% TTM P/E Total Return 25,265.61 0.2 (0.4) 9.8 16.7 All Share Index 3,998.10 0.1 (0.4) 8.1 163.7 Banks 5,288.08 (0.0) (0.0) 6.6 16.4 Industrials 4,658.58 0.1 (0.8) 15.8 16.3 Transportation 3,840.79 1.8 0.4 8.0 14.2 Real Estate 1,906.40 0.7 (0.3) 9.6 15.6 Insurance 2,621.30 (0.0) (2.2) (3.9) 15.6 Telecoms 1,115.70 (0.0) (0.3) 5.5 70.8 Consumer 8,569.33 (0.5) (1.9) 4.3 23.7 Al Rayan Islamic Index 5,194.80 0.1 (0.6) 10.1 18.4 GCC Top Gainers## Exchange Close# 1D% Vol. ‘000 YTD% Al Rajhi Bank Saudi Arabia 156.00 4.0 9,995.3 10.0 Bank Al Bilad Saudi Arabia 58.60 3.9 1,879.0 26.4 Mouwasat Medical Services Saudi Arabia 204.00 2.8 171.9 17.4 Abdullah Al Othaim Market Saudi Arabia 111.00 2.8 77.7 2.6 Riyad Bank Saudi Arabia 34.60 2.7 1,992.6 27.7 GCC Top Losers## Exchange Close# 1D% Vol.‘000 YTD% Sahara Int. Petrochemical Saudi Arabia 42.85 (2.2) 3,022.1 2.0 Bupa Arabia for Coop. Ins. Saudi Arabia 168.00 (1.5) 175.2 27.9 HSBC Bank Oman Oman 0.10 (1.0) 110.0 (5.8) Bank Sohar Oman 0.11 (0.9) 132.6 (6.9) National Petrochemical Co. Saudi Arabia 43.45 (0.8) 145.0 8.6 Source: Bloomberg (# in Local Currency) (## GCC Top gainers/ losers derived from the S&P GCC Composite Large Mid Cap Index) QSE Top Losers Close* 1D% Vol. ‘000 YTD% Qatar National Cement Company 6.43 (1.9) 226.2 26.1 Zad Holding Company 16.30 (1.5) 37.1 (2.4) Al Khaleej Takaful Insurance Co. 3.74 (0.8) 168.9 3.9 Gulf International Services 1.70 (0.8) 6,001.3 (1.2) Medicare Group 8.38 (0.8) 289.1 (1.4) QSE Top Value Trades Close* 1D% Val. ‘000 YTD% Qatar Islamic Bank 20.22 0.7 106,265.7 10.3 QNB Group 21.00 (0.3) 99,153.7 4.0 Industries Qatar 17.94 (0.5) 39,457.8 15.8 Salam International Inv. Ltd. 0.95 1.9 31,686.5 15.5 Masraf Al Rayan 4.96 (0.8) 25,613.3 6.9 Regional Indices Close 1D% WTD% MTD% YTD% Exch. Val. Traded ($ mn) Exchange Mkt. Cap. ($ mn) P/E** P/B** Dividend Yield Qatar* 12,714.32 0.2 (0.7) 1.7 9.4 159.74 197,602.3 16.7 1.8 2.4 Dubai 3,278.86 1.0 0.9 2.4 2.6 115.07 113,312.8 15.4 1.1 2.4 Abu Dhabi 9,135.18 0.3 2.3 5.0 7.6 422.15 451,532.1 23.9 2.5 2.7 Saudi Arabia 12,350.64 1.2 0.7 0.6 9.5 2,269.40 2,818,062.6 27.2 2.6 2.1 Kuwait 7,488.02 0.4 0.1 1.9 6.3 240.09 144,470.8 20.4 1.7 2.1 Oman 4,081.98 (0.1) (0.3) (0.8) (1.2) 7.23 18,932.4 11.1 0.8 3.9 Bahrain 1,865.54 0.7 (0.1) 3.1 3.8 5.92 29,945.3 8.6 0.9 3.3 Source: Bloomberg, Qatar Stock Exchange, Tadawul, Muscat Securities Market and Dubai Financial Market (** TTM; * Value traded ($ mn) do not include special trades, if any) 12,600 12,650 12,700 12,750 9:30 10:00 10:30 11:00 11:30 12:00 12:30 13:00
- 2. Daily MarketReport Wednesday,16February 2022 qnbfs.com Qatar Market Commentary • The QE Index rose 0.2% to close at 12,714.3. The Transportation and Real Estate indices led the gains. The index rose on the back of buying support from foreign shareholders despite selling pressure from Qatari, GCC and Arab shareholders. • Aamal Company and Mesaieed Petrochemical Holding were the top gainers, rising 3.5% and 2.5%, respectively. Among the top losers, Qatar National Cement Company fell 1.9%, while Zad Holding Company was down 1.5%. • Volume of shares traded on Tuesday rose by 9.0% to 153.9mn from 141.2mn on Monday. However, as compared to the 30-day moving average of 176.9mn, volume for the day was 13% lower. Salam International Inv. Ltd. and Investment Holding Group were the most active stocks, contributing 21.9% and 12.3% to the total volume, respectively. Overall Activity Buy %* Sell %* Net (QR) Qatari Individuals 25.33% 35.55% (58,774,300.0) Qatari Institutions 20.53% 40.03% (112,056,893.5) Qatari 45.86% 75.59% (170,831,193.5) GCC Individuals 0.67% 0.56% 632,863.4 GCC Institutions 1.17% 3.26% (11,978,379.8) GCC 1.85% 3.82% (11,345,516.4) Arab Individuals 6.76% 7.50% (4,276,848.3) Arab Institutions 0.01% 0.00% 36,000.0 Arab 6.76% 7.50% (4,240,848.3) Foreigners Individuals 2.78% 1.68% 6,336,519.3 Foreigners Institutions 42.75% 11.41% 180,081,039.0 Foreigners 45.53% 13.09% 186,417,558.2 Source: Qatar Stock Exchange (*as a % of traded value) Earnings Releases, Global Economic Data and Earnings Calendar Earnings Releases Company Market Currency Revenue (mn) 4Q2021 % Change YoY Operating Profit (mn) 4Q2021 % Change YoY Net Profit (mn) 4Q2021 % Change YoY Arabian Internet and Communication Services Company* Saudi Arabia SR 7,816.0 13.4% 899.0 18.8% 833.0 18.7% Yamama Cement Co.* Saudi Arabia SR 735.8 -23.0% 163.8 -55.9% 160.6 -60.4% Ithmaar Holding* Dubai AED 1,689.1 -1.2% 1,130.1 14.3% 221.5 N/A Air Arabia* Dubai AED 3,174.1 71.5% – – 719.9 N/A Islamic Arab Insurance Company* Dubai AED 1,088.1 -6.8% 161.7 -2.9% 47.8 -69.6% Union Properties* Dubai AED 402.4 7.1% (903.7) N/A (903.7) N/A Unikai Foods* Dubai AED 250.1 5.5% 14.6 93.6% 10.5 194.3% National Central Cooling Co.* Dubai AED 1,955.1 12.3% 623.2 -1.1% 585.2 6.3% Amanat Holdings* Dubai AED 412.9 187.6% (3.0) N/A 280.8 2685.5% Finance House* Abu Dhabi AED 137.2 -10.6% 193.4 -4.0% 22.8 8.9% Al Khaleej Investment* Abu Dhabi AED 16.9 -12.3% – – 12.3 N/A Bahrain Duty Free Shop Complex* Bahrain BHD 0.8 -94.8% 0.0 -94.5% 2.1 6.0% Ithmaar Holding* Bahrain USD 459.911 -1.2% 307.7 14.3% 38.6 N/A Source: Company data, DFM, ADX, MSM, TASI, BHB. (*Financial for FY2021) Global Economic Data Date Market Source Indicator Period Actual Consensus Previous 02/15 US Bureau of Labor Statistics PPI Final Demand MoM Jan 1.00% 0.50% 0.40% 02/15 US Bureau of Labor Statistics PPI Ex Food and Energy MoM Jan 0.80% 0.50% 0.60% 02/15 US Bureau of Labor Statistics PPI Final Demand YoY Jan 9.70% 9.10% 9.80% 02/15 US Bureau of Labor Statistics PPI Ex Food and Energy YoY Jan 8.30% 7.90% 8.50% 02/15 UK UK Office for National Statistics Jobless Claims Change Jan -31.9k -- -51.6k 02/15 UK UK Office for National Statistics ILO Unemployment Rate 3Mths Dec 4.10% 4.10% 4.10% 02/15 UK UK Office for National Statistics Employment Change 3M/3M Dec -38k -58k 60k 02/15 EU Eurostat Trade Balance SA Dec -9.7b -4.7b -1.8b 02/15 EU Eurostat Trade Balance NSA Dec -4.6b -- -1.5b 02/15 EU Eurostat GDP SA QoQ 4Q P 0.30% 0.30% 0.30% 02/15 EU Eurostat GDP SA YoY 4Q P 4.60% 4.60% 4.60% 02/15 Japan Economic and Social Research I GDP Annualized SA QoQ 4Q P 5.40% 6.00% -2.70% 02/15 Japan Economic and Social Research I GDP SA QoQ 4Q P 1.30% 1.50% -0.70% 02/15 Japan Economic and Social Research I GDP Nominal SA QoQ 4Q P 0.50% 0.80% -1.00% 02/15 Japan Economic and Social Research I GDP Deflator YoY 4Q P -1.30% -1.30% -1.20% 02/15 Japan Ministry of Economy Trade and Industry Industrial Production MoM Dec F -1.00% -- -1.00% 02/15 Japan Ministry of Economy Trade and Industry Industrial Production YoY Dec F 2.70% -- 2.70% Source: Bloomberg (s.a. = seasonally adjusted; n.s.a. = non-seasonally adjusted; w.d.a. = working day adjusted)
- 3. Daily MarketReport Wednesday,16February 2022 qnbfs.com Earnings Calendar Tickers Company Name Date of reporting 4Q2021 results No. of days remaining Status GISS Gulf International Services 17-Feb-22 1 Due SIIS Salam International Investment Limited 20-Feb-22 4 Due DOHI Doha Insurance Group 20-Feb-22 4 Due MCGS Medicare Group 21-Feb-22 5 Due MPHC Mesaieed Petrochemical Holding Company 21-Feb-22 5 Due MERS Al Meera Consumer Goods Company 22-Feb-22 6 Due WDAM Widam Food Company 23-Feb-22 7 Due DBIS Dlala Brokerage & Investment Holding Company 23-Feb-22 7 Due QATI Qatar Insurance Company 27-Feb-22 11 Due AKHI Al Khaleej Takaful Insurance Company 28-Feb-22 12 Due QOIS Qatar Oman Investment Company 3-Mar-22 15 Due QFBQ Qatar First Bank 23-Mar-22 35 Due Source: QSE Qatar BRES posts 23% YoY decrease but 86.3% QoQ increase in net profit in 4Q2021 – Barwa Real Estate Company's (BRES) net profit declined 23% YoY (but rose 86.3% on QoQ basis) to QR377.9mn in 4Q2021. EPS amounted to QR0.286 in FY2021 as compared to QR0.312 in FY2020. The board of directors proposed the distribution of a cash dividend of 17.5% of the shares’ par value at the rate of QR 0.175 per share. The proposed cash dividend is subject to the approval of the shareholders’ general assembly. (QSE) Giant Qatar firm Baladna (BLDN QD) eyes $500-M integrated dairy facility in Philippines – Baladna, the largest food and dairy producer in Qatar, plans to set up a $500-million integrated dairy facility in the Philippines, the Department of Agriculture (DA) said on Monday. In a statement, the DA said the planned large-scale and fully integrated dairy facility was expected to bolster local production and jump-start investments in the country’s dairy industry. Agriculture Secretary William Dar said the agency had identified five possible locations for the dairy facility that will be visited by the Baladna team in the next few weeks. It is designed to be climate-independent using world-class management systems. The integrated dairy facility, a partnership between Baladna, the DA and the Department of Trade and Industry (DTI), will significantly increase local milk production by120 million liters from the current level of 26.71 million liters. “This will be bringing the Philippines’ total milk production to 146.71 million liters, thus contributing to addressing the local demand,” the DA added. In 2020, local milk production reached 26.71 million liters, up by 9.5 percent from 24.38 million liters the previous year. Baladna said that its main consideration for supporting the Philippine government was to help bolster domestic dairy production. Baladna supplies over 95 percent of Qatar’s fresh dairy products. It is into raising livestock and production of dairy products including milk, yogurt, cheese, as well as juices and animal fertilizers. Dar said in a recent presentation in Dubai, United Arab Emirates that the Philippines is a major importerof dairy products, particularly milk powder, with importers and processors supplying the majority of the country’s annual dairy requirement. Baladna owns more than 24,000 Holstein cows on its 2.6 million square-meter facility with 40 state-of-the-art barns. Every day, it produces about 450 tons of fresh milk and juice products and has more than 1,650 employees. Meanwhile, the DTI, through the Board of Investments, is supporting the project through the grant of incentives under the Corporate Recovery and Tax Incentives for Enterprises (Create) law. “The investments will be able to generate 2,000 new jobs during the initial phase of its first full year of operations, providing significant opportunities for domestic employment,” Dar said. The DA and the Department of Trade and Industry (DTI) were able to sign a memorandum of understanding (MOU) with Baladna QPSC during a business engagement held in Dubai, United Arab Emirates recently. (Philippine Daily Inquirer) Inma Holding announces the closure of nominations for board membership – Inma Holding announced the closure of the period for nomination for the membership of its Board of Directors for 2022-2024 on 15/02/2022 at 02:00 PM. (QSE) Investment Holding Group announces the resignation of Chief Executive Officer – Investment Holding Group announced that Mr. Samer Wahbeh resigned from his position Chief Executive Officer effective 15/02/2022. (QSE) PSA: Qatar's inflation jumps 4.16% y-o-y in January – The core inflation in Qatar's grew faster than the general consumer price index (CPI) inflation year-on-year in January 2022, according to the official statistics. The CPI of January 2022 excluding “housing, water, electricity, gas and other fuels, surged 5.49% year-on-year; while the general CPI inflation rose 4.16% in the review period, said the figures released by the Planning and Statistics Authority. Qatar's cost of living,based onCPI inflation, rose on a yearly basis this January mainly on higher expenses towards recreation, food, transport and clothing. In its latest Qatar Economic Outlook, PSA said the country is expected to see imported and domestic inflationary pressures due to the rise in prices of basic commodities in global markets caused by the bottlenecks in commodity supply chains as well as the negative repercussions of expansionary financial and monetary policies. On a monthly basis, the country's CPI inflation was down 0.97%; while core inflation fell 1.31% in January 2022. The index of recreation and culture, which has an 11.13% weight in the CPI basket, soared 26.42% year-on-year even as it shrank 7.73% month-on-month in January 2022. Food and beverages, which has a weight of 13.45% in the CPI basket, witnessed 7.23% and 1.91% expansion on yearly and monthly basis respectively in January 2022. The index of transport, which has a 14.59% weight, was seen shooting up 6.58% year-on-year but declined 0.28% on monthly basis this January. (Gulf-Times.com) Qatar expected to see significant rise in hotel rooms this year – The supply of hotel keys, coupled with serviced apartments is expected to increase to 45,000 rooms by the end of the third quarter of 2022, in time for the FIFA World Cup, Cushman and Wakefield Qatar (CWQ) has said in a report released on Tuesday. According to the Qatar Q4 Real Estate Market Review report, the existing supply of hotel keys, coupled with serviced apartments now provide 38,674 rooms. The overall development pipeline is expected to see the hotel supply in Qatar increase to more than 50,000 hotel keys within the next five years, the report said. (Qatar Tribune) Dukhan Bank launches 'Direct to Account' transfers with Western Union – Dukhan Bank, Qatar’s leading banking player, has announced the launch of the 'direct to account' money transfer service with Western Union money transfer services through its online banking offering via web and app and its ATM’s across the country. This unique service is the first of many to come and falls under the DRemit (Dukhan Bank Remittance) platform, which includes all customers’ remittances and aims to better facilitate their transfers. The service comes as an extension
- 4. Daily MarketReport Wednesday,16February 2022 qnbfs.com to Dukhan Bank’s existing ‘account-to-cash’ international remittances solution with Western Union, to now include direct ‘account-to-account’ remittances as well. (Peninsula Qatar) Malls witness strong consumer spending increase in Q4 last year – Qatar retail sector performed well in the fourth quarter (Q4) of last year with malls registering strong increase in retail spending in major malls. “There was strong growth in retail performance in many of Qatar’s major malls in Q4. It has been reported to Cushman and Wakefield that retail spending in these developments in December (prior to the outbreak of Omicron) was up bybetween 10 percent and 20percent on the same month in 2019,” said the Q4 Real Estate Market Review report released yesterday by Cushman & Wakefield. “Retail malls have also indicated there has been a recovery in supply chains for retail stock; however, problems remain in securing building materials, which has delayed the opening of a number of new stores in recent months,” it added. Qatar’s supply of organized indoor retail accommodation exceeded 1.5 million sq m of gross leasable area in 2021. The most recent retail destinations include Abu Sidra Mall and The Galleria, both of which opened partially but are yet to reach full capacity. The current supply of organized retail space in Qatar represents an increase of more than 100% in six years. (Peninsula Qatar) QFTH a catalyst to transform financial services industry of Qatar – The Fintech sector has had a very strong start in Qatar and has reached new levels of maturity. There is traction in the market as entrepreneurs have come up with new ideas and products, said an official during the Qatar FinTech Hub (QFTH) third Virtual Demo Day. Qatar FinTech Hub’s demo day for wave 3 of incubator and accelerator Programs presented the ideal launchpad for 16 graduating fintechs who introduced new innovative services that will accelerate the digital transformation in local, regional and global financial markets. The event witnessed the outcomes of the third wave of the incubator and accelerator programs as these programs have become the landmark on the international fintech calendar demonstrating the success that QFTH has achieved so far. Hasan Askari, Director at EY Qatar introduced the incubator fintechs. “In Qatar the fintech sector has had a very strong start. We have reached new levels of maturity and the ecosystem is responding well to the growing market demands for the products and services. We are seeing traction in the market where entrepreneurs are able to come up with new ideas and products. Overall, for the Middle East region 2021 was a very strong year, we saw more than 100 deals worth more than $2bn in total value,” he said. (Peninsula Qatar) Govt support to agri sector helps boost local food production – The direct government financial support to agriculture sector worth QR70m per year has helped enhance local production at a fast pace to ensure food security in the country.“The direct government support provided by the Ministry of Munic-ipality valuing QR70m annually and provision of facilities by Qatar Development Bank (QDB) have led to increase in local production including vegetables, poultry, meat products, table eggs and fish,” said Director of the Food Security Department Dr. Masoud Jarallah Al Marri. He was speaking to Qatar Radio yesterday about country's food security. (Peninsula Qatar) Ahli bank brings Apple Pay to customers – Ahli Bank has brought its customers Apple Pay, a safer, more secure and private way to pay that helps customers avoid handing their payment card to someone else, touching physical buttons or exchanging cash-and uses the power of iPhone to protect every transaction. Customers simply hold their iPhone or Apple Watch near a payment terminal to make a contactless payment. Every Apple Pay purchase is secure because it is authenticated with Face ID, Touch ID, or device passcode, as well as a one-time unique dynamic security code. Apple Pay is accepted in grocery stores, pharmacies, taxis, restaurants, coffee shops, retail stores, and many more places. Customers can also use Apple Pay on iPhone, iPad, and Mac to make faster and more convenient purchases in apps or on the web in Safari without having to create accounts or repeatedly type in shipping and billing information. (Peninsula Qatar) International Fed to raise rates 25 bps in March but calls for 50 bps grow louder – The U.S. Federal Reserve will kick off its tightening cycle in March with a 25- basis-point interest rate rise, a Reuters poll of economists found, but a growing minority say it will opt for a more aggressive half-point move to tamp down inflation. While inflation is rising across the globe, it is particularly hot in the United States, hitting a 40-year high last month. That is putting pressure on the Fed to not only raise rates from a record low but also to reduce its nearly $9 trillion balance sheet, drastically inflated by emergency bond purchases as the Fed resuscitated the economy from COVID-19 pandemic damage. Now that the economy has recovered its pre-pandemic level, all 84 respondents in a Reuters poll taken Feb. 7-15 expected the Fed to raise the federal funds rate by at least 25 basis points at its upcoming March 15-16 meeting. Almost a quarter of those respondents, 20, forecast a 50-basis-point move to 0.50-0.75% following debate in markets over the past week after Fed officials discussed the merits of such a move. Rate futures are pricing in more than a 50% likelihood of a half-point hike. (Reuters) US Jan wholesale inflation increased 9.7% from year ago – Wholesale inflation in the United States surged again last month, rising 9.7% from a year earlier in a sign that price pressures remain high at all levels of the economy. The Labor Department said Tuesday that its producer price index — which measures inflation before it reaches consumers — jumped 1% from December. The year-over-year increase was down from the record 9.8% recorded in both November and December but was well above what economists had been expecting. Excluding volatile food and energy prices, wholesale inflation rose 0.8% from December and 8.3% from January 2021. Last week, the government reported that inflation at the consumer level soared over the past year at its highest rate in four decades, squeezing households, wiping out pay raises and reinforcing the Federal Reserve’s decision to begin raising borrowing rates. The 7.5% price surge ranged across the economy, from food and furniture to apartment rents, airline fares and electricity. Inflation, under control for four decades, re-emerged as an economic issue last year as the United States rebounded with unexpected speed from 2020′s short but devastating coronavirus recession. Caught off guard by the bounce-back, companies scrambled to find supplies and workers to meet an unexpected surge in orders from customers flush with government relief checks. Factories, ports and freight yards came under strain. Shipments were delayed and prices began to rise. The Labor Department report showed that wholesale goods prices rose 1.3% last month from December and services climbed 0.7%, pulled up by a steep increase in the cost of outpatient hospital services. (Qatar Tribune) UK jobs market sends warning signal to Bank of England – Britain's labour market is flashing some warning signs for a central bank on guard against a wage-inflation spiral, economists said on Tuesday after official data showed a shrinking workforce and record levels of vacancies. Annual pay growth in the final quarter of 2021 picked up to 4.3% from 4.2% in the three months to November, reflecting bigger Christmas bonuses than a year ago. The increase was above all forecasts in a Reuters poll of economists and the Bank of England's prediction. The central bank's Monetary Policy Committee on Feb. 3 said it expected to tightening monetary policy again soon after raising interest rates for the second time in two months to curb surging inflation pressures. "December's pick-up in wage growth will maintain the pressure on the MPC to hike the Bank Rate again at next month's meeting," Samuel Tombs, an economist at Pantheon Macroeconomics, said in a note to clients. James Smith, at ING, said pay growth appeared to have stabilised at its pre-pandemic levels that were consistent with a tight jobs market. "However, we still doubt that the UK is headed for a wage-price spiral that would justify the six rate hikes markets are now expecting from the BoE this year," Smith said. The highest inflation in nearly 30 years means that in real terms pay fell in the three months to December for the first time since mid-2020, when many employees were on reduced furlough pay, according to the Office for National Statistics' preferred CPIH inflation measure. (Reuters) China's factory inflation hits 6-month low on government curbs – China's factory-gate inflation cooled to its slowest pace in six months in January, official data showed on Wednesday, as government measures to control surging raw material costs weighed on producer prices. The producer price index (PPI) increased 9.1% from a year ago, the data showed, slower than
- 5. Daily MarketReport Wednesday,16February 2022 qnbfs.com the 9.5% growth tipped by a Reuters poll and a 10.3% gain in December, the National Bureau of Statistics (NBS) said in a statement. It was the weakest pace since July. Consumer price inflation also slowed year-on- year in January, the data showed. The world's second-biggest economy faces multiple headwinds, weighed down by persistent weakness in the property sector and strict anti-coronavirus measures that have sapped consumer confidence and spending. But steady falls in factory-gate price inflation from October's 26-year high have provided a buffer to downstream firms struggling with high raw material costs and supply shocks. Globally, inflation is likely to persist for some time, but China's ability to cope with abnormal price fluctuations has improved, the country's state planner said earlier this month. The supply of energy sources such as coal, oil and gas will be "guaranteed", the National Development and Reform Commission (NDRC) said, noting it expects producer price inflation to slow further this year while consumer price inflation picks up. (Reuters) Japan's economy rebounds on solid spending, Omicron clouds outlook – Japan's economy rebounded in the final three months of 2021 as falling coronavirus cases helped prop up consumption, though rising raw material costs and a spike in new Omicron variant infections cloud the outlook. Bank of Japan Governor Haruhiko Kuroda also highlighted escalating tensions in Ukraine as a fresh risk to the central bank's forecast for a moderate economic recovery. The world's third-largest economy expanded an annualised 5.4% in October-December after contracting a revised 2.7% in the previous quarter, government data showed on Tuesday, falling short of a median market forecast for a 5.8% gain. Some analysts expect the economy to slump again in the current quarter as rising COVID-19 cases keep households from shopping and supply chain disruptions hit factory output. "The economy will likely stall in January- March or it could even contract, depending on how the Omicron variant affects service-sector consumption," said Takeshi Minami, chief economist at Norinchukin Research Institute. Economic growth was driven largely by a 2.7% quarter-on-quarter rise in private consumption, which accounts for more than half of Japan's gross domestic product (GDP). (Reuters) Regional Saudi Arabia's January inflation up 1.2% on higher gas prices – Saudi Arabia's consumer price index rose 1.2% in January compared to the same time in 2021 as transport costs spiraled higher, according to government data released on Tuesday. However, prices were unchanged from December 2021, the Saudi General Authority for Statistics said. The YoY rise was mainly the result of higher prices for transport, which rose by 4.9% on the back of higher gasoline prices, which jumped 34.5% YoY, the data showed. Last year, Saudi Arabia, the world’s biggest oil producer, said it would place a cap on gasoline prices at the pump to cushion domestic consumers from rising prices. The food and beverages index rose 2%, mainly due to an increase in the price of foodstuff, particularly vegetables. In contrast, housing, water, electricity, gas, and other fuels prices edged down 1.3% due to the decline in the actual rentals for housing by 1.7%. Clothing and footwear were cheaper too in January. (Zawya) Aramco Trading, Red Sea Petrochemicals sign crude oil supply agreement – Saudi Aramco Trading signed with Egypt’s Red Sea National Petrochemicals Company a non-binding crude oil supply and product offtake agreement, a statement by Aramco Trading said on Tuesday. Under the agreement, Aramco Trading will supply 100,000 barrels per day of Arabian Crude into Red Sea’s Refining and Petrochemical complex, which is expected to be built at the Suez Canal Economic Zone in Ain Sokhna. The agreement will pave the way for Aramco Trading to buy products from Red Sea, which include polymers, olefins, and liquid refined and petrochemical products, the company added. (Reuters) UAE sovereign wealth funds with combined assets of $1.4tn top GCC – Leading UAE sovereign wealth funds (SWFS) together have emerged top in the region with $1.4tn in aggregate assets under their management. Top five SWFs from the UAE, such as Abu Dhabi Investment Authority, Investment Corporation of Dubai (ICD), Mubadala Investment Company, Abu Dhabi Developmental Holding Company and Emirates Investment Authority (EIA) are ranked among top 20 in the top 100 list of the Sovereign Wealth Fund Institute. While Adia is ranked fourth in the global ranking with an estimated assets of $697.86bn, Dubai’s Investment Corporation of Dubai comes second with $301.6bn worth assets under its management. (Bloomberg) UAE's Dragon Oil announces first oil find in Egypt's Gulf of Suez – Dubai government-owned Dragon Oil has made its first oil discovery in Egypt's Gulf of Suez on Tuesday. The discovery is one of the largest in the area in the past 20 years, and the field could contain around 100mn barrels in reserves. The announcement was made on the sidelines of the now- running Egypt Petroleum Show (EGYPS) 2022. Dragon Oil in 2019 acquired BP’s stake at the Gulf of Suez Oil Company (GUPCO). (Zawya) Air Arabia swings to $196mn profit as air travel industry recovers – UAE budget carrier Air Arabia swung back to profit in 2021 after revenues surged more than 70% amid a gradual recovery in the air travel industry. Net profit for the year reached AED720mn ($196mn), compared to a loss of AED192.18mn in the previous 12 months, the airline said in a filing to the Dubai Financial Market (DFM) on Tuesday. For the fourth quarter in 2021, net profit stood at AED467mn,up from AED20mn in the same period a year earlier. The company, which also attributed the positive results to its “tight cost scrutiny”, is optimistic about returning to pre-pandemic levels, but said it remains cautious, citing that the “pandemic is not over yet.” (Zawya) UAE's ADNOC and Borealis plan to IPO minority stake in Borouge – Abu Dhabi National Oil Company (ADNOC) and Austria’s Borealis AG are considering a potential IPO of a minority stake in their joint venture plastics business Borouge, the state oil company said in a statement on Tuesday. Abu Dhabi-based polyolefins maker Borouge consists of Borouge ADP, the production company, and Borouge Pte, which handles sales and marketing. ADNOC holds 60% stake in Borouge ADP, with Borealis holding 40%. Both companies have a 50% shareholding in Borouge Pte. (Zawya) Dubai's Amanat Holding posts 28-fold jump in net profit to $76.4mn – Dubai’s Amanat Holdings has recommended its highest-ever dividend payout after full-year net profit for 2021 surged 28-fold, supported by income growth in its healthcare and education investments. The company recorded a net profit of AED280.8mn ($76.4mn) for the year, up by more than 2,600% from just AED10.1mn a year earlier, the company said in a disclosure to the Dubai Financial Market (DFM) on which its shares trade. With the strong results, the company has recommended distributing dividends worth AED150mn, which is 53% of profit attributable to equity holders or six percent of the company’s share capital. Total income reached AED367mn, a five-fold increase on the AED70.6mn recorded in the previous 12 months. (Zawya) Dubai Islamic Bank's $750mn sukuk lists on Nasdaq – Dubai Islamic Bank (DIB), the UAE’s largest Islamic lender, has listed on Nasdaq Dubai its $750mn sukuk, which was more than 2.5 times oversubscribed. The five- year senior sukuk offering is a first inthe UAE this year and is part of DIB’s $7.5bn sukuk program. In a new notice, Nasdaq Dubai said the sukuk will be admitted to trading on the exchange today, February 15. The bonds have been priced at 95 basis points with a profit rate of 2.74 percent. It is said to have the lowest-ever credit spread on any of the lender’s fixed-rate senior issuances. (Zawya) Damac shares stop trading on DFM as Hussain Sajwani plans to take full ownership – Property developer Damac has suspended trading on Dubai Financial Market (DFM) as the company continues on its course towards going private. In a statement to Nasdaq Dubai, Alpha Star Holding V Limited, of which Damac is the parent company, said Damac shareholders were notified that the notice period for the mandatory acquisition ended on 13 February 2022. Maple Invest Co Limited has not received any objections from shareholders regarding the mandatory acquisition, the statement said. Damac said it will instruct DFM to suspend trading of its shares, effective Tuesday. (Zawya) Dubai-listed Shuaa Capital's 2021 net profit falls 68% on impairments – Dubai-based Shuaa Capital’s full-year net profit for 2021 shrank 68%, as the company booked one-off charges of AED189mn ($51.45mn) tied to impairments. Total net profit for the year reached AED40mn, compared
- 6. Daily MarketReport Wednesday,16February 2022 qnbfs.com to AED125mn in 2020, the investment bank and asset manager said in a statement. “The result included one-off charges… mainly relating to valuation impairments following the decision to accelerate the restructuring of a legacy, illiquid investment portfolio,” the company said. EBITDA also fell from AED350mn in 2020 to AED233mn in 2021 and was pegged at AED422mn when adjusted for net one-off items. However, net profit before one-off impairments hit a record high of AED229mn. (Zawya) UAE investment firm Waha Capital's 4Q net profit drops 45% to $26mn – Waha Capital PJSC, an Abu Dhabi-listed investment management company, said its fourth quarter 2021 net profit fell 45% to AED94mn ($26mn), compared to a net profit of AED172mn in 2020. For the full year it reported a 69% jump in net profit to AED391mn, compared to a net profit of AED231mn in 2020, "driven by strong returns from its emerging markets credit and equity funds." Its public markets business recorded investment gains and fee income of AED902mn and a net profit of AED603mn for the year, Waha Capital said in a statement. (Zawya) Bahrain's Investcorp buys 64 US industrial properties for $640mn – Bahrain’s Investcorp has announced that it has acquired $640mn worth of US industrial real estate, increasing the size of its portfolio in the sector to $3.5bn. The acquisition encompasses 64 properties with a total area of 5.6mn sq.ft. The company said its US real estate activity during the last year has amounted to $4bn, $2.5bn of acquisitions and $1.5bn of dispositions. The latest investments take the total number of USA industrial buildings owned by the company to 425. Investcorp said the warehouses are 95% leased and located in Chicago, Dallas, New York, Atlanta, Houston, Philadelphia and St Louis. (Zawya) Bahrain's Oil & Gas Holding hires banks to refinance $1.6bn loan – Bahrain's Oil & Gas Holding Company has hired Gulf International Bank (GIB) and Mashreq to refinance an existing $1.6bn murabaha facility, GIB said on Tuesday. "The proposed transaction will have both Islamic and conventional tranches and will be sustainability linked," GIB told Reuters in response to a query. Oil & Gas Holding and Mashreq did not immediately respond to requests for comment. (Zawya)
- 7. Daily MarketReport Wednesday,16February 2022 qnbfs.com Rebased Performance Source: Bloomberg Daily Index Performance Source: Bloomberg Asset/Currency Performance Close ($) 1D% WTD% YTD% Gold/Ounce 1,853.61 (0.9) (0.3) 1.3 Silver/Ounce 23.36 (2.0) (0.9) 0.2 Crude Oil (Brent)/Barrel (FM Future) 93.28 (3.3) (1.2) 19.9 Crude Oil (WTI)/Barrel (FM Future) 92.07 (3.6) (1.1) 22.4 Natural Gas (Henry Hub)/MMBtu 4.31 6.4 9.9 17.8 LPG Propane (Arab Gulf)/Ton 123.00 (2.8) (2.8) 9.6 LPG Butane (Arab Gulf)/Ton 151.75 (5.5) (2.3) 9.0 Euro 1.14 0.5 0.1 (0.1) Yen 115.61 0.1 0.2 0.5 GBP 1.35 0.1 (0.2) 0.0 CHF 1.08 (0.1) 0.1 (1.4) AUD 0.72 0.4 0.2 (1.5) USD Index 95.99 (0.4) (0.1) 0.3 RUB 75.37 (1.8) (2.3) 0.9 BRL 0.19 1.1 1.8 8.0 Source: Bloomberg Global Indices Performance Close 1D%* WTD%* YTD%* MSCI World Index 3,054.26 1.4 0.5 (5.5) DJ Industrial 34,988.84 1.2 0.7 (3.7) S&P 500 4,471.07 1.6 1.2 (6.2) NASDAQ 100 14,139.76 2.5 2.5 (9.6) STOXX 600 467.56 1.9 (0.8) (4.4) DAX 15,412.71 2.4 (0.4) (2.6) FTSE 100 7,608.92 1.0 (1.2) 3.0 CAC 40 6,979.97 2.3 (0.8) (2.7) Nikkei 26,865.19 (0.8) (2.7) (7.1) MSCI EM 1,229.05 0.7 (0.9) (0.2) SHANGHAI SE Composite 3,446.09 0.8 (0.2) (5.1) HANG SENG 24,355.71 (0.8) (2.2) 4.0 BSE SENSEX 58,142.05 3.6 0.2 (1.1) Bovespa 114,828.20 1.1 1.2 17.4 RTS 1,498.04 5.0 1.9 (6.1) Source: Bloomberg (*$ adjusted returns) 60.0 80.0 100.0 120.0 140.0 160.0 180.0 Jan-18 Jan-19 Jan-20 Jan-21 Jan-22 QSE Index S&P Pan Arab S&P GCC 1.2% 0.2% 0.4% 0.7% (0.1%) 0.3% 1.0% (0.5%) 0.0% 0.5% 1.0% 1.5% Saudi Arabia Qatar Kuwait Bahrain Oman Abu Dhabi Dubai 170.0 156.1 149.2
- 8. Daily MarketReport Wednesday,16February 2022 qnbfs.com Contacts QNB Financial Services Co. W.L.L. Contact Center: (+974) 4476 6666 info@qnbfs.com.qa Doha, Qatar Saugata Sarkar, CFA, CAIA Head of Research saugata.sarkar@qnbfs.com.qa Shahan Keushgerian Senior Research Analyst shahan.keushgerian@qnbfs.com.qa Disclaimer and Copyright Notice: This publication has been prepared by QNB Financial Services Co. W.L.L. (“QNBFS”) a wholly-owned subsidiary of Qatar National Bank (Q.P.S.C.). QNBFS is regulated by the Qatar Financial Markets Authority and the Qatar Exchange. Qatar National Bank (Q.P.S.C.) is regulated by the Qatar Central Bank. This publication expresses the views and opinions of QNBFS at a given time only. It is not an offer, promotion or recommendation to buy or sell securities or other investments, nor is it intended to constitute legal, tax, accounting, or financial advice. QNBFS accepts no liability whatsoever for any direct or indirect losses arisingfrom use of this report. Any investment decision should depend on the individual circumstances of the investor and be based on specifically engaged investment advice. Wetherefore strongly advise potential investors to seek independent professional advice before making any investment decision. Although the information in this report has been obtained from sources that QNBFS believes to be reliable, we have not independently verified such information and it may not be accurate or complete. QNBFS does not make any representations or warrantiesastotheaccuracyandcompletenessofthe informationitmaycontain,anddeclinesanyliabilityinthatrespect.Forreports dealing with Technical Analysis, expressed opinions and/or recommendations may be different or contrary to the opinions/recommen- dationsofQNBFSFundamentalResearchasaresultofdepending solelyonthehistoricaltechnicaldata(priceandvolume).QNBFS reservestherighttoamendtheviewsandopinionsexpressedinthispublicationat anytime.Itmayalsoexpressviewpointsormake investment decisions that differ significantly from, or even contradict, the views and opinions included in this report. This report may not be reproduced in whole or in part without permission from QNBFS. COPYRIGHT: No part of this document may be reproduced without the explicit written permission of QNBFS.