QNBFS Daily Market Report May 12, 2019
•
0 likes•111 views

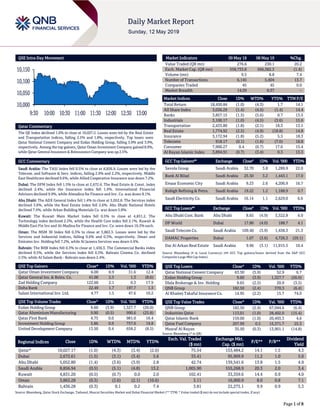
The QE Index declined 1.0% to close at 10,027.2. Losses were led by the Real Estate and Transportation indices, falling 2.5% and 1.8%, respectively.

Recommended
Recommended
More Related Content
What's hot
What's hot (20)
Similar to QNBFS Daily Market Report May 12, 2019
Similar to QNBFS Daily Market Report May 12, 2019 (20)
More from QNB Group
More from QNB Group (20)
Recently uploaded
Recently uploaded (20)
QNBFS Daily Market Report May 12, 2019
- 1. Page 1 of 8 QSE Intra-Day Movement Qatar Commentary The QE Index declined 1.0% to close at 10,027.2. Losses were led by the Real Estate and Transportation indices, falling 2.5% and 1.8%, respectively. Top losers were Qatar National Cement Company and Ezdan Holding Group, falling 5.9% and 3.9%, respectively. Among the top gainers, Qatar Oman Investment Company gained 8.9%, while Qatar General Insurance & Reinsurance Company was up 2.5%. GCC Commentary Saudi Arabia: The TASI Index fell 0.5% to close at 8,856.9. Losses were led by the Telecom. and Software & Serv. indices, falling 2.9% and 2.2%, respectively. Middle East Healthcare declined 9.6%, while Allied Cooperative Insurance was down 7.2%. Dubai: The DFM Index fell 1.5% to close at 2,672.6. The Real Estate & Const. index declined 2.4%, while the Insurance index fell 1.9%. International Financial Advisors declined 9.9%, while Almadina for Finance and Inv. Co. was down 8.1%. Abu Dhabi: The ADX General Index fell 1.4% to close at 5,052.8. The Services index declined 3.6%, while the Real Estate index fell 2.6%. Abu Dhabi National Hotels declined 7.4%, while Arkan Building Materials Co. was down 5.8%. Kuwait: The Kuwait Main Market Index fell 0.5% to close at 4,831.2. The Technology index declined 2.2%, while the Health Care index fell 2.1%. Kuwait & Middle East Fin Inv and Al-Madina for Finance and Inv. Co. were down 10.3% each. Oman: The MSM 30 Index fell 0.3% to close at 3,863.3. Losses were led by the Services and Industrial indices, falling 0.6% and 0.3%, respectively. Oman and Emirates Inv. Holding fell 7.2%, while Al Jazeera Services was down 4.4%. Bahrain: The BHB Index fell 0.3% to close at 1,436.3. The Commercial Banks index declined 0.5%, while the Services index fell 0.3%. Bahrain Cinema Co. declined 2.5%, while Al Salam Bank - Bahrain was down 2.4%. QSE Top Gainers Close* 1D% Vol. ‘000 YTD% Qatar Oman Investment Company 6.00 8.9 31.6 12.4 Qatar General Ins. & Reins. Co. 41.00 2.5 1.3 (8.6) Zad Holding Company 122.60 2.1 0.3 17.9 Doha Bank 22.49 1.7 197.7 1.3 Salam International Inv. Ltd. 4.77 1.5 47.6 10.2 QSE Top Volume Trades Close* 1D% Vol. ‘000 YTD% Ezdan Holding Group 9.60 (3.9) 1,327.7 (26.0) Qatar Aluminium Manufacturing 9.90 (0.5) 990.6 (25.8) Qatar First Bank 4.75 0.0 981.0 16.4 Investment Holding Group 5.86 0.9 757.6 19.8 United Development Company 13.50 0.4 658.2 (8.5) Market Indicators 09 May 19 08 May 19 %Chg. Value Traded (QR mn) 276.6 230.1 20.2 Exch. Market Cap. (QR mn) 558,733.8 566,382.3 (1.4) Volume (mn) 9.5 8.8 7.4 Number of Transactions 6,145 5,404 13.7 Companies Traded 45 45 0.0 Market Breadth 14:29 6:37 – Market Indices Close 1D% WTD% YTD% TTM P/E Total Return 18,450.84 (1.0) (4.3) 1.7 14.1 All Share Index 3,036.29 (1.4) (4.6) (1.4) 14.4 Banks 3,857.15 (1.5) (5.6) 0.7 13.5 Industrials 3,100.17 (1.0) (4.5) (3.6) 15.6 Transportation 2,435.80 (1.8) (2.1) 18.3 13.1 Real Estate 1,774.92 (2.5) (4.9) (18.8) 14.8 Insurance 3,172.94 (1.8) (5.2) 5.5 18.3 Telecoms 918.17 (0.1) (1.6) (7.0) 18.8 Consumer 7,900.27 0.4 (0.7) 17.0 15.4 Al Rayan Islamic Index 3,894.91 (0.7) (3.4) 0.3 13.3 GCC Top Gainers## Exchange Close# 1D% Vol. ‘000 YTD% Savola Group Saudi Arabia 32.70 3.8 1,289.9 22.0 Bank Al Bilad Saudi Arabia 25.50 3.2 1,443.1 17.0 Emaar Economic City Saudi Arabia 9.23 2.6 4,206.9 16.7 Rabigh Refining & Petro. Saudi Arabia 19.22 1.2 1,188.9 0.7 Saudi Electricity Co. Saudi Arabia 16.14 1.1 2,629.0 6.6 GCC Top Losers## Exchange Close# 1D% Vol. ‘000 YTD% Abu Dhabi Com. Bank Abu Dhabi 8.65 (4.9) 3,522.8 6.0 DP World Dubai 17.80 (4.0) 188.7 4.1 Saudi Telecom Co. Saudi Arabia 109.40 (3.9) 1,438.3 21.3 DAMAC Properties Dubai 1.07 (3.6) 4,726.3 (29.1) Dar Al Arkan Real Estate Saudi Arabia 9.96 (3.1) 11,915.5 10.4 Source: Bloomberg (# in Local Currency) (## GCC Top gainers/losers derived from the S&P GCC Composite Large Mid Cap Index) QSE Top Losers Close* 1D% Vol. ‘000 YTD% Qatar National Cement Company 63.50 (5.9) 52.9 6.7 Ezdan Holding Group 9.60 (3.9) 1,327.7 (26.0) Dlala Brokerage & Inv. Holding 9.65 (2.5) 20.9 (3.5) QNB Group 182.50 (2.4) 370.3 (6.4) Al Khaleej Takaful Insurance Co. 14.95 (2.2) 15.7 74.0 QSE Top Value Trades Close* 1D% Val. ‘000 YTD% QNB Group 182.50 (2.4) 67,944.6 (6.4) Industries Qatar 113.01 (1.0) 28,402.0 (15.4) Qatar Islamic Bank 159.00 (1.0) 20,493.3 4.6 Qatar Fuel Company 207.99 0.5 15,371.7 25.3 Masraf Al Rayan 35.50 (0.3) 13,901.1 (14.8) Source: Bloomberg (* in QR) Regional Indices Close 1D% WTD% MTD% YTD% Exch. Val. Traded ($ mn) Exchange Mkt. Cap. ($ mn) P/E** P/B** Dividend Yield Qatar* 10,027.17 (1.0) (4.3) (3.4) (2.6) 75.54 153,484.2 14.1 1.5 4.3 Dubai 2,672.61 (1.5) (3.1) (3.4) 5.6 33.41 95,909.9 11.2 1.0 5.0 Abu Dhabi 5,052.80 (1.4) (3.6) (3.9) 2.8 42.74 139,541.6 13.8 1.5 4.9 Saudi Arabia 8,856.94 (0.5) (5.1) (4.8) 13.2 1,005.90 555,268.9 20.3 2.0 3.4 Kuwait 4,831.20 (0.5) (0.7) 0.0 2.0 102.41 33,359.6 14.4 0.9 4.0 Oman 3,863.28 (0.3) (2.6) (2.1) (10.6) 3.11 16,900.9 8.0 0.8 7.1 Bahrain 1,436.28 (0.3) 0.1 0.2 7.4 3.81 22,275.1 9.9 0.9 5.3 Source: Bloomberg, Qatar Stock Exchange, Tadawul, Muscat Securities Market and Dubai Financial Market (** TTM; * Value traded ($ mn) do not include special trades, if any) 10,000 10,050 10,100 10,150 9:30 10:00 10:30 11:00 11:30 12:00 12:30 13:00
- 2. Page 2 of 8 Qatar Market Commentary The QE Index declined 1.0% to close at 10,027.2. The Real Estate and Transportation indices led the losses. The index fell on the back of selling pressure from GCC and non-Qatari shareholders despite buying support from Qatari shareholders. Qatar National Cement Company and Ezdan Holding Group were the top losers, falling 5.9% and 3.9%, respectively. Among the top gainers, Qatar Oman Investment Company gained 8.9%, while Qatar General Insurance & Reinsurance Company was up 2.5%. Volume of shares traded on Thursday rose by 7.4% to 9.5mn from 8.8mn on Wednesday. However, as compared to the 30-day moving average of 12.6mn, volume for the day was 24.7% lower. Ezdan Holding Group and Qatar Aluminium Manufacturing Company were the most active stocks, contributing 14.0% and 10.5% to the total volume, respectively. Source: Qatar Stock Exchange (* as a % of traded value) Earnings Releases and Global Economic Data Earnings Releases Company Market Currency Revenue (mn) 1Q2019 % Change YoY Operating Profit (mn) 1Q2019 % Change YoY Net Profit (mn) 1Q2019 % Change YoY Arabian Aramco Total Services Co. Saudi Arabia SR 10,253.6 32.5% 421.6 277.5% 52.5 N/A Dar Alarkan Real Estate Dev. Co. Saudi Arabia SR 823.7 -70.5% 117.2 -73.1% 25.5 -92.3% Alandalus Property Co. Saudi Arabia SR 40.0 -2.0% 29.1 0.8% 20.3 -1.2% Middle East Healthcare Co. Saudi Arabia SR 350.2 -11.4% 18.3 -78.6% 14.6 -83.3% Saudi Industrial Export Co. Saudi Arabia SR 18.2 124.7% -1.7 N/A -8.5 N/A Al-Babtain Power and Telecom. Co. Saudi Arabia SR 285.9 0.5% 6.3 -78.2% 19.8 2.1% Aseer Trading, Tourism and Manufacturing Co. Saudi Arabia SR 472.0 5.1% 31.0 -22.5% 5.0 -58.3% Al-Ahsa Development Co. Saudi Arabia SR 57.6 8.7% 0.3 N/A 2.4 -2.4% Saudi Arabian Amiantit Co. Saudi Arabia SR 233.0 16.5% -44.8 N/A 41.3 N/A Saudi Steel Pipe Co. Saudi Arabia SR 195.3 10.3% 2.6 -60.2% 0.3 N/A Basic Chemical Industries Co. Saudi Arabia SR 131.0 -14.8% 12.1 -55.3% 6.1 -61.8% National Gypsum Co. Saudi Arabia SR 11.3 -21.1% -3.3 N/A 3.5 N/A Red Sea International Co. Saudi Arabia SR 127.5 -13.7% -15.4 N/A -18.0 N/A Jazan Energy and Development Co. Saudi Arabia SR 16.7 67.0% -5.0 N/A -5.2 N/A Batic Investments and Logistics Co. Saudi Arabia SR 114.1 -10.5% 4.7 -25.1% 1.9 -50.9% Al Sorayai Trading and Industrial Group Saudi Arabia SR 65.0 -41.0% -27.7 N/A -35.2 N/A Saudi Real Estate Co. Saudi Arabia SR 72.4 -9.7% 1.4 -95.7% 18.5 -58.5% Dur Hospitality Co. Saudi Arabia SR 114.5 -0.5% 13.5 -31.3% 9.5 -47.7% Kingdom Holding Co. Saudi Arabia SR 929.1 81.1% 452.8 66.6% 171.4 19.8% Orient Insurance Dubai AED 1,308.7 9.2% – – 162.1 7.2% Ras Al Khaimah Company for White Cement & Construction Materials Abu Dhabi AED 65.2 22.7% 11.4 10.4% 9.6 14.9% Abu Dhabi National Energy Company Abu Dhabi AED 4,330.0 -0.2% – – 6.0 -94.5% National Industries Group Holding Kuwait KD 80.5 18.9% 41.5 31.1% 27.0 45.8% Source: Company data, DFM, ADX, MSM, TASI, BHB. Overall Activity Buy %* Sell %* Net (QR) Qatari Individuals 27.52% 19.31% 22,698,988.60 Qatari Institutions 40.35% 11.06% 80,994,121.95 Qatari 67.87% 30.37% 103,693,110.55 GCC Individuals 0.93% 0.80% 369,795.78 GCC Institutions 1.65% 3.09% (3,978,765.30) GCC 2.58% 3.89% (3,608,969.52) Non-Qatari Individuals 9.34% 7.11% 6,169,625.59 Non-Qatari Institutions 20.22% 58.64% (106,253,766.62) Non-Qatari 29.56% 65.75% (100,084,141.03)
- 3. Page 3 of 8 Global Economic Data Date Market Source Indicator Period Actual Consensus Previous 05/09 US Department of Labor Initial Jobless Claims 4-May 228k 220k 230k 05/09 US Department of Labor Continuing Claims 27-April 1,684k 1,670k 1,671k 05/09 US BLOOMBERG Bloomberg Consumer Comfort 5-May 59.8 – 60.4 05/10 US Bureau of Labor Statistics CPI MoM April 0.3% 0.4% 0.4% 05/10 US Bureau of Labor Statistics CPI YoY April 2.0% 2.1% 1.9% 05/10 UK UK Office for National Statist GDP QoQ 1Q 2019 0.5% 0.5% 0.2% 05/10 UK UK Office for National Statist GDP YoY 1Q 2019 1.8% 1.8% 1.4% 05/10 UK UK Office for National Statist Exports QoQ 1Q 2019 0.0% 1.7% 1.6% 05/10 UK UK Office for National Statist Imports QoQ 1Q 2019 6.8% 4.5% 2.1% 05/10 Germany Deutsche Bundesbank Exports SA MoM March 1.5% -0.4% -1.2% 05/10 Germany Deutsche Bundesbank Imports SA MoM March 0.4% 0.5% -1.6% 05/10 France INSEE Industrial Production MoM March -0.9% -0.5% 0.1% 05/10 France INSEE Industrial Production YoY March -0.9% -0.1% 0.5% 05/10 France INSEE Manufacturing Production MoM March -1.0% – 0.8% 05/10 France INSEE Manufacturing Production YoY March 0.5% – 2.6% 05/09 Japan Economic and Social Research Institute Consumer Confidence Index April 40.4 40.3 40.5 05/09 China National Bureau of Statistics CPI YoY April 2.5% 2.5% 2.3% 05/09 China National Bureau of Statistics PPI YoY April 0.9% 0.6% 0.4% 05/09 China The People's Bank of China Money Supply M2 YoY April 8.5% 8.5% 8.6% 05/09 China The People's Bank of China Money Supply M1 YoY April 2.9% 4.3% 4.6% 05/09 China The People's Bank of China Money Supply M0 YoY April 3.5% 3.0% 3.1% 05/10 India India Central Statistical Organization Industrial Production YoY March -0.1% 1.2% 0.1% Source: Bloomberg (s.a. = seasonally adjusted; n.s.a. = non-seasonally adjusted; w.d.a. = working day adjusted) Stock Split Dates for Listed Qatari Companies Source: QSE
- 4. Page 4 of 8 News Qatar MRDS announces the distribution of cash dividends – Mazaya Real Estate Development Company (MRDS) announced the distribution of cash dividends to shareholders in accordance to the decision of the General Assembly Meeting on April 16, 2019 at a rate of 5% i.e. QR0.5 per share as of May 9, 2019. (QSE) QISI to appoint Ali Ibrahim Al-Abdulghani as Group President – Qatar Islamic Insurance Company’s (QISI) board of director has decided to appoint Ali Ibrahim Al-Abdulghani as Group President, beside his current position as CEO of QISI. (QSE) S&P affirms Qatar ratings, maintains ‘Stable’ outlook – S&P Global Ratings has affirmed Qatar’s sovereign ratings with a ‘Stable’ outlook, primarily reflecting its view that the country will continue to ‘effectively mitigate’ the economic and financial fallout of the ongoing blockade. S&P said Qatar “will continue to pursue prudent macroeconomic policies” that support large recurrent fiscal and external surpluses over 2019- 2022. Investments related to the government's sizable infrastructure program will continue to support the country’s economic activity, outweighing negative sentiment related to the blockade imposed on Qatar by a quartet of Arab nations. Qatar's financial system, S&P noted, is “well capitalized and has displayed resilience” through the blockade, with additional “confidence-instilling” support from the authorities. In its ratings summary released yesterday, S&P cited that “increasing non-resident deposits demonstrated strengthening investor confidence in the financial sector." However, it said, the largely short-term external funding “worsens” Qatar's external liquidity position. S&P projects a current account surplus averaging 4.5% of Qatar’s GDP in 2019-2022, assuming lower hydrocarbon prices from 2021. (Gulf-Times.com) FocusEconomics: Qatar international reserves may scale up to $38.1bn in 2023 – Qatar’s international reserves may scale up to $38.1bn in 2023 from $33.8bn this year, FocusEconomics has stated in its latest country report. The international reserves will cover 9.6 months of imports in 2023 as against 11.7 months this year, the researcher stated. Qatar’s fiscal balance as a percentage of GDP is set to rise to 4.5% in 2023 from an estimated 0.5% this year, FocusEconomics stated. The country’s public debt will fall gradually until 2023, the researcher said and estimated it to be at 53% this year, 50.8% (2020), 48% (2021), 46.4% (2022) and 44.9% (2023). The current account balance (as a percentage of the country’s GDP) will be 7.1% in 2023 compared with 6.7% in 2019. Qatar’s merchandise trade balance, FocusEconomics stated, will be $56bn in 2023. This year, it will account for $49.4bn. Qatar’s gross domestic product is expected to reach $242bn by 2023, it stated. By the year-end, Qatar’s GDP may total $199bn. Qatar’s economic growth in terms of nominal GDP will reach 5% in 2023 from 3.6% by the year-end. The country’s inflation, the report noted, will be 2.1% in 2023 and 1% this year. Qatar’s unemployment rate (as a percentage of active population) will remain a meager 0.2% in 2023, unchanged from this year. (Gulf- Times.com) Exxon, Qatar Petroleum to start construction on Texas Golden Pass LNG export plant – Exxon Mobil Corporation and Qatar Petroleum told the US Federal Energy Regulatory Commission (FERC) on Thursday that they would start construction of the $10bn -plus Golden Pass liquefied natural gas (LNG) export terminal in Texas on May 13. Exxon and Qatar Petroleum made a final investment decision to build the project in February and expect the project to enter service in 2024. Golden Pass is designed to produce around 16mn tons per annum (MTPA) of LNG, equivalent to about 2.1bn cubic feet per day (bcfd) of natural gas. (Zawya) QIBK launches new Takaful cover for low-income workers – Qatar Islamic Bank (QIBK) announced the launch of an affordable Takaful product for low-income workers called ‘Family Sheild – WPS’, underwritten by Daman Islamic Insurance Company (Beema). This comes as part of the bank’s efforts in offering products and services tailored to the needs of Qatar’s entire population. This low cost Takaful product can also be purchased by companies who want to give additional protection to their employees and are available in QIBK industrial area branch located in Barwa Commercial Avenue. (Zawya) IIF: Real estate prices in Qatar see temporary upturns; 2022 FIFA World Cup to provide further impetus to growth – Real estate prices in Qatar have seen temporary upturns, but remain well below the pre-rift levels; even as the upcoming large global event of 2022 FIFA World Cup is likely to provide an additional impetus to growth, according to the Institute of International Finance (IIF), the US-based economic think-tank. In Qatar, prices have not declined uniformly and there have been periods of modest price increase, IIF stated in a recent report. However, the total percentage decline from the peak of the market to end 2018 is similar to the total declines in its neighbors, with an especially steep fall in the four quarters following the onset of the Gulf crisis, it added. Highlighting that the Gulf region is in a position to benefit from some favorable trends; it stated a sustained uptick in oil prices would raise government revenues and buttress non-oil economic activity, including in the real estate sector. In addition, with a growing population and a large proportion of young adults who do not yet have children, the average household size is shrinking, it stated. As a result, the same number of people would require more total units of housing, IIF stated, adding while demand at the upper end of the market remains subdued, there is increasing activity at lower price points, and developers seem to be slowing the pace of new projects in favor of marketing their existing inventory and focusing on catering to a broader audience. Governments across the Gulf are also engaging in stimulus initiatives to expand consumer financing, facilitate trading of real estate investment trusts and liberalize ownership regulations. “Looking ahead, the price decline is likely to persist. Nevertheless, there are some signs of market adjustment as well as positive country-specific factors, as the region looks to take lasting advantage of events that will put it in the global spotlight by implementing targeted reforms,” it stated. (Gulf- Times.com) Al-Baker: Qatar Airways to replace all Airbus A330s in next three years – Qatar Airways will replace all its Airbus A330s with Airbus A350s and Boeing 787 Dreamliners in the next three years, group CEO, HE Akbar Al-Baker has said. The
- 5. Page 5 of 8 national carrier has already phased out its Airbus A340, Al- Baker said. “The A340s have been replaced by Airbus A350s,” Al-Baker said. Last year, the airline became the world’s launch customer of the Airbus A350-1000. In 2014, the airline became the global launch customer of the Airbus A350-900, the world’s first airline to operate every family of Airbus’ modern airliner portfolio. In January 2015, Qatar Airways deployed its world- first, Airbus A350 XWB aircraft on the Frankfurt route and in 2016; it became the first airline to fly the A350 family of aircraft to three continents. “From 2024, our fleet will consist of Boeing 777s and 787s and Airbus A350s and A321s. At that time, there will not be any more Airbus A320s and A319s in our fleet,” the group CEO revealed. Al-Baker said Qatar Airways long-haul routes such as the Americas and Asia-Pacific region would be served by its Boeing 777s and Airbus A350s. (Gulf-Times.com) Qatar-Switzerland trade rises by 28% to $3.7bn – Trade volume between Qatar and Switzerland has increased by 28% to $3.7bn in 2018 from $2.9bn in 2017, Qatar Chamber’s (QC) First Vice- Chairman, Mohamed bin Ahmed bin Towar Al Kuwari has said. Al Kuwari was speaking at a meeting with a Swiss trade team which was headed by Maya Maria Marberger. The meeting reviewed ways of enhancing trade relations and partnership between businessmen of both countries in furniture, jewelry, IT, financial and banking services and automobiles. Addressing the meeting, Al Kuwari also said, “The State of Qatar and Switzerland have enjoyed good bilateral relations for more than 40 years. Their economic and trade ties have seen remarkable development within the past few years. Their combined value of trade exchange hit $3.7bn last year, registering an increase of 28% compared to 2017 which reached $2.9bn. Swiss exports to Qatar included premium watches and jewellery.” (Peninsula Qatar) Indian exports to Qatar up by 13% in 2018-19 – Minister of Commerce and Industry HE Ali bin Ahmed Al Kuwari and the Ambassador of India to the State of Qatar, P. Kumaran, inaugurated the India Pavilion at the 16th Edition of Project Qatar Exhibition held at Doha Exhibition & Convention Center (DECC) on April 29. Later, the Indian Ambassador took a tour of the Indian pavilion and was briefed by the exhibitors about their world-class products displayed at the Exhibition. The Indian Pavilion comprised of 33 companies and was led by Federation of Indian Export Organizations (FIEO), an apex trade promotion body set up by the Ministry of Commerce and Industry, the Government of India, to promote trade, commerce and investments between India and other countries. India’s participation in the current edition of Project Qatar has doubled in comparison to its participation in the previous edition, which is a testament to the efforts made by the Indian exporters and the Embassy. (Peninsula Qatar) HIA named ‘best airport for passenger experience’ – Hamad International Airport (HIA) has been named the ‘Best Airport for Passenger Experience’ for the second consecutive year in a study by AirHelp, the world’s leading air passenger rights specialist. Qatar Airways, the national carrier has also been ranked as the number one airline for the second consecutive year. The study ranked 72 airlines and 132 airports on punctuality, quality of service, dining and shopping experiences. It also included an extensive survey among thousands of people around the world to gather information on their customer service, queues, cleanliness, dining and shopping experiences at their local airports. (Qatar Tribune) International China still 'cautiously optimistic' on US trade talks despite new tariffs – China and the US have agreed to hold more trade talks in Beijing, Vice Premier Liu He said as US President Donald Trump ordered his trade chief to begin the process of imposing tariffs on all remaining imports from China. Liu voiced a measured optimism on reaching a deal, but said there were “issues of principle” on which China would not back down. “Negotiations have not broken down,” Liu, China’s chief negotiator in the talks, said in Washington, according to state television. “Quite the opposite, I think small setbacks are normal and inevitable during the negotiations of both countries. Looking forward, we are still cautiously optimistic,” Liu said. But Liu’s optimism was tempered by US Treasury Secretary Steven Mnuchin, who told CNBC on Friday that there were no further talks with China planned “as of now.” And on Saturday, Trump tweeted, “Such an easy way to avoid Tariffs? Make or produce your goods and products in the good old USA. It’s very simple!”. The US escalated a tariff war with China on Friday by hiking levies on $200bn worth of Chinese goods in the midst of last-ditch talks to rescue a trade deal. Trump had delayed the tariffs as negotiations between Washington and Beijing were progressing. On Friday, Trump issued orders for the tariff increase, saying China “broke the deal” by reneging on earlier commitments made during months of negotiations. China strongly opposes the latest US tariff hike, and as a nation, has to respond to that, Liu told a small group of Chinese reporters. “Right now, both sides have reached mutual understanding in many things, but frankly speaking, there are also differences. We think these differences are significant issues of principle,” Liu said. “We absolutely cannot make concessions on such issues of principle.” He added that talks would continue in Beijing, but gave no details. But underscoring a lack of progress in the talks, Trump ordered a further escalation of tariffs. Trump’s move would subject about $300bn worth of Chinese imports to punitive tariffs, US Trade Representative Robert Lighthizer said. Lighthizer said a final decision has not been made on the new duties, which would come on top of an early Friday tariff rate increase, to 25% from 10%, on $200bn worth of Chinese imports. (Reuters) Fed's Williams says US economy strong despite trade tensions – The US economy is strong despite trade tensions, and data showing tame inflation pressure are no sign that policymakers are falling short of their goals, a top Federal Reserve policymaker said. We have a strong economy in a good place,” with no sign of inflation pressures, Federal Reserve Bank of New York President John Williams said at a local business event in New York City’s Bronx borough. Interest rates, he said, are well positioned “to keep this going, to keep the economy on a strong trajectory.” The Fed has kept short-term interest rates on hold this year in a 2.25-2.50% range after concerns over US- China trade talks and global growth shook markets late last year. Williams, who is Vice-Chairman and a permanent voting member of the Fed’s policy-setting committee, said the current policies make sense for now. First-quarter US economic data
- 6. Page 6 of 8 came in stronger than forecasters initially expected, with initial readings showing growth at a 3.2% annual level, but difficulty bringing US-China negotiations to a close threaten that trend. (Reuters) Pre-Brexit rush by factories boosts UK economy in early 2019 – Britain’s economy got a sharp one-off boost in the first three months of 2019, official figures showed, as manufacturers rushed to deliver orders before a Brexit that never came. Gross domestic product grew at a quarterly rate of 0.5% in the first quarter of 2019 after a sluggish 0.2% in late 2018, in line with expectations from the Bank of England as well as the consensus forecast in a Reuters poll of economists. YoY GDP growth picked up to an 18-month high of 1.8% in early 2019, up from 1.4% in the last three months of 2018, Britain’s Office for National Statistics stated. Sterling was little changed by the figures, which showed household spending continued to fuel the economy as businesses grappled with Brexit uncertainty. (Reuters) Reuters poll: UK, EU to agree free-trade deal, October 31 Brexit date in doubt – Britain will eventually leave the European Union (EU) and agree a free-trade deal with the bloc, according to the vast majority of economists polled by Reuters who were, however, split on whether the two sides would divorce on October 31. Prime Minister Theresa May failed to get her Withdrawal Agreement ratified by the British parliament on three attempts so the EU allowed a Brexit delay until the end of October, giving May time to try to convince lawmakers to reach agreement. When asked if the latest deadline - delayed from March 29 - would be extended, 17 of 33 economists who answered an extra question in the May 3-10 Reuters poll stated it would not. It’s nearly three years since the June 2016 referendum when Britons shocked much of the world and voted to leave the EU, but it is still unclear how, when, or even if it will ever quit the club it joined in 1973. But the median forecast in the latest survey gave the chance of a disorderly Brexit - where no deal is agreed and an outcome Reuters polls have repeatedly said would be harmful to both sides - at 15%, as it was in March and April. Only one of 50 respondents gave a probability above 50%. Still, as they have in all Reuters polls since late 2016 most economists said the two sides would settle on a free-trade deal. The second most likely outcome was again Britain as a member of the European Economic Area, paying into the EU budget to maintain access to the EU’s single market. (Reuters) EU concerned over new Greek tax and spending plan – Eurozone officials showed concern after Athens announced plans to cut taxes and raise welfare spending which could breach commitments made by Greece to its creditors, three sources involved in monitoring the country’s fiscal situation said. After exiting its third international bailout in August last year, Greece has agreed with Eurozone lenders to abide by strict fiscal targets until 2022 in exchange for further financial support. But ahead of EU elections on May 23-26, and after Greece outperformed its fiscal targets, Prime Minister Alexis Tsipras on Tuesday announced tax cuts and pledged to reinstate a benefit for low income pensioners among other “relief measures”. The plans “may not be in line with commitments,” one EU source said, adding that EU officials had raised concerns during a regular mission to Athens which ended on Wednesday. Greece has committed to delivering primary budget surpluses, excluding debt servicing, of 3.5% of annual economic output up to 2022. Under the new plans, the primary surplus target would be cut to 2.5% from next year, although Tsipras pledged that 5.5bn Euros will be set aside to guarantee that Greece will meet the higher fiscal target previously agreed with lenders. (Reuters) Germany lowers tax revenues, budget shortfall of 10.5bn Euros – Germany has slashed its estimate of tax intake because of weaker growth, the finance ministry said, leaving the government with limited room for additional fiscal measures to counter a slowdown in Europe’s largest economy. Revenue estimates for 2019 were cut to 793.7bn Euros ($892.28bn) from 804.6bn Euros. From 2019 through to 2023, estimates for all state levels were for an intake 124.3bn Euros less than was forecast in November, a tax estimate document published by the finance ministry showed. Over the period 2019-2023, the federal government will have some 70.6bn Euros less than the previous projection called for, the figures showed. The weaker growth outlook has partly been taken into account by Finance Minister Olaf Scholz in the draft budget plan he presented in March. It means that the budget faces a shortfall of 10.5bn Euros until 2023, the finance ministry said. (Reuters) Reuters poll: Japan's economy likely shrank in first quarter on weak domestic demand, exports – Japan’s economy likely contracted slightly in the first quarter as corporate and consumer spending weakened, a Reuters poll showed. Exports also deteriorated amid trade disputes and weaker global demand, hurting the trade-reliant economy. GDP is expected to have fallen 0.2% in January-March on an annualized basis, the poll of 18 economists showed, after it expanded 1.9% in the fourth quarter last year. That would translate into a flat reading on a quarter-on-quarter basis, after the economy grew 0.5% in the October-December quarter, the poll showed. Capital spending likely fell 1.7% in the first quarter after 2.7% growth the previous quarter, the poll found. Private consumption, which accounts for about 60% of GDP, was seen down 0.1% for the quarter, after rising 0.4% in October-December. External demand - or exports minus imports - was still expected to add 0.3 percentage points to growth in the first quarter, the poll found, after it subtracted 0.3 percentage points from GDP growth in the previous quarter. Analysts say a drop in imports due to weak domestic demand was larger than a decline in exports, which led Japan’s net exports to improve for January- March. (Reuters) Regional Middle East carriers’ passenger demand down 3% in March, says IATA – Middle East carriers’ passenger demand fell 3% in March, marking a second consecutive month of declining traffic, IATA’s latest figures revealed. “This reflects the broader structural changes in the industry, which have been taking place in the region,” IATA stated. Region’s capacity increased 2.3%, and load factor plunged four percentage points to 73.8%. Meanwhile, global passenger traffic results for March released by the International Air Transport Association showed that demand (measured in revenue passenger kilometers (RPKs)
- 7. Page 7 of 8 rose 3.1%, compared to the same month a year ago, which was the slowest pace for any month in nine years. (Gulf-Times.com) OPEC in the dark on oil supply as Russia, Iran cut exports – OPEC is in the dark on the oil supply outlook for the second half of this year, with Iranian and Russian outages looking increasingly significant but Saudi Arabia reluctant to pump more due to fears of a price crash, according to sources. An oil contamination forced Russia to halt flows along the Druzhba pipeline, a key conduit for crude into Eastern Europe and Germany, in April. The suspension left refiners scrambling to find supplies and its duration is unclear. Iran’s oil exports are likely to drop further in May as the US tightens the screw on Tehran’s main source of income. Shipments from Venezuela, also under US sanctions, could fall more in coming weeks. (Reuters) Japan refiners tap more oil from Middle East to replace Iran supply – Japanese refiners are tapping more oil from the Middle East after the US ended all waivers from sanctions on Iran starting from this month. Fuji Oil Co. bought 1.5mn barrels of Oman crude, Banoco Arab Medium from Bahrain, and Upper Zakum, an Abu Dhabi grade, to load in June in a spot tender held last month, according to sources. Alternative imports are not expected to come from the US - now the world’s largest producer - as the US crude is lighter than Iranian crude. Moreover, Libya plans to increase oil output from existing fields to 1.4mn barrels per day (bpd) by the end of 2019 and 2.1mn bpd by 2023, state-run National Oil Corp. stated. (Reuters) Saudi council approves 'Green-Card Style' residency program – Saudi Arabia’s Shura Council, advisory body appointed by the government, approved plans to attract foreign entrepreneurs and investors with a new residency program, Arab News reported. ‘Privileged residency’ plan to offer benefits to highly skilled expatriates and owners of capital funds. Residents would not require a Saudi sponsor or employer, unlike existing residency program. In 2016, the Crown Prince Mohammed bin Salman said authorities were weighing measures that include a program similar to the US Green Card system for expatriates. (Bloomberg) Saudi sovereign fund invests indirectly in Arabian Centers’ IPO – Saudi Arabia’s Public Investment Fund (PIF), the Kingdom’s sovereign wealth fund, has indirectly invested in the $747mn Initial Public Offering (IPO) of mall operator Arabian Centers, according to sources. PIF has made the investment through institutional funds and will not have a direct stake in Arabian Centers, sources said, although the investment represents strong government support for the IPO. The IPO of Arabian Centers, majority-owned by Fawaz Alhokair Group, is the first in the Kingdom under Rule 144a, which allows the sale of securities primarily to qualified institutional buyers in the US. (Reuters) Savola Group plans Saudi Riyal Sukuk issue – Savola Group, Saudi Arabia’s largest food products company, stated it plans to issue Sukuk denominated in Saudi Riyals, as part of a Sukuk program of up to SR5.3bn. The company stated it will issue the Sukuk, or Islamic bonds, to back the company’s financial and strategic needs. Savola Group and other consumer goods companies in Saudi Arabia are suffering from the effects of subsidy cuts, the introduction of VAT and an exodus of expatriates which have all put pressure on consumer spending. The planned issue comes after Saudi Arabia last month reduced fees for new debt offerings and annual registration charges for issuers, as part of efforts to spur activity in the local debt market. (Reuters) Etihad Airways submits bid for India's Jet Airways, eyes minority stake – Middle Eastern carrier Etihad Airways has submitted a bid for a stake in India’s Jet Airways, the unit of State Bank of India (SBI) overseeing the sale of the stricken airline stated. SBI had invited binding bids for a stake in the airline, which is saddled with roughly $1.2bn in bank debt. Etihad Airways, which already holds a minority stake in Jet Airways, is interested in re-investing in the airline, subject to certain conditions, a spokesman for the Middle Eastern carrier said. (Reuters) Dubai’s April whole economy PMI rises MoM to 57.9 – Emirates NBD and IHS Markit released whole economy Purchasing Managers’ Index (PMI) for Dubai in April 2019. The index rose to 57.9 from 57.6 in March 2019 and 53.9 in April 2018. The reading is highest since February 2015. New work in April rose to 66.6 from 63.8 in March 2019, which is also the highest reading since January 2015. Business expectations in April rose from March and showed the highest reading since series began. (Bloomberg) DP World acquires Canadian terminal Fraser Surrey Docks – DP World stated it has agreed to buy Canadian marine terminal Fraser Surrey Docks from a Macquarie Group fund. The purchase consideration is below 2.5% of DP World’s net asset value as of December 31, 2018, the port operator stated, which Reuters calculated to be under $300mn. The marine terminal, is being acquired through Canadian subsidiary DP World Canada Investment Inc, which is 45% owned by Caisse de dépot et placement du Québec (CDPQ). The deal is expected to close in the first half of 2019, DP World stated. The terminal is being acquired from Macquarie Infrastructure Partners a fund managed by the Macquarie Infrastructure and Real Assets (MIRA) division of Macquarie Group. (Reuters)
- 8. Contacts Saugata Sarkar, CFA, CAIA Shahan Keushgerian Zaid al-Nafoosi, CMT, CFTe Head of Research Senior Research Analyst Senior Research Analyst Tel: (+974) 4476 6534 Tel: (+974) 4476 6509 Tel: (+974) 4476 6535 saugata.sarkar@qnbfs.com.qa shahan.keushgerian@qnbfs.com.qa zaid.alnafoosi@qnbfs.com.qa Mehmet Aksoy, PhD QNB Financial Services Co. W.L.L. Senior Research Analyst Contact Center: (+974) 4476 6666 Tel: (+974) 4476 6589 PO Box 24025 mehmet.aksoy@qnbfs.com.qa Doha, Qatar Disclaimer and Copyright Notice: This publication has been prepared by QNB Financial Services Co. W.L.L. (“QNB FS”) a wholly-owned subsidiary of Qatar National Bank (Q.P.S.C.). QNB FS is regulated by the Qatar Financial Markets Authority and the Qatar Exchange. Qatar National Bank (Q.P.S.C.) is regulated by the Qatar Central Bank. This publication expresses the views and opinions of QNB FS at a given time only. It is not an offer, promotion or recommendation to buy or sell securities or other investments, nor is it intended to constitute legal, tax, accounting, or financial advice. QNB FS accepts no liability whatsoever for any direct or indirect losses arising from use of this report. Any investment decision should depend on the individual circumstances of the investor and be based on specifically engaged investment advice. We therefore strongly advise potential investors to seek independent professional advice before making any investment decision. Although the information in this report has been obtained from sources that QNB FS believes to be reliable, we have not independently verified such information and it may not be accurate or complete. QNB FS does not make any representations or warranties as to the accuracy and completeness of the information it may contain, and declines any liability in that respect. For reports dealing with Technical Analysis, expressed opinions and/or recommendations may be different or contrary to the opinions/recommendations of QNB FS Fundamental Research as a result of depending solely on the historical technical data (price and volume). QNB FS reserves the right to amend the views and opinions expressed in this publication at any time. It may also express viewpoints or make investment decisions that differ significantly from, or even contradict, the views and opinions included in this report. This report may not be reproduced in whole or in part without permission from QNB FS. COPYRIGHT: No part of this document may be reproduced without the explicit written permission of QNB FS. Page 8 of 8 Rebased Performance Daily Index Performance Source: Bloomberg Source: Bloomberg Source: Bloomberg Source: Bloomberg (*$ adjusted returns) 60.0 80.0 100.0 120.0 Apr-15 Apr-16 Apr-17 Apr-18 Apr-19 QSEIndex S&PPanArab S&PGCC (0.5%) (1.0%) (0.5%) (0.3%) (0.3%) (1.4%) (1.5%)(2.0%) (1.0%) 0.0% 1.0% SaudiArabia Qatar Kuwait Bahrain Oman AbuDhabi Dubai Asset/Currency Performance Close ($) 1D% WTD% YTD% Global Indices Performance Close 1D%* WTD%* YTD%* Gold/Ounce 1,286.05 0.2 0.5 0.3 MSCI World Index 2,126.32 0.3 (2.4) 12.9 Silver/Ounce 14.78 0.1 (1.1) (4.6) DJ Industrial 25,942.37 0.4 (2.1) 11.2 Crude Oil (Brent)/Barrel (FM Future) 70.62 0.3 (0.3) 31.3 S&P 500 2,881.40 0.4 (2.2) 14.9 Crude Oil (WTI)/Barrel (FM Future) 61.66 (0.1) (0.5) 35.8 NASDAQ 100 7,916.94 0.1 (3.0) 19.3 Natural Gas (Henry Hub)/MMBtu 2.54 (1.2) (2.7) (20.3) STOXX 600 377.14 0.5 (3.0) 9.6 LPG Propane (Arab Gulf)/Ton 62.25 2.0 4.6 (2.0) DAX 12,059.83 0.9 (2.5) 12.2 LPG Butane (Arab Gulf)/Ton 58.25 2.4 1.5 (16.8) FTSE 100 7,203.29 (0.0) (3.3) 9.4 Euro 1.12 0.2 0.3 (2.0) CAC 40 5,327.44 0.5 (3.6) 10.5 Yen 109.95 0.2 (1.0) 0.2 Nikkei 21,344.92 (0.2) (2.4) 7.4 GBP 1.30 (0.1) (1.3) 1.9 MSCI EM 1,033.44 0.5 (4.6) 7.0 CHF 0.99 0.3 0.5 (3.0) SHANGHAI SE Composite 2,939.21 3.1 (5.8) 18.8 AUD 0.70 0.2 (0.2) (0.7) HANG SENG 28,550.24 0.8 (5.1) 10.2 USD Index 97.33 (0.0) (0.2) 1.2 BSE SENSEX 37,462.99 (0.2) (5.0) 3.4 RUB 65.10 0.1 0.0 (6.6) Bovespa 94,257.56 (0.9) (2.3) 4.9 BRL 0.25 (0.3) (0.5) (1.9) RTS 1,213.79 (1.6) (2.8) 13.6 107.8 100.2 87.0