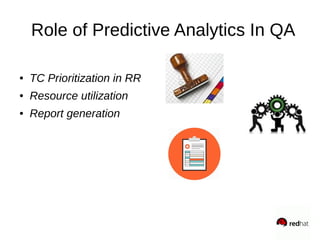
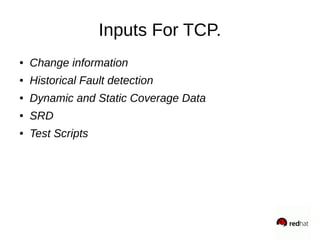
Analytics in Quality Assurance
Rohit Vyas
Sr. QE
Certification Team, Pune(IN)
About Me
● QA Engineer
● Sr. QA Lead
● Sr. QE
– 366 Days on 25th Jan -2017
Leveraging Analytics in QA
Predictive Analysis
Predictive Analysis
Current QA Challenges
● What all testcases need to be executed to minimize
the defect leakage rate < 10% and maximize the
coverage > 90%?
● Identify the tests to be included in test suite which can
be executed with resources <=5 and time_duration
<10 days with severity defects= 0% ? (Min(Tc))
● Number of resources required to execute test suite
with min(Tc) for ModuleX with min(defect leakage
rate) within min(testing time frame)?
Role of Predictive Analytics In QA
● TC Prioritization in RR
● Resource utilization
● Report generation
Why TCP?
TCP ?
● Focus on ranking all existing TC without eliminating.
Detect Fault Soon.
● Executes TC's in given order until the testing budget is
exhausted.
TCP Effect
0 2 4 6 8 10 12 14 16 18
0
10
20
30
40
50
60
Bugs
0 2 4 6 8 10 12 14 16 18
0
10
20
30
40
50
60
70
Bugs
How TCP ?
Techniques for TCP
● Text diversity-based Prioritization
AllDist(Ti,PS,d)= Min{d(Ti,Tj)} | Tj PS
● Topic diversity-based
● History Based clustering
● C 1 = { tc x — tc x 2 FT(n) }
● C 2 = { tc x — tc x 62 C1 AND tc x 2 FT(n-1) }
● C 3 = { tc x — tc x 62 [(C 1 ,C 2 ) AND tc x 2 FT(n-2)}
Inputs For TCP.
● Change information
● Historical Fault detection
● Dynamic and Static Coverage Data
● SRD
● Test Scripts
Data Sources
System Under Test
Type Release Total Test New Test %New Test Median Old
Test
TR 3.0 580 398 68% 1
RR 5.5 1055 39 4% 4
Type Release Release
Date
No. Of test No. of Faults Failure Rate
RR 3.0 1/12/2016 580 127 21.90%
RR 4.0 25/12/2016 1055 6 0.57%
K Mean Clustering
● Assume Euclidean space/distance
● Start picking k , the number of clusters
● Initialize clusters by picking one point per clusters and
find the minimum distance
● Repeat for all the clusters
Resource Allocation
● Right Tester/QA ?
● QA score
● How well QA handles Deadline Meets
● Resource allocation predictions based on the Analysis
● Predict the success rate of project with n number of
resources having 5+ years of domain expertise QA
within min(time_frame)
Resource Allocation Problems
Understand your Resource
● Identifying the Performance [Demographic, Gender
Biased, Skills]
● Resource Allocation in RR & TR
● Resources Churn Detection
Data Sets
Proje
ct
ID Age Gend
er
Marital
Status
Issues
Reporte
d
Priori
ty of
Bug
Relea
se
Time
Locat
ion
Project
Complexit
y
aaa a123 23 M S 12 xx xx xx xx
Project Complexity Age Gender Domain Expertise Interest Level
xx xx xx xx xx xx xx
Data Source
Reports
Metrics That Matters
● Analytical Reports
– Add values to current test tools generated reports
on better explaining the data collected and will be
useful for future prediction and forecasting.
Metrics That Matters
● Measuring the Doneness
● Resource Allocation
● Measuring Performance and biases
● Beyond the Check Marks
Tools
● R
● Statpro
● Excel or LibreOffice for Regression
References
● Test case prioritization
http://sealab.cs.umanitoba.ca/wp-content/uploads/2
016/07/Published.pdf
qe_camp_17
qe_camp_17

qe_camp_17

  • 1.
    Analytics in QualityAssurance Rohit Vyas Sr. QE Certification Team, Pune(IN)
  • 2.
    About Me ● QAEngineer ● Sr. QA Lead ● Sr. QE – 366 Days on 25th Jan -2017
  • 3.
  • 4.
  • 6.
  • 7.
    Current QA Challenges ●What all testcases need to be executed to minimize the defect leakage rate < 10% and maximize the coverage > 90%? ● Identify the tests to be included in test suite which can be executed with resources <=5 and time_duration <10 days with severity defects= 0% ? (Min(Tc)) ● Number of resources required to execute test suite with min(Tc) for ModuleX with min(defect leakage rate) within min(testing time frame)?
  • 8.
    Role of PredictiveAnalytics In QA ● TC Prioritization in RR ● Resource utilization ● Report generation
  • 9.
  • 10.
    TCP ? ● Focuson ranking all existing TC without eliminating. Detect Fault Soon. ● Executes TC's in given order until the testing budget is exhausted.
  • 11.
    TCP Effect 0 24 6 8 10 12 14 16 18 0 10 20 30 40 50 60 Bugs 0 2 4 6 8 10 12 14 16 18 0 10 20 30 40 50 60 70 Bugs
  • 12.
    How TCP ? Techniquesfor TCP ● Text diversity-based Prioritization AllDist(Ti,PS,d)= Min{d(Ti,Tj)} | Tj PS ● Topic diversity-based ● History Based clustering ● C 1 = { tc x — tc x 2 FT(n) } ● C 2 = { tc x — tc x 62 C1 AND tc x 2 FT(n-1) } ● C 3 = { tc x — tc x 62 [(C 1 ,C 2 ) AND tc x 2 FT(n-2)}
  • 13.
    Inputs For TCP. ●Change information ● Historical Fault detection ● Dynamic and Static Coverage Data ● SRD ● Test Scripts
  • 14.
  • 15.
    System Under Test TypeRelease Total Test New Test %New Test Median Old Test TR 3.0 580 398 68% 1 RR 5.5 1055 39 4% 4 Type Release Release Date No. Of test No. of Faults Failure Rate RR 3.0 1/12/2016 580 127 21.90% RR 4.0 25/12/2016 1055 6 0.57%
  • 16.
    K Mean Clustering ●Assume Euclidean space/distance ● Start picking k , the number of clusters ● Initialize clusters by picking one point per clusters and find the minimum distance ● Repeat for all the clusters
  • 17.
    Resource Allocation ● RightTester/QA ? ● QA score ● How well QA handles Deadline Meets
  • 18.
    ● Resource allocationpredictions based on the Analysis ● Predict the success rate of project with n number of resources having 5+ years of domain expertise QA within min(time_frame) Resource Allocation Problems
  • 19.
    Understand your Resource ●Identifying the Performance [Demographic, Gender Biased, Skills] ● Resource Allocation in RR & TR ● Resources Churn Detection
  • 20.
    Data Sets Proje ct ID AgeGend er Marital Status Issues Reporte d Priori ty of Bug Relea se Time Locat ion Project Complexit y aaa a123 23 M S 12 xx xx xx xx Project Complexity Age Gender Domain Expertise Interest Level xx xx xx xx xx xx xx
  • 21.
  • 22.
    Reports Metrics That Matters ●Analytical Reports – Add values to current test tools generated reports on better explaining the data collected and will be useful for future prediction and forecasting.
  • 23.
    Metrics That Matters ●Measuring the Doneness ● Resource Allocation ● Measuring Performance and biases ● Beyond the Check Marks
  • 24.
    Tools ● R ● Statpro ●Excel or LibreOffice for Regression
  • 25.
    References ● Test caseprioritization http://sealab.cs.umanitoba.ca/wp-content/uploads/2 016/07/Published.pdf