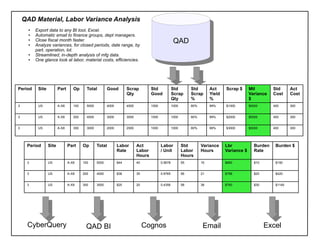
QAD Material, Labor Variance Analysis
      ●   Export data to any BI tool, Excel.
      ●   Automatic email to finance groups, dept managers.
      ●

      ●
          Close fiscal month faster.
          Analyze variances, for closed periods, date range, by
                                                                                                      QAD
                                                                                                       QAD
          part, operation, lot.
      ●   Streamlined, in-depth analysis of mfg data.
      ●   One glance look at labor, material costs, efficiencies.


Period     Site          Part      Op      Total         Good         Scrap          Std             Std         Std        Act     Scrap $      Mtl        Std      Act
                                                                      Qty            Good            Scrap       Scrap      Yield                Variance   Cost     Cost
                                                                                                     Qty         %          %                    $
3          US            A-X8      100     5000          4000         4000           1000            1000        80%        99%     $1000        $5000      400      300


3          US            A-X8      200     4000          3000         3000           1000            1000        80%        99%     $2000        $5000      400      300


3          US            A-X8      300     3000          2000         2000           1000            1000        80%        99%     $3000        $5000      400      300


     Period       Site          Part     Op       Total         Labor        Act            Labor           Std        Variance     Lbr            Burden    Burden $
                                                                Rate         Labor          / Unit          Labor      Hours        Variance $     Rate
                                                                             Hours                          Hours
     3            US            A-X8     100      5000          $44          40             0.5678          55         15           $660           $10       $150


     3            US            A-X8     200      4000          $38          35             0.8765          56         21           $798           $20       $420


     3            US            A-X8     300      3000          $25          20             0.4356          58         38           $760           $30       $1140


     CyberQuery                           QAD BI                                  Cognos                                Email                            Excel

Qad variance analysis

  • 1.
    QAD Material, LaborVariance Analysis ● Export data to any BI tool, Excel. ● Automatic email to finance groups, dept managers. ● ● Close fiscal month faster. Analyze variances, for closed periods, date range, by QAD QAD part, operation, lot. ● Streamlined, in-depth analysis of mfg data. ● One glance look at labor, material costs, efficiencies. Period Site Part Op Total Good Scrap Std Std Std Act Scrap $ Mtl Std Act Qty Good Scrap Scrap Yield Variance Cost Cost Qty % % $ 3 US A-X8 100 5000 4000 4000 1000 1000 80% 99% $1000 $5000 400 300 3 US A-X8 200 4000 3000 3000 1000 1000 80% 99% $2000 $5000 400 300 3 US A-X8 300 3000 2000 2000 1000 1000 80% 99% $3000 $5000 400 300 Period Site Part Op Total Labor Act Labor Std Variance Lbr Burden Burden $ Rate Labor / Unit Labor Hours Variance $ Rate Hours Hours 3 US A-X8 100 5000 $44 40 0.5678 55 15 $660 $10 $150 3 US A-X8 200 4000 $38 35 0.8765 56 21 $798 $20 $420 3 US A-X8 300 3000 $25 20 0.4356 58 38 $760 $30 $1140 CyberQuery QAD BI Cognos Email Excel