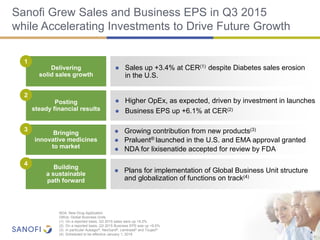
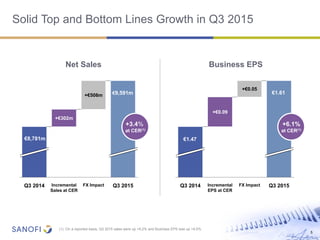
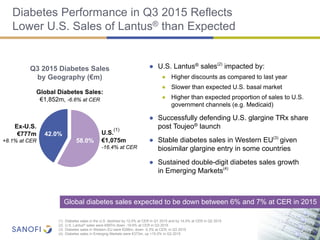
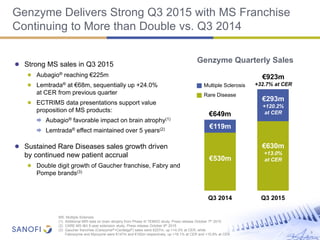
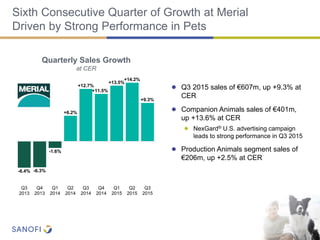
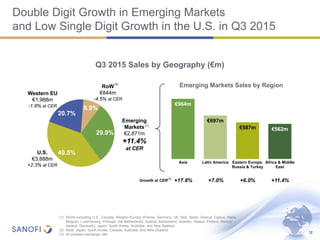
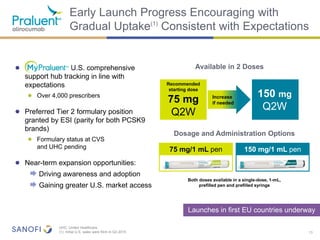
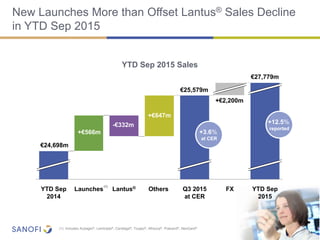
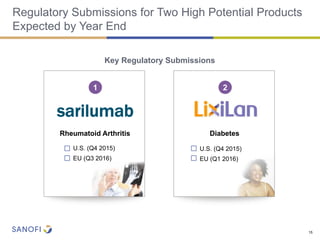
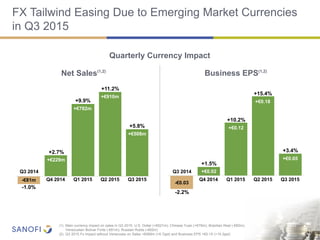
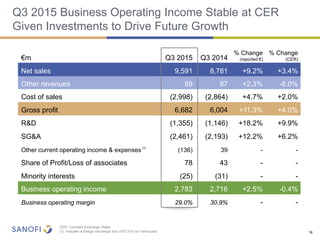
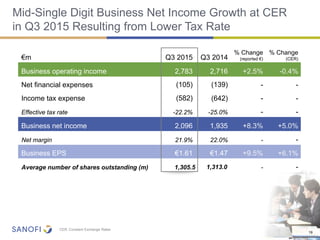
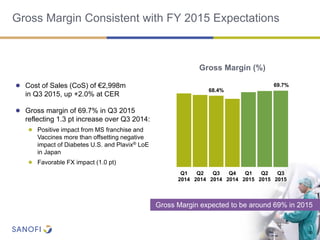
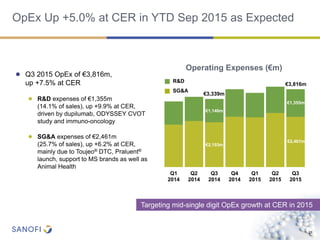
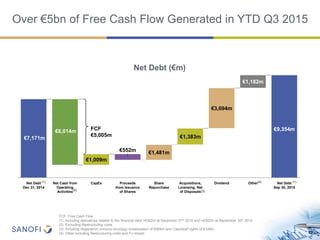
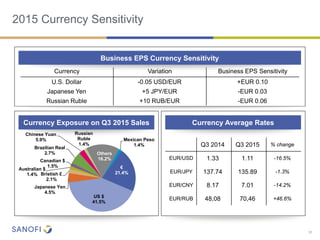
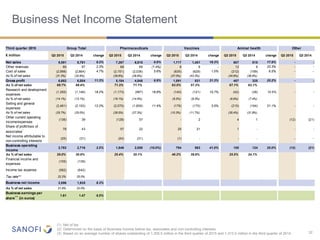
Sanofi reported results for Q3 2015 with sales growing 3.4% at constant exchange rates. Business EPS grew 6.1% at constant exchange rates. While diabetes sales declined 6.6% due to lower sales of Lantus in the US, other businesses such as Genzyme, vaccines, and Merial showed solid sales growth. Praluent was launched in the US and Europe for cholesterol treatment.
BioCentury BayHelix China healthcare Summit 2016 - McKinsey report _building...Franck Le Deu
In this report prepared in the context of the BioCentury China Summit, we provide an overview of the latest trends impacting China healthcare and the biopharma market, including the CFDA reform.
M&A activity in 2014 was dynamic, with more in vitro diagnostics (IVD) transactions compared to the previous two years combined. For 2015 to date, Worldwide IVD transactions (including instrument/reagent manufacturers, genome informatics and reference labs) are on par with 2014 activity although there has been a sharp decline in acquisitions in China. Also, EY’s Medtech Firepower Index shows steady growth in “firepower” – which EY defines as a company’s ability to do M&A based on the strength of its balance sheet -- since 2011, indicating high borrowing capacity and the potential for future transaction execution. In particular, the diagnostics market has seen an emergence of creative deal making between nontraditional partners specifically within oncology, NIPT and MRSA.
Reimagine the future of customer engagement: second Navigator Spotcheck updateAcross Health
Do you want to know more on the HCPs behaviour changes during COVID-19 lockdown? Let Fonny Schenck (CEO, Across Health) walk you through the findings of our most recent Navigator Spotcheck (302 oncologists in EU5 + US).
Some of the key questions of our second COVID-related webinar:
- Which channels shifted most in terms of reach, impact and
frequency vs Q4 2019?
- What kind of pharma content are HCPs looking for online?
- Are there key differences between geo markets – and between
HCP segments?
- How do oncologists see the future role of the rep?
- Which companies are “best-in-class”?
We trust this session will help you reimagine the future of customer engagement in biopharma!
For the recorded webinar and the full deck please visit:
https://bit.ly/3ewb0zX
2019-2020: Blip or shift? Key trends in the HCP mixAcross Health
Using relevant insights from our Navigator365 platform, Fonny Schenck (CEO) and David Ziedman (Head of Accounts) will take you back to 2020, explore key shifts vs 2019, and lift a tip of the veil on the Omnichannel Customer Engagement market dynamics you can expect in 2021 and beyond.
Key topics include:
• HCP shifts in channel & content affinity & impact
• HCP interest in & (dis)satisfaction with biopharma’s digital offerings
• Emerging competitor moves
• Future scenarios
Watch the recorded webinar on our website: http://bit.ly/3kUVNNi.
Excelling in omnichannel engagement: how-to & industry reference casesAcross Health
“I hear and I forget. I see and I remember. I do and I understand”
Within the spirit of Confucius, we aim at helping you remember and understand the key ingredients of the omnichannel engagement recipe. This webinar will take you one step further on your journey.
This webinar intends to:
• Show you how implementing deep customer insights and agile mix techniques can help create impactful and engaging marketing plans
• Bring to life the integration process using examples and case studies
For the recorded webinar please visit: http://bit.ly/2mmqh0i
Pharmaceutical Mergers Acquisitions in the U.SCapgemini
Since 2010, approximately 200 pharmaceutical and biotech deals have taken place per year in the United States. In 2014, only 182 major deals took place, lower than average (~190).
However, 2014 surpassed the combined value of deals from 2011-2013 ($178bn) and saw over $200bn in mergers and acquisitions, a 300% increase from the previous year.
Comparison of Pfizer, Novartis, Bayer, Genentech and Other Top Pharmaceutical...Unmetric
Take a deep dive in to the social media habits of top pharmaceutical companies like Pfizer, Merck, Bayer, Novartis and other top companies. Discover the social media strategies that helped drive engagement and allow them to connect to audiences on Facebook in the third quarter of 2015.
Whether it's directly improving patient care or helping lower costs to provide more access to healthcare, organizations are continuing to use IT to move the needle for an industry that is at a pivotal point in innovation.
Learn how our innovative storage solutions can help your organization meet its healthcare Big Data challenges: http://www.netapp.com/us/solutions/industry/healthcare/
In Healthcare, we provide detailed analysis and projections of healthcare fields, occupations, and their wages. In addition, we discuss the important skills and work values associated with healthcare fields and occupations. Finally, We analyze the implications of our findings for the racial, ethnic, and class diversity of the healthcare workforce in the coming decade.
How do we see the healthcare's digital future and its impact on our lives?Jane Vita
"Healthcare is undergoing major changes spurred on by, but not limited to, technology.
Digitalisation is changing the way we think about health, what taking care of it really entails, our personal role in healthcare systems and the way we interact with technology in the context of health.
In many ways, we are entering a post-institutional age of increased personal responsibility, which presents healthcare service providers and other players in the field with major opportunities and great risks. Technology has the potential to empower people and help them become more active in the management of their and their families’ health. This will change the relationship of the patient and the caregiver in profound ways." Mirkka Länsisalo
A co-creation with Mirkka Läansisalo and Sala Heinänen, at Futurice.
With the explosion of the maker movement, schools are beginning to embrace creativity. However, what does this mean for assessment? Should we assess the creative process? Should we assess the finished product? Does assessing creativity actually make kids more risk-averse? In this workshop we explore what it means to assess both the creative process and the creative product without leading to risk aversion.
The Digital Prescription for Pharmacy Event - Digital Leadership for Pharmaci...Doyle Buehler
The Prescription For Pharmacy is a live webcast event for the launch of the book and training program.
The presentation is about defining your digital leadership online for Chemist, and what they can do to actually make online work for their pharmacy.
There is no quick fix - it is not as easy as taking a pill to get your online platform ready and working for your pharmacy.
We will deep dive into what it takes to connect social media, your website, your digital strategy, your content plan, how to put in a working sales funnel, how to advertise, how to create branding with visuals and videos. It's going to take some work, but you need to start somewhere.
Most pharmacists do not have a clear strategy for making online work, and work well. It is more about creating a conversation with your audience which will then create the conversions that every business needs.
Pharmacy is no different than other business - Pharmacists need to recognise how to easily put together a solid digital strategy, to ensure that their store survives the digital disruption.
Healthcare situations, burdens and solutions for Asia-Pacific. Report by EIU, sponsored by Janssen.
For more information, please visit: http://www.economistinsights.com/healthcare/analysis/shifting-landscape-healthcare-asia-pacific
2. 2
Forward Looking Statements
This presentation contains forward-looking statements as defined in the Private Securities Litigation Reform Act of
1995, as amended. Forward-looking statements are statements that are not historical facts. These statements include
projections and estimates and their underlying assumptions, statements regarding plans, objectives, intentions and
expectations with respect to future financial results, events, operations, services, product development and potential,
and statements regarding future performance. Forward-looking statements are generally identified by the words
"expects", "anticipates", "believes", "intends", "estimates", "plans" and similar expressions. Although Sanofi's
management believes that the expectations reflected in such forward-looking statements are reasonable, investors are
cautioned that forward-looking information and statements are subject to various risks and uncertainties, many of which
are difficult to predict and generally beyond the control of Sanofi, that could cause actual results and developments to
differ materially from those expressed in, or implied or projected by, the forward-looking information and statements.
These risks and uncertainties include among other things, the uncertainties inherent in research and development,
future clinical data and analysis, including post marketing, decisions by regulatory authorities, such as the FDA or the
EMA, regarding whether and when to approve any drug, device or biological application that may be filed for any such
product candidates as well as their decisions regarding labeling and other matters that could affect the availability or
commercial potential of such product candidates, the absence of guarantee that the product candidates if approved will
be commercially successful, the future approval and commercial success of therapeutic alternatives, the Group's ability
to benefit from external growth opportunities, trends in exchange rates and prevailing interest rates, the impact of cost
containment policies and subsequent changes thereto, the average number of shares outstanding as well as those
discussed or identified in the public filings with the SEC and the AMF made by Sanofi, including those listed under
"Risk Factors" and "Cautionary Statement Regarding Forward-Looking Statements" in Sanofi's annual report on Form
20-F for the year ended December 31, 2014. Other than as required by applicable law, Sanofi does not undertake any
obligation to update or revise any forward-looking information or statements.
4. Sanofi Grew Sales and Business EPS in Q3 2015
while Accelerating Investments to Drive Future Growth
4
Delivering
solid sales growth
Posting
steady financial results
Bringing
innovative medicines
to market
NDA: New Drug Application
GBUs: Global Business Units
(1) On a reported basis, Q3 2015 sales were up +9.2%
(2) On a reported basis, Q3 2015 Business EPS was up +9.5%
(3) In particular Aubagio®, NexGard®, Lemtrada® and Toujeo®
(4) Scheduled to be effective January 1, 2016
Building
a sustainable
path forward
11
22
33
44
● Higher OpEx, as expected, driven by investment in launches
● Business EPS up +6.1% at CER(2)
● Sales up +3.4% at CER(1) despite Diabetes sales erosion
in the U.S.
● Growing contribution from new products(3)
● Praluent® launched in the U.S. and EMA approval granted
● NDA for lixisenatide accepted for review by FDA
● Plans for implementation of Global Business Unit structure
and globalization of functions on track(4)
5. Q3 2015FX Impact
+€0.05
Incremental
EPS at CER
+€0.09
Q3 2014
Net Sales Business EPS
Solid Top and Bottom Lines Growth in Q3 2015
5
(1) On a reported basis, Q3 2015 sales were up +9.2% and Business EPS was up +9.5%
+6.1%
at CER(1)
FX Impact Q3 2015
+€508m
Incremental
Sales at CER
+€302m
Q3 2014
+3.4%
at CER(1)
€8,781m
€9,591m
€1.47
€1.61
6. 6
Q3 2015 Sales by Business Areas
(1) Q3 2015 sales were up +3.4% at CER and +9.2% on a reported basis
(2) Q3 2015 sales excluding Diabetes were €7,739m, up +6.0% at CER; YTD Sep 2015 sales excluding Diabetes were €22,102m, up +5.8% at CER
(3) Sales of Pharmaceuticals include €4m of Praluent®
Growth at CER
Genzyme
Generics
Consumer Healthcare
Diabetes
Oncology
€923m
€452m
€814m
€1,852m
€376m
+32.7%
+6.7%
+3.2%
-6.6%
+5.4%
Broad-based Sales Growth Continues in Q3 2015(1,2)
% of Sales
9.6%
8.5%
19.3%
4.7%
3.9%
Animal Health
Vaccines
€607m
€1,717m
+9.3%
+5.5%17.9%
6.3%
Pharmaceuticals(3)
€7,267m +2.6%75.8%
Established Products €2,846m +0.1%29.8%
Q3 2015 sales growth excluding Diabetes of +6.0% at CER
7. Diabetes Performance in Q3 2015 Reflects
Lower U.S. Sales of Lantus® than Expected
7
(1) Diabetes sales in the U.S. declined by 12.0% at CER in Q1 2015 and by 14.0% at CER in Q2 2015
(2) U.S. Lantus® sales were €997m down -19.6% at CER in Q3 2015
(3) Diabetes sales in Western EU were €296m, down -0.3% at CER, in Q3 2015
(4) Diabetes sales in Emerging Markets were €373m, up +15.5% in Q3 2015
Global diabetes sales expected to be down between 6% and 7% at CER in 2015
● U.S. Lantus® sales(2)
impacted by:
● Higher discounts as compared to last year
● Slower than expected U.S. basal market
● Higher than expected proportion of sales to U.S.
government channels (e.g. Medicaid)
● Successfully defending U.S. glargine TRx share
post Toujeo® launch
● Stable diabetes sales in Western EU(3)
given
biosimilar glargine entry in some countries
● Sustained double-digit diabetes sales growth
in Emerging Markets(4)
Q3 2015 Diabetes Sales
by Geography (€m)
Global Diabetes Sales:
€1,852m, -6.6% at CER
Ex-U.S.
€777m
+8.1% at CER
U.S.
(1)
€1,075m
-16.4% at CER
42.0%
58.0%
8. Global Roll-out Underway and Showing Early
Promise in Key Markets
8
0%
1%
2%
3%
4%
5%
6%
7%
8%
1 3 5 7 9 11 13 15 17 19 21 23 25
0%
10%
20%
30%
40%
50%
60%
1 3 5 7 9 11 13 15 17 19 21 23 25 27
Weekly NBRx Share
within Basal Market(1)
Lantus®
49.8%
Levemir®
26.8%
NPH
9.4%
Weekly Sell Out Share (in Units/Packs)
within Basal Market(2)
6.8%
(1) Basal market includes Toujeo®, Lantus®, Levemir® (a Novo Nordisk brand) and NPH - Source: IMS Weekly Data week of April 3 - week of Oct 9, 2015
(2) Insight Health Germany (Retail Apo-Weekly-Pharma) – All data including parallel trade; Toujeo® week of May 5 - Oct 20, 2015;
Tresiba® week of April 29 - Oct 14, 2014
Weeks from Toujeo® Launch Weeks from Launch
3.6%
Tresiba®
Additional launches in Q3 in Japan, Canada, U.K. and other EU countries
14.0%
9. Genzyme Delivers Strong Q3 2015 with MS Franchise
Continuing to More than Double vs. Q3 2014
● Strong MS sales in Q3 2015
● Aubagio® reaching €225m
● Lemtrada® at €68m, sequentially up +24.0%
at CER from previous quarter
● ECTRIMS data presentations support value
proposition of MS products:
Aubagio® favorable impact on brain atrophy(1)
Lemtrada® effect maintained over 5 years(2)
● Sustained Rare Diseases sales growth driven
by continued new patient accrual
● Double digit growth of Gaucher franchise, Fabry and
Pompe brands(3)
9
Genzyme Quarterly Sales
Q3 2014 Q3 2015
€923m
+32.7% at CER
€293m
+120.2%
at CER
€119m
€649m
MS: Multiple Sclerosis
(1) Additional MRI data on brain atrophy from Phase III TEMSO study, Press release October 7th 2015
(2) CARE-MS I&II 5-year extension study, Press release October 8th 2015
(3) Gaucher franchise (Cerezyme®+Cerdelga®) sales were €207m, up +14.3% at CER, while
Fabrazyme and Myozyme were €147m and €162m respectively, up +18.1% at CER and +10.9% at CER
Rare Disease
Multiple Sclerosis
€630m
+13.0%
at CER€530m
10. Vaccines Showed Good Sales Growth in Q3 2015
10
Q3 2015
€1,717m
+5.5% at CER
Q3 2014
€1,451m
Other
Adult Boosters
Travel/Endemic
Polio/Pertussis/Hib
Influenza Vaccines
Meningitis/Pneumo
(2)
(1) U.S. flu vaccines sales were €576m in Q3 2015, up 8.3% at CER
(2) Includes VaxServe, a U.S. healthcare supplier serving primary care physician offices, community immunization providers,
immunizing pharmacies, travel clinics and corporations
● Stable flu vaccines sales of €736m
(+0.3% at CER) in Q3 2015
● Solid U.S. performance(1)
, partially offset by
delayed supply in Western EU and Mexico
● PPH sales up +17.8% at CER driven
by strong delivery pattern in China
● Menactra® sales up +17.8% at CER as
a result of U.S. public sector purchases
● Dengue vaccine launch preparation on track
● 1st license anticipated before year-end
● 1st wave of launches in endemic countries
planned for 2016
Sanofi Pasteur Quarterly Sales
On track to deliver >65m doses of Flu vaccine in the U.S. in 2015
11. Sixth Consecutive Quarter of Growth at Merial
Driven by Strong Performance in Pets
11
● Q3 2015 sales of €607m, up +9.3% at
CER
● Companion Animals sales of €401m,
up +13.6% at CER
● NexGard® U.S. advertising campaign
leads to strong performance in Q3 2015
● Production Animals segment sales of
€206m, up +2.5% at CER
Q3
2013
Q4
2013
Q1
2014
Q2
2014
Q3
2014
Q4
2014
Q1
2015
Q2
2015
Q3
2015
-6.3%-6.4%
-1.6%
+12.7%
+6.2%
+11.5%
+13.5%
+14.2%
+9.3%
Quarterly Sales Growth
at CER
12. (1) World excluding U.S., Canada, Western Europe (France, Germany, UK, Italy, Spain, Greece, Cyprus, Malta,
Belgium, Luxembourg, Portugal, the Netherlands, Austria, Switzerland, Sweden, Ireland, Finland, Norway,
Iceland, Denmark), Japan, South Korea, Australia, and New Zealand
(2) RoW: Japan, South Korea, Canada, Australia, and New Zealand
(3) At constant exchange rate
Double Digit Growth in Emerging Markets
and Low Single Digit Growth in the U.S. in Q3 2015
29.9%
40.5%
20.7%
8.9%
12
(1)
€964m
€697m
€587m €562m
Asia Latin America Eastern Europe,
Russia & Turkey
Africa & Middle
East
+7.0% +6.0% +11.4%Growth at CER +17.8%
Emerging Markets Sales by Region
Emerging
Markets
€2,871m
+11.4%
at CER
U.S.
€3,888m
+2.3% at CER
Western EU
€1,988m
-1.8% at CER
RoW
€844m
-4.5% at CER
(2)
Q3 2015 Sales by Geography (€m)
(3)
13. Early Launch Progress Encouraging with
Gradual Uptake(1)
Consistent with Expectations
● U.S. comprehensive
support hub tracking in line with
expectations
● Over 4,000 prescribers
● Preferred Tier 2 formulary position
granted by ESI (parity for both PCSK9
brands)
● Formulary status at CVS
and UHC pending
● Near-term expansion opportunities:
Driving awareness and adoption
Gaining greater U.S. market access
13
Launches in first EU countries underway
UHC: United Healthcare
(1) Initial U.S. sales were €4m in Q3 2015
75 mg/1 mL pen 150 mg/1 mL pen
Both doses available in a single-dose, 1-mL,
prefilled pen and prefilled syringe
Dosage and Administration Options
150 mg
Q2W
Available in 2 Doses
Increase
if needed
Recommended
starting dose
75 mg
Q2W
14. New Launches More than Offset Lantus® Sales Decline
in YTD Sep 2015
14
YTD Sep
2015
FXOthers Q3 2015
at CER
Lantus®LaunchesYTD Sep
2014
+€566m
-€332m
+€647m
+€2,200m
(1)
(1) Includes Aubagio®, Lemtrada®, Cerdelga®, Toujeo®, Afrezza®, Praluent®, NexGard®
+3.6%
at CER
€27,779m
€24,698m
YTD Sep 2015 Sales
€25,579m
+12.5%
reported
15. 15
U.S. (Q4 2015)
EU (Q3 2016)
Regulatory Submissions for Two High Potential Products
Expected by Year End
1
Key Regulatory Submissions
Rheumatoid Arthritis
U.S. (Q4 2015)
EU (Q1 2016)
2
Diabetes
sarilumab
17. Net Sales(1,2)
Business EPS(1,2)
17
FX Tailwind Easing Due to Emerging Market Currencies
in Q3 2015
(1) Main currency impact on sales in Q3 2015: U.S. Dollar (+€621m); Chinese Yuan (+€79m); Brazilian Real (-€82m);
Venezuelan Bolivar Forte (-€81m); Russian Ruble (-€62m)
(2) Q3 2015 Fx impact without Venezuela on Sales +€589m (+6.7ppt) and Business EPS +€0.15 (+10.3ppt)
Quarterly Currency Impact
-1.0%
-€81m
+9.9%
+€782m
Q2 2015
Q3 2014
Q4 2014 Q1 2015
+2.7%
+€229m
-€0.03
-2.2%
+1.5%
+€0.02
+10.2%
+€0.12
Q3 2015
+11.2%
+€910m
+15.4%
+€0.18
+5.8%
+€508m
+3.4%
+€0.05
Q2 2015
Q3 2014
Q4 2014 Q1 2015 Q3 2015
18. CER: Constant Exchange Rates
(1) Includes a foreign exchange loss of €137m on Venezuela 18
Q3 2015 Business Operating Income Stable at CER
Given Investments to Drive Future Growth
€m Q3 2015 Q3 2014
% Change
(reported €)
% Change
(CER)
Net sales 9,591 8,781 +9.2% +3.4%
Other revenues 89 87 +2.3% -8.0%
Cost of sales (2,998) (2,864) +4.7% +2.0%
Gross profit 6,682 6,004 +11.3% +4.0%
R&D (1,355) (1,146) +18.2% +9.9%
SG&A (2,461) (2,193) +12.2% +6.2%
Other current operating income & expenses (136) 39 - -
Share of Profit/Loss of associates 78 43 - -
Minority interests (25) (31) - -
Business operating income 2,783 2,716 +2.5% -0.4%
Business operating margin 29.0% 30.9% - -
(1)
19. 19
€m Q3 2015 Q3 2014
% Change
(reported €)
% Change
(CER)
Business operating income 2,783 2,716 +2.5% -0.4%
Net financial expenses (105) (139) - -
Income tax expense (582) (642) - -
Effective tax rate -22.2% -25.0% - -
Business net income 2,096 1,935 +8.3% +5.0%
Net margin 21.9% 22.0% - -
Business EPS €1.61 €1.47 +9.5% +6.1%
Average number of shares outstanding (m) 1,305.5 1,313.0 - -
Mid-Single Digit Business Net Income Growth at CER
in Q3 2015 Resulting from Lower Tax Rate
19
CER: Constant Exchange Rates
20. Gross Margin Consistent with FY 2015 Expectations
● Cost of Sales (CoS) of €2,998m
in Q3 2015, up +2.0% at CER
● Gross margin of 69.7% in Q3 2015
reflecting 1.3 pt increase over Q3 2014:
● Positive impact from MS franchise and
Vaccines more than offsetting negative
impact of Diabetes U.S. and Plavix® LoE
in Japan
● Favorable FX impact (1.0 pt)
20
Gross Margin (%)
Q1
2014
Q2
2014
Q3
2014
Q4
2014
Q1
2015
Q2
2015
Q3
2015
69.7%
68.4%
Gross Margin expected to be around 69% in 2015
21. OpEx Up +5.0% at CER in YTD Sep 2015 as Expected
2121
Q1
2014
Q2
2014
Q3
2014
Q4
2014
Q1
2015
Q2
2015
Q3
2015
€3,816m
€3,339m
Operating Expenses (€m)
€1,355m
€1,146m
€2,461m
€2,193m
Targeting mid-single digit OpEx growth at CER in 2015
● Q3 2015 OpEx of €3,816m,
up +7.5% at CER
● R&D expenses of €1,355m
(14.1% of sales), up +9.9% at CER,
driven by dupilumab, ODYSSEY CVOT
study and immuno-oncology
● SG&A expenses of €2,461m
(25.7% of sales), up +6.2% at CER,
mainly due to Toujeo® DTC, Praluent®
launch, support to MS brands as well as
Animal Health
SG&A
R&D
22. Over €5bn of Free Cash Flow Generated in YTD Q3 2015
22
Net Debt (€m)
Acquisitions,
Licensing, Net
of Disposals
€3,694m
€1,383m
Share
Repurchase
Proceeds
from Issuance
of Shares
€552m
CapEx
€1,009m
Net Cash from
Operating
Activities
Net Debt
Dec 31, 2014
Other
€1,182m
Net Debt
Sep 30, 2015
Dividend
€1,481m
(1)
(2)
€7,171m
€9,354m€6,014m
(4) (1)
FCF
€5,005m
FCF: Free Cash Flow
(1) Including derivatives related to the financial debt +€302m at December 31st 2014 and +€302m at September 30th 2015
(2) Excluding Restructuring costs
(3) Including Regeneron immuno-oncology collaboration of €584m and Caprelsa® rights of €149m
(4) Other including Restructuring costs and Fx impact
(3)
23. Business EPS Growth
Between +6% and +8%(3)
Stable to slightly growing at CER(1,2)
23
(1) Barring major unforeseen adverse events
(2) FY 2014 Business EPS of €5.20
(3) Difference between variation on a reported basis and variation at CER, when applying September
2015 average exchange rates to the remaining quarter of the year and including Venezuela impact
Outlook for 2015 Reaffirmed
FY 2015
FX impact on Business EPS
31. Business EPS Currency Sensitivity
Currency Exposure on Q3 2015 Sales Currency Average Rates
2015 Currency Sensitivity
31
Q3 2014 Q3 2015 % change
EUR/USD 1.33 1.11 -16.5%
EUR/JPY 137.74 135.89 -1.3%
EUR/CNY 8.17 7.01 -14.2%
EUR/RUB 48,08 70,46 +46.6%
Currency Variation Business EPS Sensitivity
U.S. Dollar -0.05 USD/EUR +EUR 0.10
Japanese Yen +5 JPY/EUR -EUR 0.03
Russian Ruble +10 RUB/EUR -EUR 0.06
€
21.4%
US $
41.5%
Japanese Yen
4.5%
Bristish £
2.1%
Australian $
1.4%
Canadian $
1.5%
Brazilian Real
2.7%
Chinese Yuan
5.9%
Russian
Ruble
1.4%
Others
16.2%
Mexican Peso
1.4%
32. 32
Business Net Income Statement
Third quarter 2015
Net sales 9,591 8,781 9.2% 7,267 6,815 6.6% 1,717 1,451 18.3% 607 515 17.9% - -
Other revenues 89 87 2.3% 68 69 (1.4%) 9 9 - 12 9 33.3% - -
Cost of sales (2,998) (2,864) 4.7% (2,151) (2,036) 5.6% (635) (629) 1.0% (212) (199) 6.5% - -
As % of net sales (31.3%) (32.6%) (29.6%) (29.9%) (37.0%) (43.3%) (34.9%) (38.6%)
Gross profit 6,682 6,004 11.3% 5,184 4,848 6.9% 1,091 831 31.3% 407 325 25.2% - -
As % of net sales 69.7% 68.4% 71.3% 71.1% 63.5% 57.3% 67.1% 63.1%
Research and development
expenses
(1,355) (1,146) 18.2% (1,173) (987) 18.8% (140) (121) 15.7% (42) (38) 10.5% - -
As % of net sales (14.1%) (13.1%) (16.1%) (14.5%) (8.2%) (8.3%) (6.9%) (7.4%)
Selling and general
expenses
(2,461) (2,193) 12.2% (2,070) (1,859) 11.4% (176) (170) 3.5% (215) (164) 31.1% - -
As % of net sales (25.7%) (25.0%) (28.5%) (27.3%) (10.3%) (11.7%) (35.4%) (31.8%)
Other current operating
income/expenses
(136) 39 (128) 57 - 2 4 1 (12) (21)
Share of profit/loss of
associates* 78 43 57 22 20 21 1 - - -
Net income attributable to
non-controlling interests
(25) (31) (24) (31) (1) - - - - -
Business operating
income
2,783 2,716 2.5% 1,846 2,050 (10.0%) 794 563 41.0% 155 124 25.0% (12) (21)
As % of net sales 29.0% 30.9% 25.4% 30.1% 46.2% 38.8% 25.5% 24.1%
Financial income and
expenses
(105) (139)
Income tax expense (582) (642)
Tax rate** 22.2% 25.0%
Business net income 2,096 1,935 8.3%
As % of net sales 21.9% 22.0%
Business earnings per
share***
(in euros)
1.61 1.47 9.5%
Q3 2014€ million Q3 2015 Q3 2014 change Q3 2015 change Q3 2015 Q3 2014change Q3 2015 Q3 2014 change Q3 2015 Q3 2014
OtherGroup Total Pharmaceuticals Vaccines Animal health
(1) Net of tax
(2) Determined on the basis of Business income before tax, associates and non-controlling interests
(3) Based on an average number of shares outstanding of 1,305.5 million in the third quarter of 2015 and 1,313.0 million in the third quarter of 2014
33. 33
Business Net Income Statement
Nine months 2015
Net sales 27,779 24,698 12.5% 22,522 20,332 10.8% 3,301 2,797 18.0% 1,956 1,569 24.7% - -
Other revenues 252 241 4.6% 197 195 1.0% 23 23 - 32 23 39.1% - -
Cost of sales (8,722) (7,988) 9.2% (6,593) (6,082) 8.4% (1,461) (1,329) 9.9% (668) (577) 15.8% - -
As % of net sales (31.4%) (32.4%) (29.3%) (29.9%) (44.3%) (47.5%) (34.2%) (36.8%)
Gross profit 19,309 16,951 13.9% 16,126 14,445 11.6% 1,863 1,491 24.9% 1,320 1,015 30.0% - -
As % of net sales 69.5% 68.6% 71.6% 71.0% 56.4% 53.3% 67.5% 64.7%
Research and development
expenses
(3,844) (3,473) 10.7% (3,316) (3,012) 10.1% (402) (351) 14.5% (126) (110) 14.5% - -
As % of net sales (13.8%) (14.1%) (14.7%) (14.8%) (12.2%) (12.5%) (6.4%) (7.0%)
Selling and general
expenses
(7,547) (6,526) 15.6% (6,380) (5,580) 14.3% (520) (441) 17.9% (647) (505) 28.1% - -
As % of net sales (27.2%) (26.4%) (28.3%) (27.4%) (15.8%) (15.8%) (33.1%) (32.2%)
Other current operating
income/expenses
(223) 68 (167) 76 2 3 9 18 (67) (29)
Share of profit/loss of
associates* 139 82 118 55 20 27 1 - - -
Net income attributable to
non-controlling interests
(87) (96) (86) (96) (1) - - - - -
Business operating
income
7,747 7,006 10.6% 6,295 5,888 6.9% 962 729 32.0% 557 418 33.3% (67) (29)
As % of net sales 27.9% 28.4% 28.0% 29.0% 29.1% 26.1% 28.5% 26.6%
Financial income and
expenses
(314) (309)
Income tax expense (1,771) (1,678)
Tax rate** 24.0%) 25.0%
Business net income 5,662 5,019 12.8%
As % of net sales 20.4% 20.3%
Business earnings per
share***
(in euros)
4.33 3.81 13.6%
9M 2014 9M 2015 9M 2014
Other
9M 2014 change 9M 2015 9M 20149M 2015change change
Group Total Pharmaceuticals Vaccines Animal health
€ million 9M 2015 9M 2014 change 9M 2015
(1) Net of tax
(2) Determined on the basis of Business income before tax, associates and non-controlling interests
(3) Based on an average number of shares outstanding of 1,306.6 million in the first nine months of 2015 and 1,315.8 million in the first nine months of 2014
34. 34
Reconciliation of Business Net Income to Consolidated
Net Income Attributable to Equity Holders of Sanofi
€ million Q3 2015 Q3 2014 Change
Business net income 2,096 1,935 8.3%
Amortization of intangible assets(1)
(598) (561)
Impairment of intangible assets (209) (35)
Fair value remeasurement of contingent consideration liabilities 90 (45)
Restructuring costs (58) (163)
Other gains and losses, and litigation - -
Additional yearly expense related to US Branded Prescription Drug Fee (2) - (116)
Tax effect of: 310 261
amortization of intangible assets 210 188
impairment of intangible assets 77 13
fair value remeasurement of contingent consideration liabilities 8 5
other gains and losses, and litigation - -
restructuring costs 15 55
Other tax items - -
Share of items listed above attributable to non-controlling interests 2 -
Restructuring costs of associates and joint ventures, and expenses arising from the impact
of acquisitions on associates and joint ventures
(5) (86)
IFRS net income reported
(3) 1,628 1,190 36.8%
Consolidated earnings per share(4)
(in euros) 1.25 0.91
(1) Of which related to amortization expense generated by the remeasurement of intangible assets as part of business combinations:
€560 million in the third quarter of 2015 and €540 million in the third quarter of 2014
(2) Annual fee related to 2013 sales following the final IRS regulation issued in July 2014 that has changed the timing of liability recognition and leads
to a one-time “double” expense in the year of 2014
(3) Net income attributable to equity holders of Sanofi
(4) Based on an average number of shares outstanding of 1,305.5 million in the third quarter of 2015 and 1,313.0 million in the third quarter of 2014
35. 3535
Reconciliation of Business Net Income to Consolidated
Net Income Attributable to Equity Holders of Sanofi
€ million 9M 2015 9M 2014 Change
Business net income 5,662 5,019 12.8%
Amortization of intangible assets(1)
(1,827) (1,862)
Impairment of intangible assets (237) (109)
Fair value remeasurement of contingent consideration liabilities 161 (177)
Restructuring costs (439) (298)
Other gains and losses, and litigation (2)
- 35
Additional expense related to US Branded Prescription Drug Fee (3) - (116)
Tax effect of: 871 783
amortization of intangible assets 641 639
impairment of intangible assets 87 39
fair value remeasurement of contingent consideration liabilities (7) 19
other gains and losses, and litigation - (13)
restructuring 150 99
Other tax items(4)
(111) (110)
Share of items listed above attributable to non-controlling interests 5 4
Restructuring costs of associates and joint ventures, and expenses arising from the impact
of acquisitions on associates and joint ventures
(132) (118)
IFRS net income reported
(5) 3,953 3,051 29.6%
Consolidated earnings per share(6)
(in euros) 3.03 2.32
(1) Of which related to amortization expense generated by the remeasurement of intangible assets as part of business combinations: €1,732 million in
the first nine months of 2015 and €1,798 million in the first nine months of 2014
(2) Day one profit on Alnylam shares presented in financial result
(3) Annual fee related to 2013 sales following the final IRS regulation issued in July 2014 that has changed the timing of liability recognition and leads
to a one-time “double” expense in the year of 2014
(4) Tax on dividends paid to shareholders of Sanofi
(5) Net income attributable to equity holders of Sanofi
(6) Based on an average number of shares outstanding of 1,306.6 million in the first nine months of 2015 and 1,315.8 million in the first nine months
of 2014
36. 3636
Consolidated Income Statements
€ million
Net sales 9,591 8,781 27,779 24,698
Other revenues 89 87 252 241
Cost of sales (2,998) (2,864) (8,722) (7,988)
Gross profit 6,682 6,004 19,309 16,951
Research and development expenses (1,355) (1,146) (3,844) (3,473)
Selling and general expenses (2,461) (2,309) (7,547) (6,642)
Other operating income (108) 47 (25) 163
Other operating expenses (28) (8) (198) (95)
Amortization of intangible assets (598) (561) (1,827) (1,862)
Impairment of intangible assets (209) (35) (237) (109)
Fair value remeasurement of contingent consideration liabilities 90 (45) 161 (177)
Restructuring costs (58) (163) (439) (298)
Operating income 1,955 1,784 5,353 4,458
Financial expenses (127) (154) (394) (446)
Financial income 22 15 80 172
Income before tax and associates and joint ventures 1,850 1,645 5,039 4,184
Income tax expense(1)
(272) (381) (1,011) (1,005)
Share of profit / loss of associates and joint ventures 73 (43) 7 (36)
Net income 1,651 1,221 4,035 3,143
Net income attributable to non-controlling interests 23 31 82 92
Net income attributable to equity holders of Sanofi 1,628 1,190 3,953 3,051
Average number of shares outstanding (million) 1,305.5 1,313.0 1,306.6 1,315.8
Consolidated earnings per share (in euros) 1.25 0.91 3.03 2.32
Q3 2014Q3 2015 9M 2015 9M 2014
(1) In 2015, including a tax on dividends paid to shareholders of Sanofi: (111) M€ compared to (110) M€ in 2014