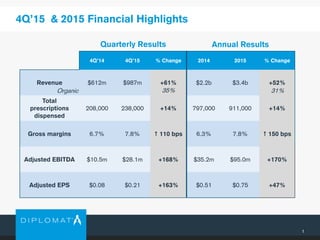
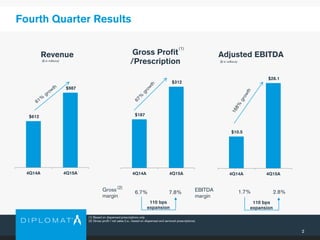
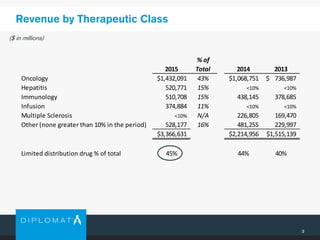
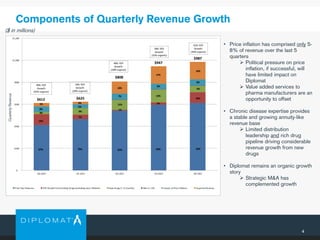
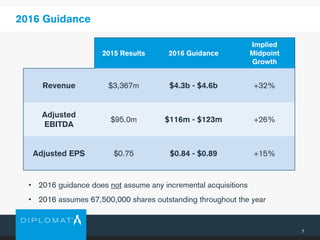
4Q’15 & 2015
Earnings Call
Supplemental Slides
February 29, 2016
4Q’15 & 2015 Financial Highlights
1
4Q’14 4Q’15 % Change 2014 2015 % Change
Revenue $612m $987m +61% $2.2b $3.4b +52%
Total
prescriptions
dispensed
208,000 238,000 +14% 797,000 911,000 +14%
Gross margins 6.7% 7.8%  110 bps 6.3% 7.8%  150 bps
Adjusted EBITDA $10.5m $28.1m +168% $35.2m $95.0m +170%
Adjusted EPS $0.08 $0.21 +163% $0.51 $0.75 +47%
Quarterly Results Annual Results
Organic 35% 31%
$612
$987
4Q14A 4Q15A
$187
$312
4Q14A 4Q15A
$10.5
$28.1
4Q14A 4Q15A
2
Fourth Quarter Results
(1) Based on dispensed prescriptions only.
(2) Gross profit / net sales (i.e., based on dispensed and serviced prescriptions).
Revenue
EBITDA
margin
1.7%
Adjusted EBITDAGross Profit
/Prescription($ in millions) ($ in millions)
2.8%7.8%6.7%
(1)
Gross
margin
(2)
110 bps
expansion
110 bps
expansion
3
Revenue by Therapeutic Class
($ in millions)
2015
% of
Total 2014 2013
Oncology 1,432,091$ 43% 1,068,751$ 736,987$
Hepatitis 520,771 15% <10% <10%
Immunology 510,708 15% 438,145 378,685
Infusion 374,884 11% <10% <10%
Multiple Sclerosis <10% N/A 226,805 169,470
Other (none greater than 10% in the period) 528,177 16% 481,255 229,997
3,366,631$ 2,214,956$ 1,515,139$
Limited distribution drug % of total 45% 44% 40%
4
Components of Quarterly Revenue Growth
($ in millions)
$-
$200
$400
$600
$800
$1,000
$1,200
Q4 2014 Q1 2015 Q2 2015 Q3 2015 Q4 2015
Prior Year Revenue YOY Growth from Existing Drugs (excluding price inflation) New Drugs (< 12 months) Misc (< 1%) Impact of Price Inflation Acquired Revenue
$808
$625$612
67%75%67%
1%
7%
16%
11%
9%
3%
7%
5%
8%
13%
4%5%
34% YOY
Growth
(29% organic)
49% YOY
Growth
(41% organic)
$947
63%
2%
13%
5%
17%
62%
10%
6%
6%
16%
$987
$808
$625$612
67%75%67%
1%
7%
16%
11%
9%
3%
7%
5%
8%
13%
4%5%
$947
63%
2%
13%
5%
17%
62%
10%
6%
6%
16%
$987
49% YOY
Growth
(29% organic)
59% YOY
Growth
(31% organic)
61% YOY
Growth
(35% organic)
QuarterlyRevenue
• Price inflation has comprised only 5-
8% of revenue over the last 5
quarters
 Political pressure on price
inflation, if successful, will
have limited impact on
Diplomat
 Value added services to
pharma manufacturers are an
opportunity to offset
• Chronic disease expertise provides
a stable and growing annuity-like
revenue base
 Limited distribution
leadership and rich drug
pipeline driving considerable
revenue growth from new
drugs
• Diplomat remains an organic growth
story
 Strategic M&A has
complemented growth
5
Annual Revenue by Drug Year Launch
$-
$500
$1,000
$1,500
$2,000
$2,500
$3,000
$3,500
$4,000
2013 2014 2015
2015
2014
2013
2012
2011
2006 - 2010
2001 - 2005
1996 - 2000
1995 and Prior
$1.5B
$2.2B
$3.3B
5%
21%
2%
18%
3%
16%
95%
$1.4B
77%
$1.7B
63%
$2.1B
• Drugs across all launch years
continue to grow substantially
over time
 2012 and prior drugs have
grown ~50% from 2013
to 2015
• 2015 a record year for FDA
approval of specialty drugs, yet
2015 launch drugs contributed
less than 3% of 2015 revenue
 Will ramp up dramatically
in 2016 and beyond
• Pipeline remains an important
element of near-term and long-
term growth; existing drugs will
also contribute meaningfully
6
Balance Sheet / Cash Flow snapshot
($ in millions)
(1) Includes $12mm in cash-based contingent consideration
(2) Includes $6mm in cash-based contingent consideration
December 31,
2014 2015
Cash $18 $28
Total Debt $12
(1)
$123
(2)
Shareholders’ equity $169 $516
Net Debt/ProForma EBITDA -- ~.8x
Cash Flow From Operations (year ended) ($10) $29
2016 Guidance
7
2015 Results 2016 Guidance
Implied
Midpoint
Growth
Revenue $3,367m $4.3b - $4.6b +32%
Adjusted
EBITDA
$95.0m $116m - $123m +26%
Adjusted EPS $0.75 $0.84 - $0.89 +15%
• 2016 guidance does not assume any incremental acquisitions
• 2016 assumes 67,500,000 shares outstanding throughout the year

Diplomat fourth-quarter-2015-operating-results

  • 1.
    4Q’15 & 2015 EarningsCall Supplemental Slides February 29, 2016
  • 2.
    4Q’15 & 2015Financial Highlights 1 4Q’14 4Q’15 % Change 2014 2015 % Change Revenue $612m $987m +61% $2.2b $3.4b +52% Total prescriptions dispensed 208,000 238,000 +14% 797,000 911,000 +14% Gross margins 6.7% 7.8%  110 bps 6.3% 7.8%  150 bps Adjusted EBITDA $10.5m $28.1m +168% $35.2m $95.0m +170% Adjusted EPS $0.08 $0.21 +163% $0.51 $0.75 +47% Quarterly Results Annual Results Organic 35% 31%
  • 3.
    $612 $987 4Q14A 4Q15A $187 $312 4Q14A 4Q15A $10.5 $28.1 4Q14A4Q15A 2 Fourth Quarter Results (1) Based on dispensed prescriptions only. (2) Gross profit / net sales (i.e., based on dispensed and serviced prescriptions). Revenue EBITDA margin 1.7% Adjusted EBITDAGross Profit /Prescription($ in millions) ($ in millions) 2.8%7.8%6.7% (1) Gross margin (2) 110 bps expansion 110 bps expansion
  • 4.
    3 Revenue by TherapeuticClass ($ in millions) 2015 % of Total 2014 2013 Oncology 1,432,091$ 43% 1,068,751$ 736,987$ Hepatitis 520,771 15% <10% <10% Immunology 510,708 15% 438,145 378,685 Infusion 374,884 11% <10% <10% Multiple Sclerosis <10% N/A 226,805 169,470 Other (none greater than 10% in the period) 528,177 16% 481,255 229,997 3,366,631$ 2,214,956$ 1,515,139$ Limited distribution drug % of total 45% 44% 40%
  • 5.
    4 Components of QuarterlyRevenue Growth ($ in millions) $- $200 $400 $600 $800 $1,000 $1,200 Q4 2014 Q1 2015 Q2 2015 Q3 2015 Q4 2015 Prior Year Revenue YOY Growth from Existing Drugs (excluding price inflation) New Drugs (< 12 months) Misc (< 1%) Impact of Price Inflation Acquired Revenue $808 $625$612 67%75%67% 1% 7% 16% 11% 9% 3% 7% 5% 8% 13% 4%5% 34% YOY Growth (29% organic) 49% YOY Growth (41% organic) $947 63% 2% 13% 5% 17% 62% 10% 6% 6% 16% $987 $808 $625$612 67%75%67% 1% 7% 16% 11% 9% 3% 7% 5% 8% 13% 4%5% $947 63% 2% 13% 5% 17% 62% 10% 6% 6% 16% $987 49% YOY Growth (29% organic) 59% YOY Growth (31% organic) 61% YOY Growth (35% organic) QuarterlyRevenue • Price inflation has comprised only 5- 8% of revenue over the last 5 quarters  Political pressure on price inflation, if successful, will have limited impact on Diplomat  Value added services to pharma manufacturers are an opportunity to offset • Chronic disease expertise provides a stable and growing annuity-like revenue base  Limited distribution leadership and rich drug pipeline driving considerable revenue growth from new drugs • Diplomat remains an organic growth story  Strategic M&A has complemented growth
  • 6.
    5 Annual Revenue byDrug Year Launch $- $500 $1,000 $1,500 $2,000 $2,500 $3,000 $3,500 $4,000 2013 2014 2015 2015 2014 2013 2012 2011 2006 - 2010 2001 - 2005 1996 - 2000 1995 and Prior $1.5B $2.2B $3.3B 5% 21% 2% 18% 3% 16% 95% $1.4B 77% $1.7B 63% $2.1B • Drugs across all launch years continue to grow substantially over time  2012 and prior drugs have grown ~50% from 2013 to 2015 • 2015 a record year for FDA approval of specialty drugs, yet 2015 launch drugs contributed less than 3% of 2015 revenue  Will ramp up dramatically in 2016 and beyond • Pipeline remains an important element of near-term and long- term growth; existing drugs will also contribute meaningfully
  • 7.
    6 Balance Sheet /Cash Flow snapshot ($ in millions) (1) Includes $12mm in cash-based contingent consideration (2) Includes $6mm in cash-based contingent consideration December 31, 2014 2015 Cash $18 $28 Total Debt $12 (1) $123 (2) Shareholders’ equity $169 $516 Net Debt/ProForma EBITDA -- ~.8x Cash Flow From Operations (year ended) ($10) $29
  • 8.
    2016 Guidance 7 2015 Results2016 Guidance Implied Midpoint Growth Revenue $3,367m $4.3b - $4.6b +32% Adjusted EBITDA $95.0m $116m - $123m +26% Adjusted EPS $0.75 $0.84 - $0.89 +15% • 2016 guidance does not assume any incremental acquisitions • 2016 assumes 67,500,000 shares outstanding throughout the year