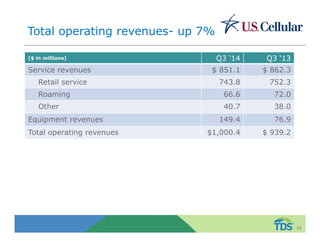
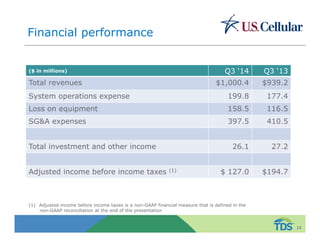
- U.S. Cellular reported financial results for the third quarter of 2014, with operating revenues up 7% year-over-year to $1 billion. Adjusted income before taxes was $127 million.
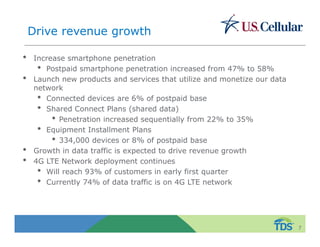
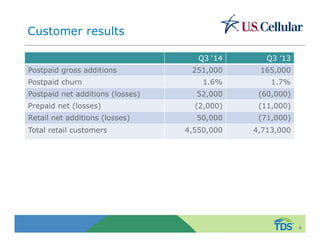
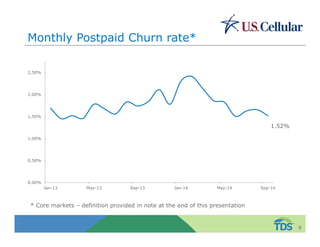
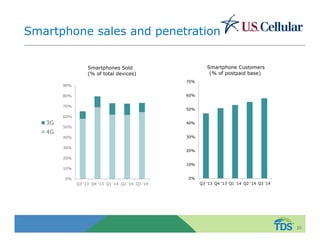
- Key highlights included positive postpaid net additions, lower postpaid churn of 1.6%, and increased smartphone penetration to 58% of postpaid customers.
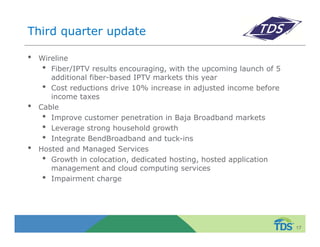
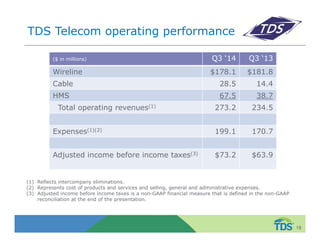
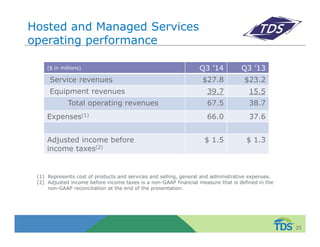
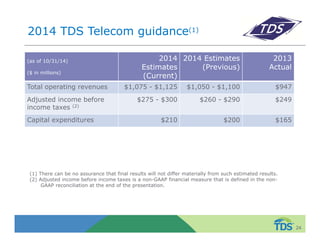
- TDS Telecom also saw increases in operating revenues and adjusted income before taxes compared to the previous year.