This presentation includes forward-looking statements about Calix's products, growth drivers, and financial condition and results. Any forward-looking statements are subject to risks and uncertainties that could cause actual results to differ. Examples of forward-looking statements include statements about new product and feature development, anticipated growth and growth drivers, future financial performance, and market adoption of Calix's products. Calix's actual results may differ materially from projected results.


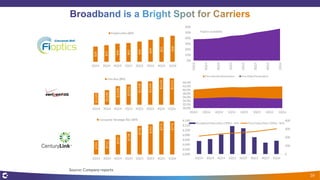
![“Total Internet subscribers grew by more than 19,000 from a year ago, as we ended the quarter with over
290,000 subscribers. Fioptics Internet subscriber additions totaled nearly 11,000 for the quarter, which is a
15% increase compared to the first quarter of 2015, with Internet penetration rates exceeding 35%. Fioptics
Internet ARPU totaled $47, up 12% compared to a year ago.” May 5, 2016
"In the consumer [wireline] business, FiOS remains the driver of revenue growth, and now represents around
81 percent of consumer revenue. In the first quarter, consumer revenue grew 28 percent," Verizon CFO Fran
Shammo said during the company's earnings conference call with investors. “…fully 60 percent of new
customer FiOS sales opt for 100 Mbps speeds and above.” April 21, 2016
“We are expanding and upgrading our broadband network to establish a strong foundation for sustaining
growth. We will grow consumer revenue in 2016 as we benefit from employment of 50, 75 and 100 Meg
premier speeds which were rolled out during the fourth quarter 2015 to approximately 1 million locations….
We also launched one gig Internet services in four market areas including Nebraska, Kentucky, Texas and in
several areas surrounding Charlotte, North America North Carolina -- from our broadband infrastructure.”
May 5, 2016
“We've got the rapidly expanding GPON markets. We've gone up again, and we're now at 1.5 million homes
and businesses we're here passing the grid out. We've got -- with the exclusion of the last couple hundred
thousand, I know we were at 21% penetration at the end of March. We just started over the last year with that
GPON work….So that along with MDU and MTU focus we have now, we have fiber to a number of MDUs MTU
that are going to help drive revenue.” May 4, 2016
38](https://image.slidesharecdn.com/may2016calixinvestorpresentation-160601151046/85/May-2016-calix-investor-presentation-38-320.jpg)


![[White Paper] Can Software-Defined Networking (SDN) Enhance Operator Monetiza...](https://cdn.slidesharecdn.com/ss_thumbnails/white-paper-c11-731957-140923172956-phpapp01-thumbnail.jpg?width=640&height=640&fit=bounds)


