Download as PDF, PPTX
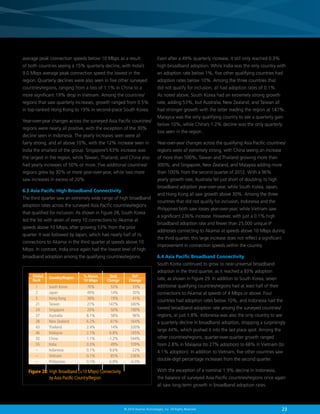


The document is the Akamai State of the Internet report for Q3 2013, highlighting trends in internet connectivity, attack traffic, and broadband adoption. It notes a global average connection speed increase to 3.6 Mbps, with South Korea leading in both average and high broadband connectivity. The report also introduces a companion app for iOS users to access interactive data and insights on internet performance and connectivity.