This document provides Nielsen's financial results for the second quarter of 2017. Key points include:
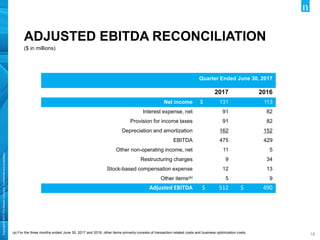
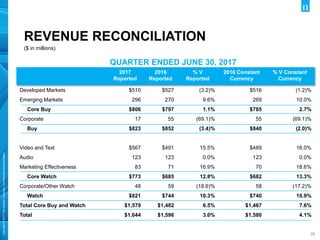
- Total revenue grew 3.0% year-over-year to $1.644 billion. Net income increased 15.9% to $131 million.
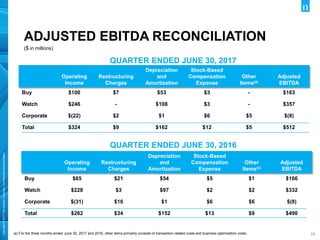
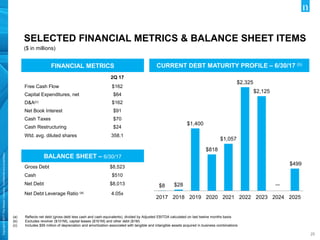
- On a non-GAAP basis, core revenue grew 7.6% to $1.579 billion and adjusted EBITDA increased 4.9% to $512 million.
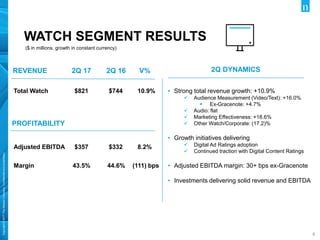
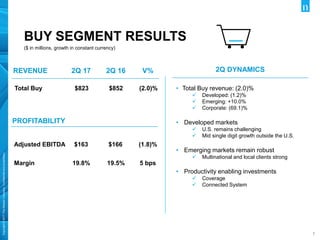
- The Watch segment saw strong 10.9% revenue growth, driven by growth in audience measurement and marketing effectiveness. The Buy segment declined 1.8% due to challenges in the US market, though emerging markets grew 10%.