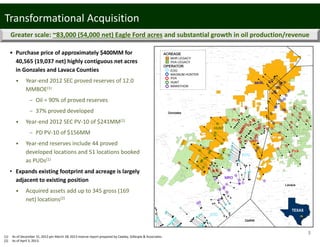
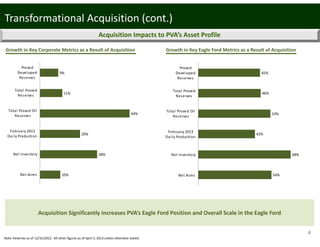
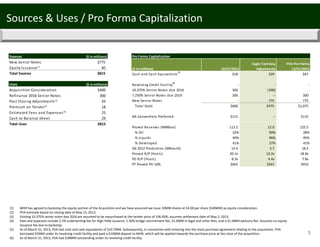
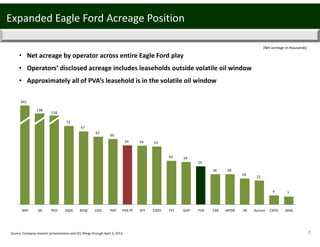
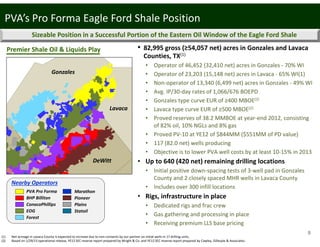
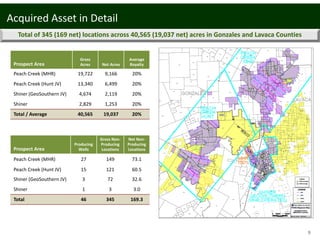
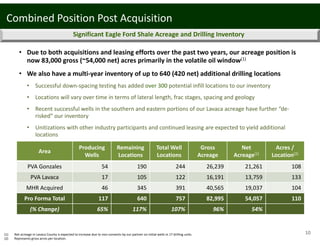
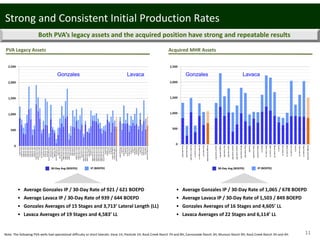
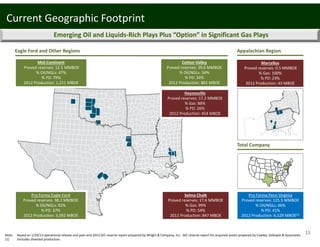
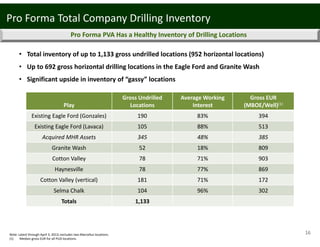
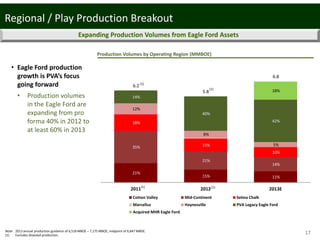
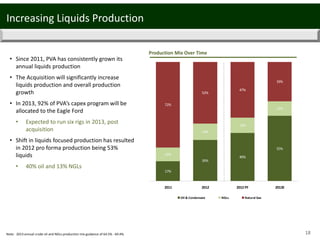
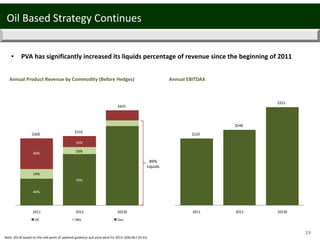
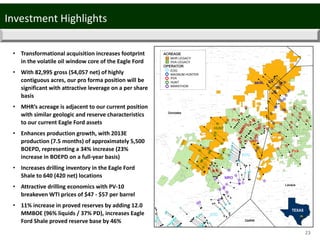
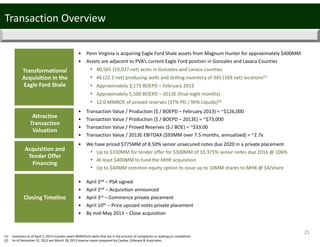
2. 1
Forward‐Looking Statements, Oil and Gas Reserves and Definitions
Forward‐Looking Statements
Certain statements contained herein that are not descriptions of historical facts are “forward‐looking” statements within the meaning of Section 27A of the Securities
Act of 1933, as amended, and Section 21E of the Securities Exchange Act of 1934, as amended. Because such statements include risks, uncertainties and contingencies,
actual results may differ materially from those expressed or implied by such forward‐looking statements. These risks, uncertainties and contingencies include, but are
not limited to, the following: our ability to successfully complete the acquisition of Eagle Ford Hunter, Inc. (“MHR”), as described herein, integrate the business of MHR
with ours and realize the anticipated benefits from the acquisition; any unexpected costs or delays in connection with the acquisition of MHR; the volatility of
commodity prices for oil, natural gas liquids and natural gas; our ability to develop, explore for, acquire and replace oil and gas reserves and sustain production; our
ability to generate profits or achieve targeted reserves in our development and exploratory drilling and well operations; any impairments, write‐downs or write‐offs of
our reserves or assets; the projected demand for and supply of oil, natural gas liquids and natural gas; reductions in the borrowing base under our revolving credit
facility; our ability to contract for drilling rigs, supplies and services at reasonable costs; our ability to obtain adequate pipeline transportation capacity for our oil and
gas production at reasonable cost and to sell the production at, or at reasonable discounts to, market prices; the uncertainties inherent in projecting future rates of
production for our wells and the extent to which actual production differs from estimated proved oil and gas reserves; drilling and operating risks; our ability to
compete effectively against other independent and major oil and natural gas companies; our ability to successfully monetize select assets and repay our debt; leasehold
terms expiring before production can be established; environmental liabilities that are not covered by an effective indemnity or insurance; the timing of receipt of
necessary regulatory permits; the effect of commodity and financial derivative arrangements; our ability to maintain adequate financial liquidity and to access
adequate levels of capital on reasonable terms; the occurrence of unusual weather or operating conditions, including force majeure events; our ability to retain or
attract senior management and key technical employees; counterparty risk related to their ability to meet their future obligations; changes in governmental
regulations or enforcement practices, especially with respect to environmental, health and safety matters; uncertainties relating to general domestic and international
economic and political conditions; and other risks set forth in our filings with the Securities and Exchange Commission (SEC).
Additional information concerning these and other factors can be found in our press releases and public periodic filings with the SEC. Many of the factors that will
determine our future results are beyond the ability of management to control or predict. Readers should not place undue reliance on forward‐looking statements,
which reflect management’s views only as of the date hereof. We undertake no obligation to revise or update any forward‐looking statements, or to make any other
forward‐looking statements, whether as a result of new information, future events or otherwise.
Oil and Gas Reserves
Effective January 1, 2010, the SEC permits oil and gas companies, in their filings with the SEC, to disclose not only “proved” reserves, but also “probable” reserves and
“possible” reserves. As noted above, statements of reserves are only estimates and may not correspond to the ultimate quantities of oil and gas recovered. Any
reserve estimates provided in this presentation that are not specifically designated as being estimates of proved reserves may include estimated reserves not
necessarily calculated in accordance with, or contemplated by, the SEC’s latest reserve reporting guidelines. Investors are urged to consider closely the disclosure in
PVA’s Annual Report on Form 10‐K for the fiscal year ended December 31, 2012, which is available from PVA at Four Radnor Corporate Center, Suite 200, Radnor, PA
19087 (Attn: Investor Relations). You can also obtain this report from the SEC by calling 1‐800‐SEC‐0330 or from the SEC’s website at www.sec.gov.
Definitions
Proved reserves are those quantities of oil and gas which, by analysis of geosciences and engineering data, can be estimated with reasonable certainty to be
economically producible from a given date forward, from known reservoirs, and under existing economic conditions, operating methods and government regulation
before the time at which contracts providing the right to operate expire, unless evidence indicates that renewal is reasonably certain, regardless of whether the
estimate is a deterministic estimate or probabilistic estimate. Probable reserves are those additional reserves that are less certain to be recovered than proved
reserves, but which are as likely than not to be recoverable (there should be at least a 50% probability that the quantities actually recovered will equal or exceed the
proved plus probable reserve estimates). Possible reserves are those additional reserves that are less certain to be recoverable than probable reserves (there should be
at least a 10% probability that the total quantities actually recovered will equal or exceed the proved plus probable plus possible reserve estimates). “3P” reserves refer
to the sum of proved, probable and possible reserves. Estimated ultimate recovery (EUR) is the sum of reserves remaining as of a given date and cumulative production
as of that date. EUR is a measure that by its nature is more speculative than estimates of reserves prepared in accordance with SEC definitions and guidelines and
accordingly is less certain.
3. 2
Financial and Operational Summary
Penn Virginia Corporation Overview
Company Overview
Financial Summary
Common Equity Market Capitalization (4/2/2013)(3)
Convertible Preferred(4)
Equity Market Capitalization
$263MM
$115MM
$378MM
Operational Summary
Pro Forma Production(5)
2012 Q4 Average Daily Prod. (MBOEPD) 18.2
February 2013 Production (MBOEPD) 19.5
Pro Forma Proved Reserves (MMBOE) 125.5
% Liquids 46%
% Proved Developed 41%
• Domestic onshore E&P company with Eagle Ford focus
• The past two years have been transformational, with
portfolio transitioning to oil and liquids
• Discontinued any material gas drilling
• HBP natural gas reserves in East Texas, the Mid‐Continent
and Mississippi
• Executing a strategy of growth in oil and NGL rich plays
• Successful drilling results in the Eagle Ford Shale – 117 wells
on‐line (71 legacy PVA and 46 legacy MHR)(1)
• Adding to Eagle Ford drilling inventory
– Successful exploratory results in Lavaca County
– Approximately 640 (420 net) drilling locations remaining
currently(1)
• Strategy has resulted in significant growth in EBITDAX and
cash operating margins
• Focused on improving liquidity
• Cash plus revolver availability of $316MM at YE12 ($321MM
pro forma(2))
• Leverage ratio (net) of 2.3x at YE12 (3.3x pro forma)
• Over 69% of 2013 oil production (PVA stand‐alone) hedged
at weighted average price of $96.67 per barrel (WTI)
• Over 68% of 2013 gas production (PVA stand‐alone) hedged
at weighted average price of $3.77 per MMBtu (HH)
(1) Pro forma for the MHR acquisition as of April 3, 2013 (the “Acquisition”).
(2) Current borrowing base of $300MM will be adjusted to $276.3MM at closing of the Acquisition, pending borrowing base redetermination. Pro forma availability assumes no borrowings under the
revolver and $2.1MM in letters of credit outstanding as of December 31, 2012. Liquidity assumes $46.8MM of pro forma cash and cash equivalents as of December 31, 2012.
(3) Reflects share price of $4.41 as of April 11, 2013; includes new common equity issuance in the amount of $40MM.
(4) Net issue proceeds of convertible preferred at 6%.
(5) Figure is pro forma for asset sales and acquisitions.
4. 3
• Purchase price of approximately $400MM for
40,565 (19,037 net) highly contiguous net acres
in Gonzales and Lavaca Counties
• Year‐end 2012 SEC proved reserves of 12.0
MMBOE(1)
– Oil = 90% of proved reserves
– 37% proved developed
• Year‐end 2012 SEC PV‐10 of $241MM(1)
– PD PV‐10 of $156MM
• Year‐end reserves include 44 proved
developed locations and 51 locations booked
as PUDs(1)
• Expands existing footprint and acreage is largely
adjacent to existing position
• Acquired assets add up to 345 gross (169
net) locations(2)
Greater scale: ~83,000 (54,000 net) Eagle Ford acres and substantial growth in oil production/revenue
Transformational Acquisition
MRO
MHR
PVA
HUNT
EOG
EOG
PVA
Gonzales
Lavaca
DeWitt
ACREAGE
MHR LEGACY
PVA LEGACY
OPERATOR
EOG
MAGNUM HUNTER
PVA
HUNT
MARATHON
(1) As of December 31, 2012 per March 28, 2013 reserve report prepared by Cawley, Gillespie & Associates.
(2) As of April 3, 2013.
6. 5
Sources & Uses / Pro Forma Capitalization
(1) MHR has agreed to backstop the equity portion of the Acquisition and we have assumed we issue 10MM shares at $4.00 per share ($40MM) as equity consideration.
(2) PVA estimate based on closing date of May 15, 2013.
(3) Existing 10.375% senior notes due 2016 are assumed to be repurchased at the tender price of 106.00%; assumes settlement date of May 2, 2013.
(4) Fees and expenses include 2.5% underwriting fee for High Yield issuance, 1.50% bridge commitment fee, $1.0MM in legal and other fees, and a $1.0MM advisory fee. Assumes no equity
issuance fee due to backstop.
(5) As of March 31, 2013, PVA had cash and cash equivalents of $10.7MM. Subsequently, in connection with entering into the stock purchase agreement relating to the acquisition, PVA
borrowed $5MM under its revolving credit facility and paid a $10MM deposit to MHR, which will be applied towards the purchase price at the close of the acquisition.
(6) As of March 31, 2013, PVA had $38MM outstanding under its revolving credit facility.
Sources ($ in millions)
New Senior Notes $775
Equity Issuance(1)
40
Total Sources $815
Uses ($ in millions)
Acquisition Consideration $400
Refinance 2016 Senior Notes 300
Post Closing Adjustments(2)
43
Premium on Tender(3)
18
Estimated Fees and Expenses(4)
25
Cash to Balance Sheet 29
Total Uses $815
Pro Forma Capitalization
($ in millions) 12/31/2012
Eagle Ford Acq.
Adjustments
PVA Pro Forma
12/31/2012
Cash and Cash Equivalents
(5)
$18 $29 $47
Revolving Credit Facility
(6)
‐ ‐ ‐
10.375% Senior Notes due 2016 300 (300) ‐
7.250% Senior Notes due 2019 300 ‐‐ 300
New Senior Notes ‐ 775 775
Total Debt $600 $1,075
6% Convertible Preferred $115 ‐‐ $115
Proved Reserves (MMBoe) 113.5 12.0 125.5
% Oil 22% 90% 28%
% Liquids 40% 96% 45%
% Developed 41% 37% 41%
Q4 2012 Production (MBoe/d) 15.4 2.7 18.2
Proved R/P (Years) 20.1x 12.2x 18.9x
PD R/P (Years) 8.3x 4.4x 7.8x
PT Proved PV‐10% $692 $241 $933
$475
8. 7
Expanded Eagle Ford Acreage Position
72
67
62
60
54 54 53
40 39
35
28 28
24
22
9 7
0
10
20
30
40
50
60
70
80
90
BHP SN PXD ZAZA ROSE COG PXP PVA PF SFY CRZO FST GDP PVA CRK MTDR HK Aurora CXPO AXAS
Source: Company investor presentations and SEC filings through April 3, 2013.
341
138
118
(Net acreage in thousands)
• Net acreage by operator across entire Eagle Ford play
• Operators’ disclosed acreage includes leaseholds outside volatile oil window
• Approximately all of PVA’s leasehold is in the volatile oil window
9. • 82,995 gross (≥54,057 net) acres in Gonzales and Lavaca
Counties, TX(1)
• Operator of 46,452 (32,410 net) acres in Gonzales ‐ 70% WI
• Operator of 23,203 (15,148 net) acres in Lavaca ‐ 65% WI(1)
• Non‐operator of 13,340 (6,499 net) acres in Gonzales ‐ 49% WI
• Avg. IP/30‐day rates of 1,066/676 BOEPD
• Gonzales type curve EUR of ≥400 MBOE(2)
• Lavaca type curve EUR of ≥500 MBOE(2)
• Proved reserves of 38.2 MMBOE at year‐end 2012, consisting
of 82% oil, 10% NGLs and 8% gas
• Proved PV‐10 at YE12 of $844MM ($551MM of PD value)
• 117 (82.0 net) wells producing
• Objective is to lower PVA well costs by at least 10‐15% in 2013
• Up to 640 (420 net) remaining drilling locations
• Initial positive down‐spacing tests of 3‐well pad in Gonzales
County and 2 closely spaced MHR wells in Lavaca County
• Includes over 300 infill locations
• Rigs, infrastructure in place
• Dedicated rigs and frac crew
• Gas gathering and processing in place
• Receiving premium LLS base pricing
(1) Net acreage in Lavaca County is expected to increase due to non‐consents by our partner on initial wells in 17 drilling units.
(2) Based on 1/29/13 operational release, YE12 SEC reserve report prepared by Wright & Co. and YE12 SEC reserve report prepared by Cawley, Gillespie & Associates.
Premier Shale Oil & Liquids Play
Sizeable Position in a Successful Portion of the Eastern Oil Window of the Eagle Ford Shale
PVA’s Pro Forma Eagle Ford Shale Position
Gonzales
Lavaca
DeWitt
PVA Pro Forma
BHP Billiton
ConocoPhillips
EOG
Forest
Nearby Operators
Marathon
Pioneer
Plains
Statoil
8
10. 9
Prospect Area
Gross
Acres Net Acres
Average
Royalty
Peach Creek (MHR) 19,722 9,166 20%
Peach Creek (Hunt JV) 13,340 6,499 20%
Shiner (GeoSouthern JV) 4,674 2,119 20%
Shiner 2,829 1,253 20%
Total / Average 40,565 19,037 20%
Prospect Area
Producing
Wells
Gross Non‐
Producing
Locations
Net Non‐
Producing
Locations
Peach Creek (MHR) 27 149 73.1
Peach Creek (Hunt JV) 15 121 60.5
Shiner (GeoSouthern JV) 3 72 32.6
Shiner 1 3 3.0
Total 46 345 169.3
Total of 345 (169 net) locations across 40,565 (19,037 net) acres in Gonzales and Lavaca Counties
Acquired Asset in Detail
11. Significant Eagle Ford Shale Acreage and Drilling Inventory
Area
Producing
Wells
Remaining
Locations
Total Well
Locations
Gross
Acreage
Net
Acreage(1)
Acres /
Location(2)
PVA Gonzales 54 190 244 26,239 21,261 108
PVA Lavaca 17 105 122 16,191 13,759 133
MHR Acquired 46 345 391 40,565 19,037 104
Pro Forma Total 117 640 757 82,995 54,057 110
(% Change) 65% 117% 107% 96% 54%
(1) Net acreage in Lavaca County is expected to increase due to non‐consents by our partner on initial wells in 17 drilling units.
(2) Represents gross acres per location.
Combined Position Post Acquisition
• Due to both acquisitions and leasing efforts over the past two years, our acreage position is
now 83,000 gross (~54,000 net) acres primarily in the volatile oil window(1)
• We also have a multi‐year inventory of up to 640 (420 net) additional drilling locations
• Successful down‐spacing testing has added over 300 potential infill locations to our inventory
• Locations will vary over time in terms of lateral length, frac stages, spacing and geology
• Recent successful wells in the southern and eastern portions of our Lavaca acreage have further “de‐
risked” our inventory
• Unitizations with other industry participants and continued leasing are expected to yield additional
locations
10
13. 12
LAVACA COUNTY
Pretax Rate of Return Sensitivities
0
10
20
30
40
50
60
70
80
90
100
40 50 60 70 80 90 100 110 120
WTI Oil Price (Flat) - $/Bbl
RateofReturnBFIT-%
Base Case EUR = 590MBOE (8/8ths)
Capex = $10.1MM (8/8ths) LLS Pricing
Base Case EUR = 590MBOE (8/8ths)
Capex = $10.1MM (8/8ths) WTI Pricing
Sensitivity Case EUR = 590MBOE (8/8ths)
Capex = $9.1MM (8/8ths) LLS Pricing
Sensitivity Case EUR = 590MBOE (8/8ths)
Capex = $9.1MM (8/8ths) WTI Pricing
$4.00/MMBtu Flat Gas Price
GONZALES COUNTY
Pretax Rate of Return Sensitivities
0
10
20
30
40
50
60
70
80
90
100
40 50 60 70 80 90 100 110 120
WTI Oil Price (Flat) - $/Bbl
RateofReturnBFIT-%
Base Case EUR = 460MBOE (8/8ths)
Capex = $9.1MM (8/8ths) LLS Pricing
Base Case EUR = 460MBOE (8/8ths)
Capex = $9.1MM (8/8ths) WTI Pricing
Sensitivity Case EUR = 460MBOE (8/8ths)
Capex = $8.1MM (8/8ths) LLS Pricing
Sensitivity Case EUR = 460MBOE (8/8ths)
Capex = $8.1MM (8/8ths) WTI Pricing
$4.00/MMBtu Flat Gas Price
Gonzales County(1) Lavaca County(1)
• Assumptions
• Longer lateral lengths in 2013 vs. PUD assumption
• 590 MBOE EUR type curve
• Drilling and completion (D&C) costs per below
• Assumptions
• Longer lateral lengths in 2013 vs. PUD assumption
• 460 MBOE EUR type curve
• Drilling and completion (D&C) costs per below
Attractive Economics in Volatile Oil Window
Compelling Economics & Value at Varying Oil Prices
Key Takeaways
D&C of
$9.1MM
D&C of
$8.1MM
IRR 40 – 52% 52 – 76%
BTAX PV‐10(2) ($MM) $5.6 – 7.4 $6.6 – 8.4
Breakeven(3) ($/BOE) $47 – 57 $41 – 52
(1) Based on YE12 PUDs, excluding short‐length lateral wells, applied to longer length laterals in 2013 program.
(2) Assuming a flat $90 per barrel WTI oil price.
(3) Before tax PV‐10 breakeven WTI oil price.
Key Takeaways
D&C of
$10.1MM
D&C of
$9.1MM
IRR 37 – 52% 50 – 71%
BTAX PV‐10(2) ($MM) $6.1 – 8.2 $7.1 – 9.2
Breakeven(3) ($/BOE) $47 – 57 $42 – 52
14. 13
2013 Capital Spending Focused on Eagle Ford Drilling
• Full‐year 2013 capital expenditures expected to be approximately $457MM(1)
• Four operated rigs with two on existing PVA acreage and two rigs on operated MHR acreage
• Two non‐operated rigs
• Incremental capital spending of approximately $77MM(1)
• Six‐rig drilling program (currently seven rigs running between PVA, MHR and Hunt)
• Adjusted EBITDAX expected to increase to between $295 and $350MM, or 25% over previous guidance
• 2013 capital spending is expected to be 92% Eagle Ford
• Maintenance and new ventures capital for other areas
Pro Forma Capital Expenditures by Area(1) Pro Forma Capital Expenditures by Type(1)
Other
4%
Eagle Ford D&C
87%
Other D&C
4%
Land
5%
Revised 2013 Capital Plan
(1) Change in mid‐points of full‐year 2013 guidance, adjusted for acquired Eagle Ford assets.
Other
3%
Pearsall
2%
Existing Eagle
Ford
64%
Acquired Eagle
Ford Assets
28%
Mid‐Continent
3%
15. 11.2
2.3
8.5
$0
$5
$10
2011 2012 PF 2013E
88%
86%
86%
8%
7%
6%
7%
14
• During 2011 and into early 2012, we quickly ramped up Eagle Ford Shale production, and
expect to increase production once again during 2013
• Approximately 94% of sales volumes are liquids ‐ primarily crude oil
• Oil is sold into Gulf Coast LLS market through multiple purchasers at premium pricing to WTI
Positive Production Trend
Pre Acquisition Eagle Ford Production (MBOEPD)
Acquisition’s Effect on Production Volumes and Mix
Oil and Condensate NGLs Natural Gas
Post Acquisition Eagle Ford Production (MBOEPD)
2.3
6.4
7.9
$0
$5
$10
2011 2012 2013E
88%
84%
85%
9%
8%
7%
8%
21. 20
$1.98
$2.18
$1.95
$5.28
$5.11
$4.58
$6.12
$38.70
$47.67
$52.62
$62.02
$45.25
$38.96
$33.95
$24.96
$4.85
$5.13
$4.80
$4.74
$1.55
$4.25
$2.00
$1.63
$1.74
$0
$10
$20
$30
$40
$50
$60
$70
2011 2012 2012 PF 2013E
Cash Margin LOE
G&P and transportation Production taxes
Cash G&A (excludes share‐based compensation)
Unhedged Cash Margin Over Time ($/BOE)
Note: Cash margin ($ / BOE) is defined as total product revenues, excluding the impact of hedges, less direct operating expenses per unit of equivalent production.
Assumed price deck for 2013: ($90.96 / $3.51).
Realized
Price
Cash
Margin
Operating Margins
• PVA has consistently increased
cash margin since 2011 through:
• Investment in higher rate‐of‐
return oil projects
• Advantaged LLS pricing
• Decreasing per unit operating
costs
• The Acquisition is expected to
further expand cash margins
22. 21
Quarterly Adjusted EBITDAX and EBITDAX Margin ($ / BOE)
$48.41
$45.88
$43.72
$40.61
$39.10
$36.48
$26.37
$25.01 $24.54
$22.95
$19.79
$13.56
PVA
PF
GDP PVA CWEI CRZO FST PDCE BBG CRK Antero XCO KWK
Comparative Q4 2012 EBITDAX Margins ($ / BOE)(2)
• EBITDAX has increased significantly since mid‐2010 when we shifted our strategy to oil and NGLs
• Cash margin per BOE has also improved significantly due to the increase in oil prices and
declining operating costs per unit
• Eagle Ford cash margin was $79.00 / BOE in 4Q12(1)
Source: Company filings.
(1) Excludes regional and corporate G&A expenses.
(2) PVA 4Q2012 EBITDAX of $62.3MM per its earnings release. EBITDAX for peers calculated as total revenues less lease operating expenses, production taxes and cash G&A unless otherwise
disclosed. Inclusive of realized hedge gains or losses.
(3) Pro forma for the Acquisition.
Strong Margins vs. Peers
$49
$33
$46 $45 $44
$48
$66
$62
$64
$61
$60
$62
$20.73
$20.76
$21.72
$24.38
$33.01
$34.77
$35.44
$34.51
$28.50
$18.91
$43.72
$39.73
$0
$70
1Q10 2Q10 3Q10 4Q10 1Q11 2Q11 3Q11 4Q11 1Q12 2Q12 3Q12 4Q12
(3)
23. • Maintain an active hedging program to help support capital spending program and ensure strong
coverage metrics
• Hedges in place to protect cash flow
• Natural gas hedging is currently 68% of expected 2013 total volumes at an average floor price of $3.77 / Mcf
• Oil hedging is currently 69% of expected 2013 total volumes at an average floor price of $96.67 / barrel
– 35% hedged for 2014 (stand‐alone) of total volumes at $94.87 / barrel
• Upon closing the acquisition we will enter into additional hedges and expect the overall percent
of production hedged to closely resemble our current levels
$3.76 $3.75 $3.75 $3.82
$4.02
$4.03 $4.03
$4.16 $4.07 $4.07
$4.24 $4.27
$4.03
$0
$1
$2
$3
$4
$5
$6
0
5
10
15
20
25
30
1Q13 2Q13 3Q13 4Q13 1Q14 2Q14 3Q14
MMBtu per Day (000s)
Weighted Avg. Floors and Swaps ($/MMBtu)
Weighted Average Floor /
Swap Price by Quarter
Weighted Average Ceiling /
Swap Price by Quarter
$98
$97
$96 $96
$95
$94 $94
$102
$101
$99 $99
$95
$75
$80
$85
$90
$95
$100
$105
$110
0
1,000
2,000
3,000
4,000
5,000
6,000
7,000
1Q13 2Q13 3Q13 4Q13 1Q14 2Q14 3Q14 4Q14
Barrels per Day
Weighted Avg. Floors and Swaps ($/Bbl)
Weighted Average Floor /
Swap Price by Quarter
Weighted Average Ceiling /
Swap Price by Quarter
22
Crude Oil Hedges (Swaps and Collars)(1)
(1) As of 3/25/13.
Hedging Strategy
Protect Cash Flow
Natural Gas Hedges (Swaps and Collars)(1)
26. Transformational
Acquisition in the
Eagle Ford Shale
• Penn Virginia is acquiring Eagle Ford Shale assets from Magnum Hunter for approximately $400MM
• Assets are adjacent to PVA’s current Eagle Ford position in Gonzales and Lavaca Counties
• 40,565 (19,037 net) acres in Gonzales and Lavaca counties
• 46 (22.1 net) producing wells and drilling inventory of 345 (169 net) locations(1)
• Approximately 3,173 BOEPD – February 2013
• Approximately 5,500 BOEPD – 2013E (final eight months)
• 12.0 MMBOE of proved reserves (37% PD / 96% Liquids)(2)
Attractive
Transaction
Valuation
• Transaction Value / Production ($ / BOEPD – February 2013) = ~$126,000
• Transaction Value / Production ($ / BOEPD – 2013E) = ~$73,000
• Transaction Value / Proved Reserves ($ / BOE) = ~$33.00
• Transaction Value / 2013E EBITDAX ($93MM over 7.5 months, annualized) = ~2.7x
Acquisition and
Tender Offer
Financing
• We have priced $775MM of 8.50% senior unsecured notes due 2020 in a private placement
• Up to $330MM for tender offer for $300MM of 10.375% senior notes due 2016 @ 106%
• At least $400MM to fund the MHR acquisition
• Up to $40MM common equity option to issue up to 10MM shares to MHR @ $4/share
Closing Timeline
• April 2nd – PSA signed
• April 2nd – Acquisition announced
• April 3rd – Commence private placement
• April 10th – Price upsized notes private placement
• By mid‐May 2013 – Close acquisition
Transaction Overview
(1) Inventory as of April 3, 2013 includes seven MHR/Hunt wells that are in the process of completion or waiting on completion.
(2) As of December 31, 2012 per March 28, 2013 reserve report prepared by Cawley, Gillespie & Associates.
25
28. 27
Revised for Proposed MHR Acquisition Assuming 5/15/13 Closing Date
Full‐Year 2013 Guidance Table
Production:
Crude oil (MBbls) 2,775 ‐ 3,075 760 ‐ 890 3,535 ‐ 3,965
NGLs (MBbls) 730 ‐ 820 55 ‐ 75 785 ‐ 895
Natural gas (MMcf) 13,000 ‐ 13,650 190 ‐ 240 13,190 ‐ 13,890
Equivalent production (MBOE) 5,672 ‐ 6,170 847 ‐ 1,005 6,518 ‐ 7,175
Equivalent daily production (BOEPD) 15,539 ‐ 16,904 3,681 ‐ 4,370 17,858 ‐ 19,658
Percent crude oil and NGLs 59.9% ‐ 64.9% 95.3% ‐ 96.8% 64.5% ‐ 69.4%
Production revenues (a):
Crude oil $265.0 ‐ $293.5 $70.0 ‐ $80.0 $335.0 ‐ $373.5
NGLs 21.5 ‐ 24.5 1.5 ‐ 2.0 23.0 ‐ 26.5
Natural gas 43.5 ‐ 45.5 1.0 ‐ 1.5 44.5 ‐ 47.0
Total product revenues $330.0 ‐ $363.5 $72.5 ‐ $83.5 $402.5 ‐ $447.0
Total product revenues ($ per BOE) $58.18 ‐ $58.91 $85.63 ‐ $83.08 $61.75 ‐ $62.30
Percent crude oil and NGLs 86.2% ‐ 88.0% 97.9% ‐ 98.8% 88.3% ‐ 90.0%
Operating expenses:
Lease operating ($ per BOE) $4.60 ‐ $5.00 $4.65 ‐ $5.05
Gathering, processing and trans. costs ($ per BOE) $1.70 ‐ $1.90 $1.45 ‐ $1.65
Production and ad valorem taxes (% of oil and gas revenues) 6.3% ‐ 6.9% 6.6% ‐ 7.1%
General and administrative:
Recurring general and administrative $39.5 ‐ $40.5 $1.8 ‐ $2.0 $41.3 ‐ $42.5
Share‐based compensation 3.0 ‐ 4.0 0.2 ‐ 0.3 3.2 ‐ 4.3
Restructuring 2.5 ‐ 2.7 2.5 ‐ 2.7
Total reported G&A $42.5 ‐ $44.5 $4.5 ‐ $5.0 $47.0 ‐ $49.5
Exploration:
Total reported exploration $28.0 ‐ $30.0 $18.0 ‐ $22.0 $46.0 ‐ $52.0
Unproved property amortization 21.0 ‐ 22.0 21.0 ‐ 24.0 42.0 ‐ 46.0
Depreciation, depletion and amortization ($ per BOE) $36.00 ‐ $39.00 $36.00 ‐ $39.00
Adjusted EBITDAX (b) $234.5 ‐ $280.0 $60.0 ‐ $70.0 $294.5 ‐ $350.0
Capital expenditures:
Drilling and completion $310.0 ‐ $345.0 $80.0 ‐ $85.0 $390.0 ‐ $430.0
Pipeline, gathering, facilities 17.0 ‐ 18.0 (2.5) ‐ (2.0) 14.5 ‐ 16.0
Seismic (c) 5.0 ‐ 7.0 (2.5) ‐ (2.0) 2.5 ‐ 5.0
Lease acquisitions, field projects and other 28.0 ‐ 30.0 (3.0) ‐ 1.0 25.0 ‐ 31.0
Total oil and gas capital expenditures $360.0 ‐ $400.0 $72.0 ‐ $82.0 $432.0 ‐ $482.0
Pro Forma
2013 Guidance
Current Full‐Year
2013 Guidance
Adjustments for MHR
Acquisition / One Less Rig
(a) Assumes average benchmark prices of $90.96 per barrel for crude oil and $3.51 per MMBtu for natural gas, prior to any premium or discount for quality, basin differentials, the impact of hedges
and other adjustments. NGL realized pricing is assumed to be $29.38 per barrel.
(b) Adjusted EBITDAX is not a measure of financial performance under GAAP and should not be considered as a measure of liquidity or as an alternative to net income.
(c) Seismic expenditures are also reported as a component of exploration expense and as a component of net cash provided by operating activities .
29. 79%
76%
73% 72%
68%
61%
49% 47%
38%
9%
5%
1%
86%87%
0
0
0
0
0
1
1
1
1
1
CWEI Aurora PVA
PF
CRZO PVA SFY GDP PDCE CRK FST BBG XCO KWK Antero
4Q 2012 Oil Production Mix
28
4Q 2012 Unhedged Oil Revenue (% of Revenue)
Production and Revenue Metrics
Source: Public filings and investors presentations. Penn Virginia pro forma for the Acquisition.
4Q 2012 Cash Margin (Unhedged)4Q 2012 Average Realized Price (Unhedged)
$66.94
$59.14
$53.49
$50.85
$45.19
$43.41
$36.06 $36.05
$32.65
$30.03
$22.23 $21.91 $20.78
$72.37
0
20
40
60
80
Aurora CWEI PVA
PF
PVA SFY CRZO GDP PDCE BBG FST CRK Antero KWK XCO
65%
47%
39%
36% 35%
30%
27%
18%
17% 16%
2% 1% 0%
68%
0
0
0
0
0
1
1
1
CWEI Aurora PVA
PF
PVA SFY CRZO GDP PDCE BBG FST CRK XCO KWK Antero
16.39
$72.37
$66.94
$59.14
$53.49
$50.86
$45.19
$43.41
$36.06 $36.05
$32.65
$30.03
$22.23 $21.91 $20.78
8.37
8.26
5.82
34.50
39.30
$ 0
$ 10
$ 20
$ 30
$ 40
$ 50
$ 60
$ 70
$ 80
Aurora CWEI PVA
PF
PVA SFY CRZO GDP PDCE BBG FST CRK Antero KWK XCO
Cash M argin
Cash G&A
Total Production Expenses
30. 1‐Year F&D Costs, Drill‐bit ($ / BOE)(1)
29
3‐Year F&D Costs, Drill‐bit ($ / BOE)(2)
542%
428%
374%
281%
194%
161%
140%
101%
54%
37%
0%
150%
300%
450%
600%
Antero PDCE CRZO CWEI SFY PVA FST BBG CRK GDP XCO KWK
2243% 1226%
2012 Reserve Replacement, Total(3)
Operational and Reserve Metrics
$25.96
$19.37 $19.30 $18.63
$14.92
$13.85
$11.36 $11.34 $10.91 $10.71
$5.21
$1.73
$0
$5
$10
$15
$20
$25
CRZO GDP BBG PVA CWEI FST CRK SFY XCO KWK PDCE Antero
Note: CRZO metrics represent U.S. assets only.
(1) 1‐Year F&D costs calculated by dividing the sum of 2012 exploration, production and development costs by the sum of extensions, discoveries and improved recovery of proved reserves.
(2) 3‐Year F&D costs calculated by dividing the sum of exploration, production and development costs by the sum of extensions, discoveries and improved recovery of proved reserves over the
period from 2010 to 2012.
(3) Reserve replacement calculated by taking the sum of purchases, extensions, discoveries and improved recovery of proved reserves by annual production.
(4) Pro forma for all recently announced transactions, including with respect to PVA, the Acquisition.
2012 Proved Reserves (MMBOE)(4)
192.1
183.4 181.8 178.7 174.0
125.5
118.0 115.1
91.8
75.4
55.5
0
20
40
60
80
100
120
140
160
180
200
Antero SFY KWK FST PDCE BBG PVA PF XCO CRZO CRK CWEI GDP
821.7
$43.34 $43.25
$34.14
$26.37 $25.47
$23.13
$19.53
$17.65 $17.08
$15.30
$3.74 $2.61
$0
$10
$20
$30
$40
KWK GDP CRZO XCO BBG CRK PVA CWEI FST SFY PDCE Antero
31. 30
Non‐GAAP Reconciliation
2008 2009 2010 2011 2012
Adjusted EBITDAX
Net income (loss) from continuing operations $ 93.6 $ (130.9) $ (65.3) $ (132.9) $ (104.6)
Add: Income tax expense (benefit) 55.6 (85.9) (42.9) (88.2) (68.7)
Add: Interest expense 24.6 44.2 53.7 56.2 59.3
Add: Depreciation, depletion and amortization 135.7 154.4 134.7 162.5 206.3
Add: Exploration 42.4 57.8 49.6 78.9 34.1
Add: Share‐based compensation expense 6.0 9.1 7.8 7.4 6.3
Add/Less: Derivatives (income) expense included in net income (29.7) (31.6) (41.9) (15.7) (36.2)
Add/Less: Cash receipts (payments) to settle derivatives (7.6) 58.1 32.8 27.4 29.7
Add/Less: Loss on firm transportation commitment ‐ ‐ ‐ ‐ 17.3
Add: Impairments 20.0 106.4 46.0 104.7 104.5
Add/Less: Net loss (gain) on sale of assets, other (33.2) (2.0) (1.2) 22.0 (0.6)
Adjusted EBITDAX $ 307.4 $ 179.7 $ 173.3 $ 222.5 $ 247.6
dollars in millions
Year ended December 31,