SlideShare a Scribd company logo
December 2014
1 www.hedgespa.com
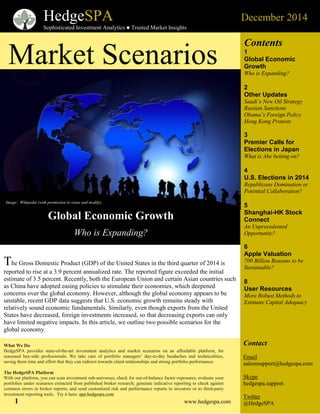
The Gross Domestic Product (GDP) of the United States in the third quarter of 2014 is
reported to rise at a 3.9 percent annualized rate. The reported figure exceeded the initial
estimate of 3.5 percent. Recently, both the European Union and certain Asian countries such
as China have adopted easing policies to stimulate their economies, which deepened
concerns over the global economy. However, although the global economy appears to be
unstable, recent GDP data suggests that U.S. economic growth remains steady with
relatively sound economic fundamentals. Similarly, even though exports from the United
States have decreased, foreign investments increased, so that decreasing exports can only
have limited negative impacts. In this article, we outline two possible scenarios for the
global economy.
What We Do
HedgeSPA provides state-of-the-art investment analytics and market scenarios on an affordable platform, for
seasoned buy-side professionals. We take care of portfolio managers’ day-to-day headaches and technicalities,
saving them time and effort that they can redirect towards client relationships and strong portfolio performance.
The HedgeSPA Platform
With our platform, you can scan investment sub-universes; check for out-of-balance factor exposures; evaluate your
portfolios under scenarios extracted from published broker research; generate indicative reporting to check against
common errors in broker reports; and send customized risk and performance reports to investors or to third-party
investment reporting tools. Try it here: app.hedgespa.com
HedgeSPA December 2014
Sophisticated Investment Analytics  Trusted Market Insights
1 www.hedgespa.com
Contents
1
Global Economic
Growth
Who is Expanding?
2
Other Updates
Saudi’s New Oil Strategy
Russian Sanctions
Obama’s Foreign Policy
Hong Kong Protests
3
Premier Calls for
Elections in Japan
What is Abe betting on?
4
U.S. Elections in 2014
Republicans Domination or
Potential Collaboration?
5
Shanghai-HK Stock
Connect
An Unprecedented
Opportunity?
6
Apple Valuation
700 Billion Reasons to be
Sustainable?
8
User Resources
More Robust Methods to
Estimate Capital Adequacy
Market Scenarios
Global Economic Growth
Who is Expanding?
wi
Contact
Email
salesnsupport@hedgespa.com
Skype
hedgespa.support
Twitter
@HedgeSPA
Image: Wikipedia (with permission to reuse and modify)
December 2014
2 www.hedgespa.com
Other Scenario Updates
The following provides updates on several scenarios we
have discussed in earlier newsletters. We have updated
these scenarios on the HedgeSPA platform to reflect
new information and market development.
Saudi Arabia’s New Oil Strategy (November 2014): On
top of Saudi’s efforts to cut its export oil prices, the
combination of a strong U.S. dollar and increased shale gas
production is contributing to further declines in oil prices.
According to some analysts, crude oil prices may even fall
as much as 40% to $40+ per barrel, despite it being just
over $100 per barrel in September 2014. Nonetheless, it has
also been reported that the Saudis, which produces
approximately 10 million barrels per day against a global
demand of about 92 million barrels per day and are widely
seen as the “swing” producer, are preparing to stabilize oil
at around $60 per barrel. This will have a big effect on not
only the oil market, but also the global economy, which is
heavily dependent on oil for energy.
Russian Sanctions and its Repercussions (November
2014): The recent tumble in oil prices has huge
implications for Russia, who is already in a bad situation
due to economic sanctions imposed by countries such as the
European Union, the United States, and Japan. Since
Russia is the world’s largest oil producing country, as well
as the world’s second largest oil exporter, tumbling oil
prices mean a depreciating ruble. According to the BBC,
the Russian ruble experienced its largest single-day decline
since 1998, falling as much as 9% against the dollar on
December 1, 2014, which led to concerns on the state of the
Russian economy.
Obama’s Foreign Policies (September 2014): Chuck
Hagel was forced to resign from his position as the US
Secretary of Defense. He was initially hired to manage the
withdrawal of US forces from Iraq. As the ISIS situation
worsened, Hagel failed to articulate a credible response.
Instead, the US response to the ISIS threat was largely seen
as confused and incoherent. Hagel’s resignation was widely
seen as one symptom of deeper problems in Obama’s
foreign policy failures.
Hong Kong Protests and its Embattled Chief Executive
(November 2014): There was an escalation of
confrontation in the Hong Kong protests, with no winning
end game in sight for the student protestors, after resorting
to hunger strike tactics. At the same time, the Chinese
Govn’t views the protests as a situation incited by “foreign
elements” in a city that is still considered its main financial
gateway to the world, thus it is unlikely to give in.
Scenario 1: Global Economy Booms
With the encouraging news, the stock market in the
United States continues to rise. On November 25, 2014,
the Standard & Poor Index rose 5.91, or 0.29%, to close
at 2069.41. The Dow Jones Industrial rose 0.04% to
17817.90; NASDAQ rose 0.24% to 4712.97. Asian stock
markets, with the exception of Hong Kong’s Hang Seng
Index, rose as well. The Nikkei 225 ended up with a
0.29% increase and the Shanghai Composite Index rose
by 1.37%. This trend met the market’s expectation that
the Federal Reserve will raise interest rates in the middle
of next year, potentially driving up the US dollar some
more. Recently, the US federal budget deficit even
dropped to $483 billion, which is only 2.8% of GDP
rather than the historical 3.1%, giving the private sector
and therefore the global economy more room to grow.
Scenario 2: Gold and Certain Currencies are Faring
Worse
In 2014, the U.S. dollar kept rising, crude oil prices fell,
and the Fed announced the end of quantitative easing.
All three of these factors negatively impacted gold
prices, which fell below $1200 USD per ounce. The
Swiss referendum requiring the Swiss Central Bank to
have at least a 20% weight in gold holdings was held on
November 30, 2014. Had the Swiss referendum pass,
gold price would have risen by about $50, but ultimately
the referendum failed to win voter support. Since the
Swiss referendum did not pass, the Swiss government
may need to sell any extra gold holdings that it has
already bought as a precautionary measure, resulting in a
further drop in gold prices. As a result, other financial
products positively correlated to gold will fall as well,
creating uncertainties in the global financial market.
Furthermore, UK GDP data showed a somewhat
unbalanced economic recovery that hurt the British
pound. With the UK election fast approaching, that is
bad news to David Cameron, the UK premier, and his
Conservative Party. Luckily, UK interest rate remained
relatively stable. Aside from the British pound, other
currencies were also under pressure because of the strong
US dollar. AUD/USD fell to 0.8513 and NZD/USD fell
significantly as well. For now, there are few tangible
reasons to be massively enthusiastic about the Australian
economy, which is only one of the many examples for
why we expect to see uneven global economic growth in
2015.
December 2014
3 www.hedgespa.com
Image: Wikipedia (with permission to reuse and modify)
Premier Calls for Elections in Japan
What is Abe betting on?
In the second quarter of 2014, Japan’s GDP declined by 7.1 percent and continued to decline by 1.6
percent in the third quarter, in contrast to earlier predictions. The yen has weakened, and it may be
difficult for Japan to realize its goal of fiscal balance by 2020. In response to this decline, Prime Minister
Shinzo Abe of Japan announced at the cabinet meeting that he is going to dissolve the House of
Representatives on November 21, 2014. This set the stage for the next election on December 14, 2014.
He also declared that Japan’s original plan to increase consumption tax will be postponed from October 1,
2015 to April 1, 2017. Will Abenomics be successful in combating declining GDP in Japan? We shall
look into two scenarios:
Scenario 1: Abenomics is Successful and Japan’s Economy Recovers
Abe’s earlier election slogan was “Now or never.” According to current public opinion poll, the approval
rating of Abe and his cabinet is struggling now at 40 to 50 percent, although the Liberal Democratic Party
still leads in political support. Thus, the snap election may provide Abe a better shot at winning reelection
- chances are high that he can hold onto power till the end of 2018. With Abe in power for the next few
years, his plans to postpone Japan’s consumer tax increase will benefit both Japan’s GDP and its
deflationary economy. On November 21, 2014, its stock market recovered slightly. The Nikkei index
closed 0.3 higher and surged on the news. The Japanese economy now shows signs of a gradual recovery.
Scenario 2: Recession in Japan Continues
According to data provided by Japanese Internal Affairs Ministry, the election alone will cost
approximately 70 billion yen, or $560 million USD. As a result, a large number of voters complained
about such a snap election, with 60 percent of voters against it. On top of its administrative cost, if the
Parliament cannot build consensus after the election, then Japanese economic policy will likely suffer.
Japan’s GDP will further decline, and Abe may be forced to step down eventually. With the increasingly
aging among the Japanese population, Japan’s government needs alternatives to income tax in order to
pay for its debts and benefit obligations. Postponing the increase of consumption tax will bring a further
burden to Japan’s debts. In 2013, Japan’s debt to GDP was 227 percent and it is predicted that, by 2030,
that amount will reach 264 percent. Its 2014 public debt to GDP ratio is the highest in the world,
according to the World Factbook published by the CIA. Consequently, the Japanese economy can enter
yet another double-dip recession.
The parliamentary election seems to be both a political and economic turnabout. If Abenomics does not
work out and Japan’s economy further declines, Japan’s economy will face enormous challenges.
December 2014
4 www.hedgespa.com
Image: Wikipedia (with permission to reuse and modify)
Mid-term elections in the United States took place on November 4, 2014. The results turned out to favor the
Republican Party. The Republicans will take over the Senate in early January next year, following a 7-year
hiatus. The results of this midterm election seem to suggest increasing doubts by the American public over
Obama’s policy agenda and leadership. With Republicans taking over both chambers of the US Congress for
the first time since 2006, President Obama may have to adjust his agenda if he wants Congress to pass his
policies.
Scenario 1: U.S. Politics Becomes More Collaborative
To save his approval rating, Obama began discussing with his Cabinet new ways to improve his public image.
On November 20, 2014, Obama announced that he would take executive actions to grant a temporary reprieve
from extradition for up to 5 million unapproved immigrants living in the United States. Unauthorized
immigrants gain more opportunities to stay in the United States permanently. Furthermore, he made a large
stride towards eco-friendliness when he pushed for a political agreement with China on climate change. Obama
is also pushing for bipartisanship, especially on trade-related issues. For instance, he promoted the Trans-Pacific
Partnership (TPP) and the Transatlantic Trade and Investment Partnership (TTIP), which provides a springboard
for the FTA (Free Trade Agreement) negotiations. Once Obama has the congressional mandate to negotiate
FTAs, U.S. economy will move forward and the global economy will grow. The U.S. is then expected to
become a more collaborative economy and society.
Scenario 2: Republicans Dominate
Based on the analysis provided by the Wall Street Journal, in the third quarter of 2014, the corporate donations
Republicans received exceeded those of the Democrats for the first time in years. Republican candidates
received 58 percent of the donations while Democratic candidates only received 42 percent. Given its current
success, the Republican party has few reasons to cooperate with the Democrats to push for FTA negotiation and
immigration reform. Worse — any attempt to coerce consensus will only aggravate the relationships between
the two parties. Eventually, Obama would lose his approval rating and may have to step back from driving the
US political agenda. With the US Government reducing its role and crowding out effects, the US economy and
therefore its stock market will boom, e.g. the Dow Jones and Standard & Poor’s are expected to surge. On the
contrary, gold prices will drop in response to a stronger US dollar, and may even fall below $1000 per ounce.
US Elections 2014
Republicans Domination or Potential Collaboration?
December 2014
5 www.hedgespa.com
Image: cnbc.com (with permission to reuse and modify)
Starting on November 17, 2014, investors from the Hong Kong Stock Exchange will be able to invest in
Shanghai A shares directly across the Chinese border. China linked the two stock markets to improve liquidity
and to attract more investors. In doing so, the Chinese government allows the RMB to become more widely
circulated. China worked not only to improve liquidity but also to spur growth and to ease debt pressure by
cutting interest rates for the first time in many years. Furthermore, to ensure that Shanghai A shares will
function properly in the global market, the Chinese government also scrapped the daily exchange limit of
20,000 RMB to HKD (and vice versa), and such freer flow of RMB may force its value up. If current trend
continues, this may be the beginning of a seismic shift in global markets. We shall look into two scenarios to
analyze the underlying effects of the linkup and the end of the 20,000 RMB limit.
Scenario 1: A Shares Enter the Global Economy and the Chinese Economy Booms
According to recent data, even though Chinese GDP represents 12.3% of global economy, China’s Shanghai A
shares only represent 10.5% of the global market capitalization. Due to the recent link-up between the Shanghai
and Hong Kong Stock Exchanges, Shanghai A shares will now be able to command a greater global presence
once funding flows from Hong Kong into China. The market immediately reacted to the new policy, with EPS
increasing by 6%. The lifting of the 20,000 RMB daily limit effectively increased investment opportunities and
attracted global investors. Ultimately, the move to link the two stock exchanges and the removal of the 20,000
RMB daily exchange limit promoted the increases in capital liquidity and boosted the Chinese stock market.
Currently, investors in Mainland China tend to focus on real estate investments and cash. Based on data
provided by the Wall Street Journal, mainland investors only put 7% of their wealth in the stock market.
However, since the Shanghai-Hong Kong Stock Connect has demonstrated that the Chinese stock market is
maturing, mainland investors are now more motivated to invest in stocks to diversify their assets. More funding
will flow into the Chinese stock market not only from mainland investors but also from foreign investors, as
non-mainland private investors invest in Chinese stocks and eventually institutional investors as well, since it is
only a matter of time for the MSCI World to include Chinese stocks. Not only is this new policy tool adding to
the Chinese stock market’s stability and maturity, but it is also a tool that can be used for interest rate arbitrage,
eventually driving interest rates in China to be roughly the same as those in the rest of the world on the same
currencies.
Scenario 2: Global Economy Changes
On the first day of the launch of the Shanghai-Hong Kong Connect, mainland investors surprisingly showed
little interest in Hong Kong stocks and only utilized 17% of their limit, despite having the tax exemption
Shanghai-HK Stock Connect
An Unprecedented Opportunity?
December 2014
6 www.hedgespa.com
advantage, while overseas investors utilized their full limit. In the next few days, the volume of business was far
less than initially expected. Furthermore, the new connection does not mean that the Chinese government has
abandoned the Qualified Foreign Institutional Investor (QFII) scheme for foreign institutional investors to
invest in Chinese stocks. They still require QFII for foreign institutions to invest in China since only retail
investors could buy and sell RMB without restriction. Worse — the effects of cutting down interest rates may
counteract the effects of the rising deposit rate floating range, so that interest rates stay mostly unchanged.
Currency-related liquidity risk is another key issue. On one hand, Chinese government scrapped the 20,000
RMB limit, so Chinese investors have ways to get large sums of funds out of China (as compared to the
previous limit of 50,000 USD per person per year.). This is comparable to allowing free conversion of the RMB,
which means that the RMB will be forced up as a consequence. Once the Chinese government effectively lifted
total exchange rate control, it will have to allow the RMB to appreciate or it will be forced to buy an indefinite
amount of U.S. Treasury bonds. Moreover, if MSCI World eventually must include Chinese shares, there will
be a flood of indexing money flooding into China. If RMB keeps increasing its value, U.S. goods will become
much cheaper and its economy will pick up due to bigger demands from outside the U.S. If such a trend
continues, a sudden devaluation of the U.S. dollar relative to the RMB could occur just like to the Japan yen in
the late 80s due to the Plaza Accord.
Image: Wikipedia (with permission to reuse and modify)
Apple Inc.’s iPhone 6 is transforming from a handheld computer to a remote control for the real world that
can track our medical information, pay for our purchases and potentially connect and control our appliances.
That’s part of the reason why Apple’s stock is reaching all-time highs and the company has a market cap of
nearly $700 billion, making it the most valuable company in history.
Despite a general increasing trend in the value of Apple’s stock in the previous months, a closer look at the
reasons for this trend seems to suggest that Apple’s stock price may be overvalued and may decline in the future.
For example, a large part of this increase was due to Apple’s share buyback program, through which Apple
spent $43 billion last year on its own stock. As such, it is difficult to determine whether the increase in the value
of Apple shares was driven by Apple’s buyback program or something actually fundamental about the company
itself.
The iPhone 6’s success can be largely attributed to its larger screen. Apple has finally realized that its earlier
view of “the perfect size” as 3.5-4 inches was outdated and that larger phones were driving growth in the market.
However, Apple had only just started acting on this realization, and thus had lost years of larger phone sales to
competitors such as Samsung. With growing number of competitors such as Samsung, HTC, Google, Motorola,
and LG, will Apple be able to maintain its current level of iPhone sales in the future to justify its current
valuation level?
Apple Valuation
700 Billion Reasons to be Sustainable?
December 2014
7 www.hedgespa.com
Scenario 1: Investors Continue to be Madly in Love with an Overvalued Apple
Having built strong customer loyalty and made its iPhone somewhat of a symbol of status and hipness, Apple
seems to continue its reputation as a “cult” company with followers blind to many of its shortcomings,
including its recent lack of true innovation. One investment bank even predicted that Apple may face a shortage
of iPhone 6 Plus stocks in the spring. These culty consumers and investors will continue to overvalue Apple and
may drive Apple shares to an even higher price, until its shortcomings are finally reflected by lower earnings. In
other words, Apple continues its runaway success by selling a brand rather than genuinely innovative products.
It may carry on doing so until the current generation of Apple users decides that its products are no longer hip.
Scenario 2: Apple Is Symptom of a Manageable Tech Bubble
Since the release of iPhone 6 about 2 months ago, the market capitalization of Apple has gone up by about 15%
to reach almost $700 billion. Despite the spike in Apple’s share price, the only real, noticeable change in the
iPhone 6 relative to its predecessors was primarily a bigger screen. It should be obvious that Apple cannot keep
releasing barely-modified products without true innovation. And if this continues to happen, there will soon be
concerns over its valuation. Investors will start to have lower expectations of Apple, leading to a drop in its
stock value to where it was before the iPhone 6 release.
If Apple’s value does fall back to its pre-iPhone 6 level, approximately $100 billion will be wiped out from
institutional investors. Furthermore, as Apple drops by 15%, the value of other technology companies that are
positively correlated to Apple will also drop, leading to a very rough estimate of another $200 billion in loss to
institutional investors. However, since the global pension size is currently $30 trillion, most of them would have
at least a 1% buffer to prepare for such modest market decline, so such a decline will not have any direct impact
on corporate activities.
Scenario 3: Apple Loses Ground to Competitors and Starts to Decline
If Apple cannot find new ways to attract people to continue buying its new products, it may be only a matter of
time before the market loses confidence in Apple, which will certainly raise concerns over its current high
valuation. As mentioned earlier, even if Apple goes back to where it was a couple months ago, it is still a
manageable problem because the global pension size of $30 trillion has a buffer prepared for modest market
declines. However, if the tech bubble pops and Apple goes back to its historical valuation, say sometime in
2013, of around $60 per share, the problem suddenly becomes more drastic. Approximately half of Apple’s
current market cap will be wiped from institutional investors, and taking into account the drop in other financial
products, this could become a trillion dollar problem. Global pension plans may not have enough of a buffer to
meet such declines. That may hurt the bottom lines of governments and corporations guaranteeing pension
obligations, which will have to find ways to meet such obligations: They may have to cut their R&D budget,
which may create real problems in the underlying economy over the longer run.
December 2014
8 www.hedgespa.com
Asset manager Brian is managing a $500M life insurance company’s portfolio. The portfolio bears resemblance to
AIG’s portfolio published as of August 2014 (Figure 1). In order to cover potential unexpected losses, an insurance
company is required to set aside a certain amount of capital to ensure that it has more than sufficient capital to meet its
obligations.
Brian would like to minimize the insurance company’s capital adequacy requirements. The specific implementation of
capital adequacy is typically based on 2 pillars.
Pillar 1 covers risk-based capital requirements such as credit risk, market risk, and operational risk. The goal is for the
company to have sufficient capital to pay claims if a very bad market event happens.
Pillar 2 provides a framework for dealing with systematic risk, pension risk, concentration risk, strategic risk, reputational
risk, liquidity risk, and legal risk.
One traditional way of calculating Pillar I is to scale the portfolio’s annualized volatility to a standard-normal VaR at
99.7%. By using this traditional method, Brian multiplies his portfolio’s volatility of 3.15% by the critical value at 99.97%,
which has a Z-score of approximately 3.43, to obtain an estimate of 10.80% for VaR. Since the standard-normal method
has some well known short-comings (i.e, with predictions at extreme confidence taking place at much lower frequency
than observed), regulators will demand a “penalty ratio” that typically falls between 1.3 to 1.5 to adjust for the well known
inaccuracy, leading to a VaR between 14.0% and 16.2%.
Using fourth-order mathematics by incorporating skewness and kurtosis, Brian obtains a more robust VaR estimate of
13.25%. By reporting a more robust VaR, typical regulators are less likely to demand any “penalty ratio”. Brian will
actually end up with a better capital adequacy treatment for Pillar I. He expects the extremely rare 0.03% one-year loss to
be 13.25% of the entire portfolio, so the insurance company will only need to prepare $66M for Pillar I economic capital
instead of about $81M with a less robust estimate.
Source: Wikipedia (with permission to
reuse)
User Resources
More Robust Methods to Estimate Capital Adequacy
December 2014
9 www.hedgespa.com
Brian now examines shocks from market scenarios that would lead to large potential losses not captured by historical
statistics. He has chosen the scenarios U.S. Tech Bubble and Obama’s Foreign Policies Failure under scenario analysis.
He calculates Pillar II by running a regression on the chosen market indices and portfolio returns. After running the
regression, Brian obtains the following shocks below.
Brian doubts the accuracy of this method because he believes that a -1.87% shock under the Obama’s Foreign Policies
Fail scenario seems unreasonably low given how such a policy failure should have larger impacts on the markets. Further,
the usual method by turning individual asset returns into aggregated portfolio return will “mute” the volatility of the time
series. Brian opts for a more accurate asset-by-asset regression below:
Brian sees that the shocks have changed to -3.02% and -7.12%, respectively. Though the shocks do differ a lot at first
glance, the asset-by-asset regression results seem more credible knowing the large impact of these events. Moreover,
Brian sees that iShares Emerging Markets High Yield Bond ETF is the greatest contributor to portfolio loss. This gives
Brian an opportunity to consider a less sensitive product. Assuming that Pillar II capital is calculated based on the worst
shock, the insurance company will prepare additional Pillar II capital of $36M.
Disclaimer
The information contained herein: (1) is proprietary to HedgeSPA and/or its content providers; (2) may not be
copied or distributed; and (3) is not warranted to be accurate, complete or timely. Neither HedgeSPA nor its
content providers are responsible for any damages or losses arising from any use of this information. Information
containing any historical information, data or analysis should not be taken as an indication or guarantee of any
future performance, analysis, forecast or prediction. Past performance does not guarantee future results. None of
the Information constitutes an offer to sell (or a solicitation of an offer to buy), any security, financial product or
other investment vehicle or any trading strategy.
© 2014 HedgeSPA Pte. Ltd. All Rights Reserved.
Contact Us
Address 440 N. Wolfe Road Sunnyvale, CA 94085, USA
Phone +1 (415) 465 2503 (California) or +65 9183 1492 (Singapore)
Skype hedgespa.support
Email salesnsupport@hedgespa.com
Website www.hedgespa.com

More Related Content

What's hot

Olivier Desbarres - Be careful what you wish for
Olivier Desbarres - Be careful what you wish forOlivier Desbarres - Be careful what you wish for
Olivier Desbarres - Be careful what you wish for
Olivier Desbarres
 
CUSHMAN & WAKEFIELD U.S. Macro Forecast
CUSHMAN & WAKEFIELD U.S. Macro ForecastCUSHMAN & WAKEFIELD U.S. Macro Forecast
CUSHMAN & WAKEFIELD U.S. Macro Forecast
Matthew Marshall
 
Weekly Forex News January 27th 2013
Weekly Forex News January 27th 2013Weekly Forex News January 27th 2013
Weekly Forex News January 27th 2013FCTOFX
 
Global Currencies Outlook October 2017
Global Currencies Outlook October 2017Global Currencies Outlook October 2017
Global Currencies Outlook October 2017
Daniel Gunn
 
Currency monthly 9th nov'16
Currency monthly   9th nov'16Currency monthly   9th nov'16
Currency monthly 9th nov'16
Choice Equity
 
SVB Q2 2017 Economic Report
SVB Q2 2017 Economic ReportSVB Q2 2017 Economic Report
SVB Q2 2017 Economic Report
Silicon Valley Bank
 
MNI Russia Consumer Report 2013-12
MNI Russia Consumer Report 2013-12MNI Russia Consumer Report 2013-12
MNI Russia Consumer Report 2013-12
MNI Indicators | Deutsche Börse Group
 
Standpoint: Global Reflation by Kevin Lings
Standpoint: Global Reflation by Kevin Lings Standpoint: Global Reflation by Kevin Lings
Standpoint: Global Reflation by Kevin Lings
STANLIB
 
Monthly Briefing on the World Economic Situation and Prospects (WESP), No. 52
Monthly Briefing on the World Economic Situation and Prospects (WESP), No. 52 Monthly Briefing on the World Economic Situation and Prospects (WESP), No. 52
Monthly Briefing on the World Economic Situation and Prospects (WESP), No. 52
Department of Economic and Social Affairs (UN DESA)
 
Olivier DEsbarres: What to expect in 2016 – same, same, but worse
Olivier DEsbarres: What to expect in 2016 – same, same, but worseOlivier DEsbarres: What to expect in 2016 – same, same, but worse
Olivier DEsbarres: What to expect in 2016 – same, same, but worse
Olivier Desbarres
 
India Economic Outlook - 2014
India Economic Outlook - 2014India Economic Outlook - 2014
India Economic Outlook - 2014
Shreyes Shyamsunder
 
Bank of england and inflation sense of déjà vu
Bank of england and inflation  sense of déjà vuBank of england and inflation  sense of déjà vu
Bank of england and inflation sense of déjà vu
Olivier Desbarres
 
The Swedish Economy No.2 - March 29, 2012
The Swedish Economy No.2 - March 29, 2012 The Swedish Economy No.2 - March 29, 2012
The Swedish Economy No.2 - March 29, 2012 Swedbank
 
Polish economic outlook 1/2010 (44)
Polish economic outlook 1/2010 (44)Polish economic outlook 1/2010 (44)
Polish economic outlook 1/2010 (44)
CASE Center for Social and Economic Research
 
Aranca Views | US Fed Rate Hike Potential Impact - A Report
Aranca Views | US Fed Rate Hike Potential Impact - A ReportAranca Views | US Fed Rate Hike Potential Impact - A Report
Aranca Views | US Fed Rate Hike Potential Impact - A Report
Aranca
 
The US Market Overview - 2Q14 (FINAL)
The US Market Overview - 2Q14 (FINAL)The US Market Overview - 2Q14 (FINAL)
The US Market Overview - 2Q14 (FINAL)Greg Meier
 
Emerging Markets December 2011
Emerging Markets December 2011Emerging Markets December 2011
Emerging Markets December 2011
Swedbank
 
Statement of the monetary policy committee 25 may 2017
Statement of the monetary policy committee   25 may 2017Statement of the monetary policy committee   25 may 2017
Statement of the monetary policy committee 25 may 2017
SABC News
 

What's hot (19)

Polish Economic Outlook 01/2010
Polish Economic Outlook 01/2010Polish Economic Outlook 01/2010
Polish Economic Outlook 01/2010
 
Olivier Desbarres - Be careful what you wish for
Olivier Desbarres - Be careful what you wish forOlivier Desbarres - Be careful what you wish for
Olivier Desbarres - Be careful what you wish for
 
CUSHMAN & WAKEFIELD U.S. Macro Forecast
CUSHMAN & WAKEFIELD U.S. Macro ForecastCUSHMAN & WAKEFIELD U.S. Macro Forecast
CUSHMAN & WAKEFIELD U.S. Macro Forecast
 
Weekly Forex News January 27th 2013
Weekly Forex News January 27th 2013Weekly Forex News January 27th 2013
Weekly Forex News January 27th 2013
 
Global Currencies Outlook October 2017
Global Currencies Outlook October 2017Global Currencies Outlook October 2017
Global Currencies Outlook October 2017
 
Currency monthly 9th nov'16
Currency monthly   9th nov'16Currency monthly   9th nov'16
Currency monthly 9th nov'16
 
SVB Q2 2017 Economic Report
SVB Q2 2017 Economic ReportSVB Q2 2017 Economic Report
SVB Q2 2017 Economic Report
 
MNI Russia Consumer Report 2013-12
MNI Russia Consumer Report 2013-12MNI Russia Consumer Report 2013-12
MNI Russia Consumer Report 2013-12
 
Standpoint: Global Reflation by Kevin Lings
Standpoint: Global Reflation by Kevin Lings Standpoint: Global Reflation by Kevin Lings
Standpoint: Global Reflation by Kevin Lings
 
Monthly Briefing on the World Economic Situation and Prospects (WESP), No. 52
Monthly Briefing on the World Economic Situation and Prospects (WESP), No. 52 Monthly Briefing on the World Economic Situation and Prospects (WESP), No. 52
Monthly Briefing on the World Economic Situation and Prospects (WESP), No. 52
 
Olivier DEsbarres: What to expect in 2016 – same, same, but worse
Olivier DEsbarres: What to expect in 2016 – same, same, but worseOlivier DEsbarres: What to expect in 2016 – same, same, but worse
Olivier DEsbarres: What to expect in 2016 – same, same, but worse
 
India Economic Outlook - 2014
India Economic Outlook - 2014India Economic Outlook - 2014
India Economic Outlook - 2014
 
Bank of england and inflation sense of déjà vu
Bank of england and inflation  sense of déjà vuBank of england and inflation  sense of déjà vu
Bank of england and inflation sense of déjà vu
 
The Swedish Economy No.2 - March 29, 2012
The Swedish Economy No.2 - March 29, 2012 The Swedish Economy No.2 - March 29, 2012
The Swedish Economy No.2 - March 29, 2012
 
Polish economic outlook 1/2010 (44)
Polish economic outlook 1/2010 (44)Polish economic outlook 1/2010 (44)
Polish economic outlook 1/2010 (44)
 
Aranca Views | US Fed Rate Hike Potential Impact - A Report
Aranca Views | US Fed Rate Hike Potential Impact - A ReportAranca Views | US Fed Rate Hike Potential Impact - A Report
Aranca Views | US Fed Rate Hike Potential Impact - A Report
 
The US Market Overview - 2Q14 (FINAL)
The US Market Overview - 2Q14 (FINAL)The US Market Overview - 2Q14 (FINAL)
The US Market Overview - 2Q14 (FINAL)
 
Emerging Markets December 2011
Emerging Markets December 2011Emerging Markets December 2011
Emerging Markets December 2011
 
Statement of the monetary policy committee 25 may 2017
Statement of the monetary policy committee   25 may 2017Statement of the monetary policy committee   25 may 2017
Statement of the monetary policy committee 25 may 2017
 

Similar to Publication2

World Economic Situation and Prospects Monthly Briefing, No. 64
World Economic Situation and Prospects Monthly Briefing, No. 64 World Economic Situation and Prospects Monthly Briefing, No. 64
World Economic Situation and Prospects Monthly Briefing, No. 64
Department of Economic and Social Affairs (UN DESA)
 
LPL Market Insight 1Q14: Stocks Cool Off as U.S. Economy Weathers Deep Freeze
LPL Market Insight 1Q14: Stocks Cool Off as U.S. Economy Weathers Deep FreezeLPL Market Insight 1Q14: Stocks Cool Off as U.S. Economy Weathers Deep Freeze
LPL Market Insight 1Q14: Stocks Cool Off as U.S. Economy Weathers Deep Freeze
Marc Freedman CFP® at Freedman Financial
 
Quarterly Market Outlook April 2016
Quarterly Market Outlook April 2016Quarterly Market Outlook April 2016
Quarterly Market Outlook April 2016
JonGrant01
 
Monthly Briefing on the World Economic Situation and Prospects (WESP), No. 63
Monthly Briefing on the World Economic Situation and Prospects (WESP), No. 63Monthly Briefing on the World Economic Situation and Prospects (WESP), No. 63
Monthly Briefing on the World Economic Situation and Prospects (WESP), No. 63
Department of Economic and Social Affairs (UN DESA)
 
Olivier desbarres what you may have missed and why it matters
Olivier desbarres   what you may have missed and why it mattersOlivier desbarres   what you may have missed and why it matters
Olivier desbarres what you may have missed and why it matters
Olivier Desbarres
 
2014 in review
2014 in review2014 in review
MTBiz January 2015
MTBiz January 2015MTBiz January 2015
MTBiz January 2015
Mutual Trust Bank Ltd.
 
The Global Economy – No. 8/2010
The Global Economy – No. 8/2010The Global Economy – No. 8/2010
The Global Economy – No. 8/2010
Swedbank
 
BSIF Investment-Environment-Committee-Report-Fall-2015
BSIF Investment-Environment-Committee-Report-Fall-2015BSIF Investment-Environment-Committee-Report-Fall-2015
BSIF Investment-Environment-Committee-Report-Fall-2015Julian Fung
 
The Provinces Reset Their Budget Paths
The Provinces Reset Their Budget PathsThe Provinces Reset Their Budget Paths
The Provinces Reset Their Budget PathsEmily Jackson
 
Jpc weekly market view 2 december 2015
Jpc weekly market view 2 december 2015Jpc weekly market view 2 december 2015
Jpc weekly market view 2 december 2015
Jon Taubert
 
It is about economic analysis for US from 2014-2016Review my paper.docx
It is about economic analysis for US from 2014-2016Review my paper.docxIt is about economic analysis for US from 2014-2016Review my paper.docx
It is about economic analysis for US from 2014-2016Review my paper.docx
BHANU281672
 
Advice for the wise september 2015.
Advice for the wise september 2015.Advice for the wise september 2015.
Advice for the wise september 2015.
Karvy Private Wealth
 
Dow jones prediction
Dow jones predictionDow jones prediction
Dow jones prediction
nidhisss
 
Third Quarter 2015 Economic Report (Oct 2015)
Third Quarter 2015 Economic Report (Oct 2015) Third Quarter 2015 Economic Report (Oct 2015)
Third Quarter 2015 Economic Report (Oct 2015)
Marketing Durban Chamber
 
Monthly Newsletter Mar'16
Monthly Newsletter Mar'16Monthly Newsletter Mar'16
Monthly Newsletter Mar'16
Taha Ekram
 
Gr report global_powers_of_retailing_2016
Gr report global_powers_of_retailing_2016Gr report global_powers_of_retailing_2016
Gr report global_powers_of_retailing_2016
Ethos Media S.A.
 

Similar to Publication2 (20)

World Economic Situation and Prospects Monthly Briefing, No. 64
World Economic Situation and Prospects Monthly Briefing, No. 64 World Economic Situation and Prospects Monthly Briefing, No. 64
World Economic Situation and Prospects Monthly Briefing, No. 64
 
LPL Market Insight 1Q14: Stocks Cool Off as U.S. Economy Weathers Deep Freeze
LPL Market Insight 1Q14: Stocks Cool Off as U.S. Economy Weathers Deep FreezeLPL Market Insight 1Q14: Stocks Cool Off as U.S. Economy Weathers Deep Freeze
LPL Market Insight 1Q14: Stocks Cool Off as U.S. Economy Weathers Deep Freeze
 
Quarterly Market Outlook April 2016
Quarterly Market Outlook April 2016Quarterly Market Outlook April 2016
Quarterly Market Outlook April 2016
 
Monthly Briefing on the World Economic Situation and Prospects (WESP), No. 63
Monthly Briefing on the World Economic Situation and Prospects (WESP), No. 63Monthly Briefing on the World Economic Situation and Prospects (WESP), No. 63
Monthly Briefing on the World Economic Situation and Prospects (WESP), No. 63
 
FNB
FNBFNB
FNB
 
TAP QuarterlyLetter 201603
TAP QuarterlyLetter 201603TAP QuarterlyLetter 201603
TAP QuarterlyLetter 201603
 
Olivier desbarres what you may have missed and why it matters
Olivier desbarres   what you may have missed and why it mattersOlivier desbarres   what you may have missed and why it matters
Olivier desbarres what you may have missed and why it matters
 
2014 in review
2014 in review2014 in review
2014 in review
 
MTBiz January 2015
MTBiz January 2015MTBiz January 2015
MTBiz January 2015
 
The Global Economy – No. 8/2010
The Global Economy – No. 8/2010The Global Economy – No. 8/2010
The Global Economy – No. 8/2010
 
Weekly market review - May 31, 2013
Weekly market review - May 31, 2013Weekly market review - May 31, 2013
Weekly market review - May 31, 2013
 
BSIF Investment-Environment-Committee-Report-Fall-2015
BSIF Investment-Environment-Committee-Report-Fall-2015BSIF Investment-Environment-Committee-Report-Fall-2015
BSIF Investment-Environment-Committee-Report-Fall-2015
 
The Provinces Reset Their Budget Paths
The Provinces Reset Their Budget PathsThe Provinces Reset Their Budget Paths
The Provinces Reset Their Budget Paths
 
Jpc weekly market view 2 december 2015
Jpc weekly market view 2 december 2015Jpc weekly market view 2 december 2015
Jpc weekly market view 2 december 2015
 
It is about economic analysis for US from 2014-2016Review my paper.docx
It is about economic analysis for US from 2014-2016Review my paper.docxIt is about economic analysis for US from 2014-2016Review my paper.docx
It is about economic analysis for US from 2014-2016Review my paper.docx
 
Advice for the wise september 2015.
Advice for the wise september 2015.Advice for the wise september 2015.
Advice for the wise september 2015.
 
Dow jones prediction
Dow jones predictionDow jones prediction
Dow jones prediction
 
Third Quarter 2015 Economic Report (Oct 2015)
Third Quarter 2015 Economic Report (Oct 2015) Third Quarter 2015 Economic Report (Oct 2015)
Third Quarter 2015 Economic Report (Oct 2015)
 
Monthly Newsletter Mar'16
Monthly Newsletter Mar'16Monthly Newsletter Mar'16
Monthly Newsletter Mar'16
 
Gr report global_powers_of_retailing_2016
Gr report global_powers_of_retailing_2016Gr report global_powers_of_retailing_2016
Gr report global_powers_of_retailing_2016
 

Publication2

  • 1. December 2014 1 www.hedgespa.com The Gross Domestic Product (GDP) of the United States in the third quarter of 2014 is reported to rise at a 3.9 percent annualized rate. The reported figure exceeded the initial estimate of 3.5 percent. Recently, both the European Union and certain Asian countries such as China have adopted easing policies to stimulate their economies, which deepened concerns over the global economy. However, although the global economy appears to be unstable, recent GDP data suggests that U.S. economic growth remains steady with relatively sound economic fundamentals. Similarly, even though exports from the United States have decreased, foreign investments increased, so that decreasing exports can only have limited negative impacts. In this article, we outline two possible scenarios for the global economy. What We Do HedgeSPA provides state-of-the-art investment analytics and market scenarios on an affordable platform, for seasoned buy-side professionals. We take care of portfolio managers’ day-to-day headaches and technicalities, saving them time and effort that they can redirect towards client relationships and strong portfolio performance. The HedgeSPA Platform With our platform, you can scan investment sub-universes; check for out-of-balance factor exposures; evaluate your portfolios under scenarios extracted from published broker research; generate indicative reporting to check against common errors in broker reports; and send customized risk and performance reports to investors or to third-party investment reporting tools. Try it here: app.hedgespa.com HedgeSPA December 2014 Sophisticated Investment Analytics  Trusted Market Insights 1 www.hedgespa.com Contents 1 Global Economic Growth Who is Expanding? 2 Other Updates Saudi’s New Oil Strategy Russian Sanctions Obama’s Foreign Policy Hong Kong Protests 3 Premier Calls for Elections in Japan What is Abe betting on? 4 U.S. Elections in 2014 Republicans Domination or Potential Collaboration? 5 Shanghai-HK Stock Connect An Unprecedented Opportunity? 6 Apple Valuation 700 Billion Reasons to be Sustainable? 8 User Resources More Robust Methods to Estimate Capital Adequacy Market Scenarios Global Economic Growth Who is Expanding? wi Contact Email salesnsupport@hedgespa.com Skype hedgespa.support Twitter @HedgeSPA Image: Wikipedia (with permission to reuse and modify)
  • 2. December 2014 2 www.hedgespa.com Other Scenario Updates The following provides updates on several scenarios we have discussed in earlier newsletters. We have updated these scenarios on the HedgeSPA platform to reflect new information and market development. Saudi Arabia’s New Oil Strategy (November 2014): On top of Saudi’s efforts to cut its export oil prices, the combination of a strong U.S. dollar and increased shale gas production is contributing to further declines in oil prices. According to some analysts, crude oil prices may even fall as much as 40% to $40+ per barrel, despite it being just over $100 per barrel in September 2014. Nonetheless, it has also been reported that the Saudis, which produces approximately 10 million barrels per day against a global demand of about 92 million barrels per day and are widely seen as the “swing” producer, are preparing to stabilize oil at around $60 per barrel. This will have a big effect on not only the oil market, but also the global economy, which is heavily dependent on oil for energy. Russian Sanctions and its Repercussions (November 2014): The recent tumble in oil prices has huge implications for Russia, who is already in a bad situation due to economic sanctions imposed by countries such as the European Union, the United States, and Japan. Since Russia is the world’s largest oil producing country, as well as the world’s second largest oil exporter, tumbling oil prices mean a depreciating ruble. According to the BBC, the Russian ruble experienced its largest single-day decline since 1998, falling as much as 9% against the dollar on December 1, 2014, which led to concerns on the state of the Russian economy. Obama’s Foreign Policies (September 2014): Chuck Hagel was forced to resign from his position as the US Secretary of Defense. He was initially hired to manage the withdrawal of US forces from Iraq. As the ISIS situation worsened, Hagel failed to articulate a credible response. Instead, the US response to the ISIS threat was largely seen as confused and incoherent. Hagel’s resignation was widely seen as one symptom of deeper problems in Obama’s foreign policy failures. Hong Kong Protests and its Embattled Chief Executive (November 2014): There was an escalation of confrontation in the Hong Kong protests, with no winning end game in sight for the student protestors, after resorting to hunger strike tactics. At the same time, the Chinese Govn’t views the protests as a situation incited by “foreign elements” in a city that is still considered its main financial gateway to the world, thus it is unlikely to give in. Scenario 1: Global Economy Booms With the encouraging news, the stock market in the United States continues to rise. On November 25, 2014, the Standard & Poor Index rose 5.91, or 0.29%, to close at 2069.41. The Dow Jones Industrial rose 0.04% to 17817.90; NASDAQ rose 0.24% to 4712.97. Asian stock markets, with the exception of Hong Kong’s Hang Seng Index, rose as well. The Nikkei 225 ended up with a 0.29% increase and the Shanghai Composite Index rose by 1.37%. This trend met the market’s expectation that the Federal Reserve will raise interest rates in the middle of next year, potentially driving up the US dollar some more. Recently, the US federal budget deficit even dropped to $483 billion, which is only 2.8% of GDP rather than the historical 3.1%, giving the private sector and therefore the global economy more room to grow. Scenario 2: Gold and Certain Currencies are Faring Worse In 2014, the U.S. dollar kept rising, crude oil prices fell, and the Fed announced the end of quantitative easing. All three of these factors negatively impacted gold prices, which fell below $1200 USD per ounce. The Swiss referendum requiring the Swiss Central Bank to have at least a 20% weight in gold holdings was held on November 30, 2014. Had the Swiss referendum pass, gold price would have risen by about $50, but ultimately the referendum failed to win voter support. Since the Swiss referendum did not pass, the Swiss government may need to sell any extra gold holdings that it has already bought as a precautionary measure, resulting in a further drop in gold prices. As a result, other financial products positively correlated to gold will fall as well, creating uncertainties in the global financial market. Furthermore, UK GDP data showed a somewhat unbalanced economic recovery that hurt the British pound. With the UK election fast approaching, that is bad news to David Cameron, the UK premier, and his Conservative Party. Luckily, UK interest rate remained relatively stable. Aside from the British pound, other currencies were also under pressure because of the strong US dollar. AUD/USD fell to 0.8513 and NZD/USD fell significantly as well. For now, there are few tangible reasons to be massively enthusiastic about the Australian economy, which is only one of the many examples for why we expect to see uneven global economic growth in 2015.
  • 3. December 2014 3 www.hedgespa.com Image: Wikipedia (with permission to reuse and modify) Premier Calls for Elections in Japan What is Abe betting on? In the second quarter of 2014, Japan’s GDP declined by 7.1 percent and continued to decline by 1.6 percent in the third quarter, in contrast to earlier predictions. The yen has weakened, and it may be difficult for Japan to realize its goal of fiscal balance by 2020. In response to this decline, Prime Minister Shinzo Abe of Japan announced at the cabinet meeting that he is going to dissolve the House of Representatives on November 21, 2014. This set the stage for the next election on December 14, 2014. He also declared that Japan’s original plan to increase consumption tax will be postponed from October 1, 2015 to April 1, 2017. Will Abenomics be successful in combating declining GDP in Japan? We shall look into two scenarios: Scenario 1: Abenomics is Successful and Japan’s Economy Recovers Abe’s earlier election slogan was “Now or never.” According to current public opinion poll, the approval rating of Abe and his cabinet is struggling now at 40 to 50 percent, although the Liberal Democratic Party still leads in political support. Thus, the snap election may provide Abe a better shot at winning reelection - chances are high that he can hold onto power till the end of 2018. With Abe in power for the next few years, his plans to postpone Japan’s consumer tax increase will benefit both Japan’s GDP and its deflationary economy. On November 21, 2014, its stock market recovered slightly. The Nikkei index closed 0.3 higher and surged on the news. The Japanese economy now shows signs of a gradual recovery. Scenario 2: Recession in Japan Continues According to data provided by Japanese Internal Affairs Ministry, the election alone will cost approximately 70 billion yen, or $560 million USD. As a result, a large number of voters complained about such a snap election, with 60 percent of voters against it. On top of its administrative cost, if the Parliament cannot build consensus after the election, then Japanese economic policy will likely suffer. Japan’s GDP will further decline, and Abe may be forced to step down eventually. With the increasingly aging among the Japanese population, Japan’s government needs alternatives to income tax in order to pay for its debts and benefit obligations. Postponing the increase of consumption tax will bring a further burden to Japan’s debts. In 2013, Japan’s debt to GDP was 227 percent and it is predicted that, by 2030, that amount will reach 264 percent. Its 2014 public debt to GDP ratio is the highest in the world, according to the World Factbook published by the CIA. Consequently, the Japanese economy can enter yet another double-dip recession. The parliamentary election seems to be both a political and economic turnabout. If Abenomics does not work out and Japan’s economy further declines, Japan’s economy will face enormous challenges.
  • 4. December 2014 4 www.hedgespa.com Image: Wikipedia (with permission to reuse and modify) Mid-term elections in the United States took place on November 4, 2014. The results turned out to favor the Republican Party. The Republicans will take over the Senate in early January next year, following a 7-year hiatus. The results of this midterm election seem to suggest increasing doubts by the American public over Obama’s policy agenda and leadership. With Republicans taking over both chambers of the US Congress for the first time since 2006, President Obama may have to adjust his agenda if he wants Congress to pass his policies. Scenario 1: U.S. Politics Becomes More Collaborative To save his approval rating, Obama began discussing with his Cabinet new ways to improve his public image. On November 20, 2014, Obama announced that he would take executive actions to grant a temporary reprieve from extradition for up to 5 million unapproved immigrants living in the United States. Unauthorized immigrants gain more opportunities to stay in the United States permanently. Furthermore, he made a large stride towards eco-friendliness when he pushed for a political agreement with China on climate change. Obama is also pushing for bipartisanship, especially on trade-related issues. For instance, he promoted the Trans-Pacific Partnership (TPP) and the Transatlantic Trade and Investment Partnership (TTIP), which provides a springboard for the FTA (Free Trade Agreement) negotiations. Once Obama has the congressional mandate to negotiate FTAs, U.S. economy will move forward and the global economy will grow. The U.S. is then expected to become a more collaborative economy and society. Scenario 2: Republicans Dominate Based on the analysis provided by the Wall Street Journal, in the third quarter of 2014, the corporate donations Republicans received exceeded those of the Democrats for the first time in years. Republican candidates received 58 percent of the donations while Democratic candidates only received 42 percent. Given its current success, the Republican party has few reasons to cooperate with the Democrats to push for FTA negotiation and immigration reform. Worse — any attempt to coerce consensus will only aggravate the relationships between the two parties. Eventually, Obama would lose his approval rating and may have to step back from driving the US political agenda. With the US Government reducing its role and crowding out effects, the US economy and therefore its stock market will boom, e.g. the Dow Jones and Standard & Poor’s are expected to surge. On the contrary, gold prices will drop in response to a stronger US dollar, and may even fall below $1000 per ounce. US Elections 2014 Republicans Domination or Potential Collaboration?
  • 5. December 2014 5 www.hedgespa.com Image: cnbc.com (with permission to reuse and modify) Starting on November 17, 2014, investors from the Hong Kong Stock Exchange will be able to invest in Shanghai A shares directly across the Chinese border. China linked the two stock markets to improve liquidity and to attract more investors. In doing so, the Chinese government allows the RMB to become more widely circulated. China worked not only to improve liquidity but also to spur growth and to ease debt pressure by cutting interest rates for the first time in many years. Furthermore, to ensure that Shanghai A shares will function properly in the global market, the Chinese government also scrapped the daily exchange limit of 20,000 RMB to HKD (and vice versa), and such freer flow of RMB may force its value up. If current trend continues, this may be the beginning of a seismic shift in global markets. We shall look into two scenarios to analyze the underlying effects of the linkup and the end of the 20,000 RMB limit. Scenario 1: A Shares Enter the Global Economy and the Chinese Economy Booms According to recent data, even though Chinese GDP represents 12.3% of global economy, China’s Shanghai A shares only represent 10.5% of the global market capitalization. Due to the recent link-up between the Shanghai and Hong Kong Stock Exchanges, Shanghai A shares will now be able to command a greater global presence once funding flows from Hong Kong into China. The market immediately reacted to the new policy, with EPS increasing by 6%. The lifting of the 20,000 RMB daily limit effectively increased investment opportunities and attracted global investors. Ultimately, the move to link the two stock exchanges and the removal of the 20,000 RMB daily exchange limit promoted the increases in capital liquidity and boosted the Chinese stock market. Currently, investors in Mainland China tend to focus on real estate investments and cash. Based on data provided by the Wall Street Journal, mainland investors only put 7% of their wealth in the stock market. However, since the Shanghai-Hong Kong Stock Connect has demonstrated that the Chinese stock market is maturing, mainland investors are now more motivated to invest in stocks to diversify their assets. More funding will flow into the Chinese stock market not only from mainland investors but also from foreign investors, as non-mainland private investors invest in Chinese stocks and eventually institutional investors as well, since it is only a matter of time for the MSCI World to include Chinese stocks. Not only is this new policy tool adding to the Chinese stock market’s stability and maturity, but it is also a tool that can be used for interest rate arbitrage, eventually driving interest rates in China to be roughly the same as those in the rest of the world on the same currencies. Scenario 2: Global Economy Changes On the first day of the launch of the Shanghai-Hong Kong Connect, mainland investors surprisingly showed little interest in Hong Kong stocks and only utilized 17% of their limit, despite having the tax exemption Shanghai-HK Stock Connect An Unprecedented Opportunity?
  • 6. December 2014 6 www.hedgespa.com advantage, while overseas investors utilized their full limit. In the next few days, the volume of business was far less than initially expected. Furthermore, the new connection does not mean that the Chinese government has abandoned the Qualified Foreign Institutional Investor (QFII) scheme for foreign institutional investors to invest in Chinese stocks. They still require QFII for foreign institutions to invest in China since only retail investors could buy and sell RMB without restriction. Worse — the effects of cutting down interest rates may counteract the effects of the rising deposit rate floating range, so that interest rates stay mostly unchanged. Currency-related liquidity risk is another key issue. On one hand, Chinese government scrapped the 20,000 RMB limit, so Chinese investors have ways to get large sums of funds out of China (as compared to the previous limit of 50,000 USD per person per year.). This is comparable to allowing free conversion of the RMB, which means that the RMB will be forced up as a consequence. Once the Chinese government effectively lifted total exchange rate control, it will have to allow the RMB to appreciate or it will be forced to buy an indefinite amount of U.S. Treasury bonds. Moreover, if MSCI World eventually must include Chinese shares, there will be a flood of indexing money flooding into China. If RMB keeps increasing its value, U.S. goods will become much cheaper and its economy will pick up due to bigger demands from outside the U.S. If such a trend continues, a sudden devaluation of the U.S. dollar relative to the RMB could occur just like to the Japan yen in the late 80s due to the Plaza Accord. Image: Wikipedia (with permission to reuse and modify) Apple Inc.’s iPhone 6 is transforming from a handheld computer to a remote control for the real world that can track our medical information, pay for our purchases and potentially connect and control our appliances. That’s part of the reason why Apple’s stock is reaching all-time highs and the company has a market cap of nearly $700 billion, making it the most valuable company in history. Despite a general increasing trend in the value of Apple’s stock in the previous months, a closer look at the reasons for this trend seems to suggest that Apple’s stock price may be overvalued and may decline in the future. For example, a large part of this increase was due to Apple’s share buyback program, through which Apple spent $43 billion last year on its own stock. As such, it is difficult to determine whether the increase in the value of Apple shares was driven by Apple’s buyback program or something actually fundamental about the company itself. The iPhone 6’s success can be largely attributed to its larger screen. Apple has finally realized that its earlier view of “the perfect size” as 3.5-4 inches was outdated and that larger phones were driving growth in the market. However, Apple had only just started acting on this realization, and thus had lost years of larger phone sales to competitors such as Samsung. With growing number of competitors such as Samsung, HTC, Google, Motorola, and LG, will Apple be able to maintain its current level of iPhone sales in the future to justify its current valuation level? Apple Valuation 700 Billion Reasons to be Sustainable?
  • 7. December 2014 7 www.hedgespa.com Scenario 1: Investors Continue to be Madly in Love with an Overvalued Apple Having built strong customer loyalty and made its iPhone somewhat of a symbol of status and hipness, Apple seems to continue its reputation as a “cult” company with followers blind to many of its shortcomings, including its recent lack of true innovation. One investment bank even predicted that Apple may face a shortage of iPhone 6 Plus stocks in the spring. These culty consumers and investors will continue to overvalue Apple and may drive Apple shares to an even higher price, until its shortcomings are finally reflected by lower earnings. In other words, Apple continues its runaway success by selling a brand rather than genuinely innovative products. It may carry on doing so until the current generation of Apple users decides that its products are no longer hip. Scenario 2: Apple Is Symptom of a Manageable Tech Bubble Since the release of iPhone 6 about 2 months ago, the market capitalization of Apple has gone up by about 15% to reach almost $700 billion. Despite the spike in Apple’s share price, the only real, noticeable change in the iPhone 6 relative to its predecessors was primarily a bigger screen. It should be obvious that Apple cannot keep releasing barely-modified products without true innovation. And if this continues to happen, there will soon be concerns over its valuation. Investors will start to have lower expectations of Apple, leading to a drop in its stock value to where it was before the iPhone 6 release. If Apple’s value does fall back to its pre-iPhone 6 level, approximately $100 billion will be wiped out from institutional investors. Furthermore, as Apple drops by 15%, the value of other technology companies that are positively correlated to Apple will also drop, leading to a very rough estimate of another $200 billion in loss to institutional investors. However, since the global pension size is currently $30 trillion, most of them would have at least a 1% buffer to prepare for such modest market decline, so such a decline will not have any direct impact on corporate activities. Scenario 3: Apple Loses Ground to Competitors and Starts to Decline If Apple cannot find new ways to attract people to continue buying its new products, it may be only a matter of time before the market loses confidence in Apple, which will certainly raise concerns over its current high valuation. As mentioned earlier, even if Apple goes back to where it was a couple months ago, it is still a manageable problem because the global pension size of $30 trillion has a buffer prepared for modest market declines. However, if the tech bubble pops and Apple goes back to its historical valuation, say sometime in 2013, of around $60 per share, the problem suddenly becomes more drastic. Approximately half of Apple’s current market cap will be wiped from institutional investors, and taking into account the drop in other financial products, this could become a trillion dollar problem. Global pension plans may not have enough of a buffer to meet such declines. That may hurt the bottom lines of governments and corporations guaranteeing pension obligations, which will have to find ways to meet such obligations: They may have to cut their R&D budget, which may create real problems in the underlying economy over the longer run.
  • 8. December 2014 8 www.hedgespa.com Asset manager Brian is managing a $500M life insurance company’s portfolio. The portfolio bears resemblance to AIG’s portfolio published as of August 2014 (Figure 1). In order to cover potential unexpected losses, an insurance company is required to set aside a certain amount of capital to ensure that it has more than sufficient capital to meet its obligations. Brian would like to minimize the insurance company’s capital adequacy requirements. The specific implementation of capital adequacy is typically based on 2 pillars. Pillar 1 covers risk-based capital requirements such as credit risk, market risk, and operational risk. The goal is for the company to have sufficient capital to pay claims if a very bad market event happens. Pillar 2 provides a framework for dealing with systematic risk, pension risk, concentration risk, strategic risk, reputational risk, liquidity risk, and legal risk. One traditional way of calculating Pillar I is to scale the portfolio’s annualized volatility to a standard-normal VaR at 99.7%. By using this traditional method, Brian multiplies his portfolio’s volatility of 3.15% by the critical value at 99.97%, which has a Z-score of approximately 3.43, to obtain an estimate of 10.80% for VaR. Since the standard-normal method has some well known short-comings (i.e, with predictions at extreme confidence taking place at much lower frequency than observed), regulators will demand a “penalty ratio” that typically falls between 1.3 to 1.5 to adjust for the well known inaccuracy, leading to a VaR between 14.0% and 16.2%. Using fourth-order mathematics by incorporating skewness and kurtosis, Brian obtains a more robust VaR estimate of 13.25%. By reporting a more robust VaR, typical regulators are less likely to demand any “penalty ratio”. Brian will actually end up with a better capital adequacy treatment for Pillar I. He expects the extremely rare 0.03% one-year loss to be 13.25% of the entire portfolio, so the insurance company will only need to prepare $66M for Pillar I economic capital instead of about $81M with a less robust estimate. Source: Wikipedia (with permission to reuse) User Resources More Robust Methods to Estimate Capital Adequacy
  • 9. December 2014 9 www.hedgespa.com Brian now examines shocks from market scenarios that would lead to large potential losses not captured by historical statistics. He has chosen the scenarios U.S. Tech Bubble and Obama’s Foreign Policies Failure under scenario analysis. He calculates Pillar II by running a regression on the chosen market indices and portfolio returns. After running the regression, Brian obtains the following shocks below. Brian doubts the accuracy of this method because he believes that a -1.87% shock under the Obama’s Foreign Policies Fail scenario seems unreasonably low given how such a policy failure should have larger impacts on the markets. Further, the usual method by turning individual asset returns into aggregated portfolio return will “mute” the volatility of the time series. Brian opts for a more accurate asset-by-asset regression below: Brian sees that the shocks have changed to -3.02% and -7.12%, respectively. Though the shocks do differ a lot at first glance, the asset-by-asset regression results seem more credible knowing the large impact of these events. Moreover, Brian sees that iShares Emerging Markets High Yield Bond ETF is the greatest contributor to portfolio loss. This gives Brian an opportunity to consider a less sensitive product. Assuming that Pillar II capital is calculated based on the worst shock, the insurance company will prepare additional Pillar II capital of $36M. Disclaimer The information contained herein: (1) is proprietary to HedgeSPA and/or its content providers; (2) may not be copied or distributed; and (3) is not warranted to be accurate, complete or timely. Neither HedgeSPA nor its content providers are responsible for any damages or losses arising from any use of this information. Information containing any historical information, data or analysis should not be taken as an indication or guarantee of any future performance, analysis, forecast or prediction. Past performance does not guarantee future results. None of the Information constitutes an offer to sell (or a solicitation of an offer to buy), any security, financial product or other investment vehicle or any trading strategy. © 2014 HedgeSPA Pte. Ltd. All Rights Reserved. Contact Us Address 440 N. Wolfe Road Sunnyvale, CA 94085, USA Phone +1 (415) 465 2503 (California) or +65 9183 1492 (Singapore) Skype hedgespa.support Email salesnsupport@hedgespa.com Website www.hedgespa.com