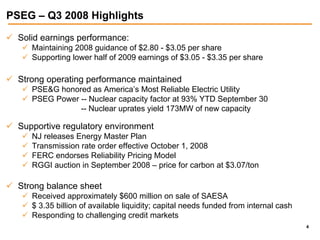
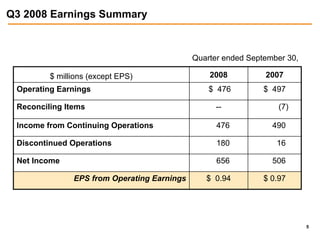
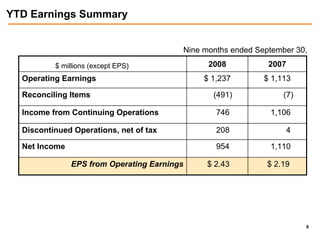
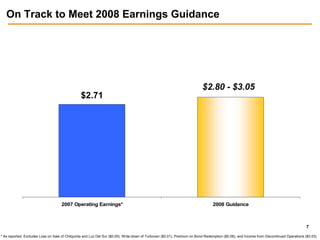
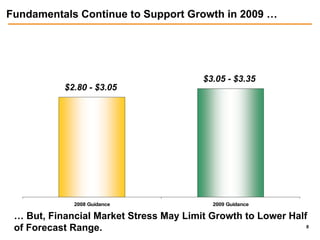
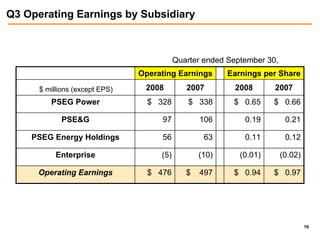
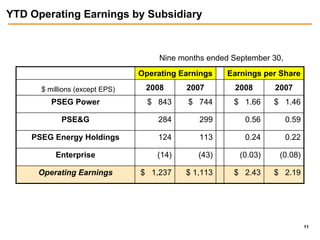
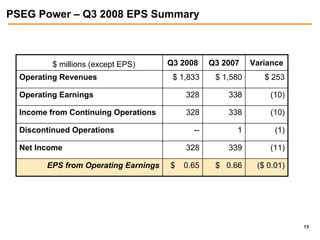
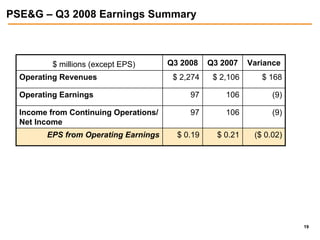
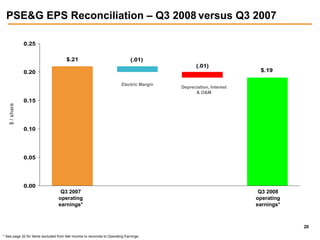
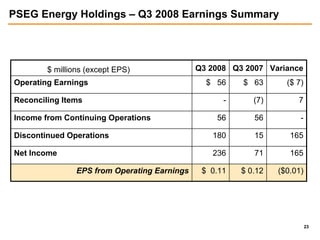
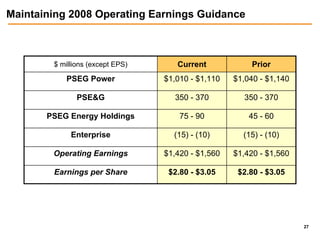
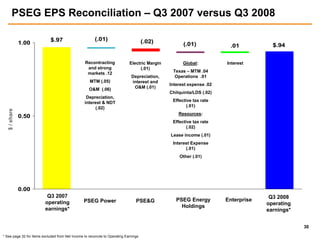
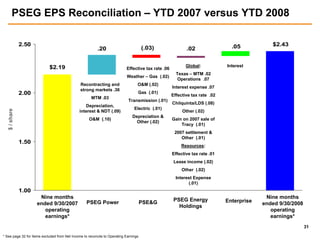
PSEG reported solid third quarter 2008 earnings, maintaining guidance for the full year. Operating earnings were $476 million compared to $497 million in the prior year quarter. PSEG Power contributed $328 million in operating earnings, while PSE&G contributed $97 million. PSEG Energy Holdings contributed $56 million in operating earnings. PSEG is on track to meet its full year 2008 guidance and its 2009 guidance range is $3.05 to $3.35 per share.
My presentation slides on Gaza in Focus, a case study on how Al Jazeera used Twitter and Ushahidi to cover the Gaza conflict in Jan 2009. Presentation without audio commentary doesn't all makes sense but here it is anyways.
BYD SWOT Analysis and In-Depth Insights 2024.pptxmikemetalprod
Indepth analysis of the BYD 2024
BYD (Build Your Dreams) is a Chinese automaker and battery manufacturer that has snowballed over the past two decades to become a significant player in electric vehicles and global clean energy technology.
This SWOT analysis examines BYD's strengths, weaknesses, opportunities, and threats as it competes in the fast-changing automotive and energy storage industries.
Founded in 1995 and headquartered in Shenzhen, BYD started as a battery company before expanding into automobiles in the early 2000s.
Initially manufacturing gasoline-powered vehicles, BYD focused on plug-in hybrid and fully electric vehicles, leveraging its expertise in battery technology.
Today, BYD is the world’s largest electric vehicle manufacturer, delivering over 1.2 million electric cars globally. The company also produces electric buses, trucks, forklifts, and rail transit.
On the energy side, BYD is a major supplier of rechargeable batteries for cell phones, laptops, electric vehicles, and energy storage systems.
how to sell pi coins on Bitmart crypto exchangeDOT TECH
Yes. Pi network coins can be exchanged but not on bitmart exchange. Because pi network is still in the enclosed mainnet. The only way pioneers are able to trade pi coins is by reselling the pi coins to pi verified merchants.
A verified merchant is someone who buys pi network coins and resell it to exchanges looking forward to hold till mainnet launch.
I will leave the telegram contact of my personal pi merchant to trade with.
@Pi_vendor_247
what is the best method to sell pi coins in 2024DOT TECH
The best way to sell your pi coins safely is trading with an exchange..but since pi is not launched in any exchange, and second option is through a VERIFIED pi merchant.
Who is a pi merchant?
A pi merchant is someone who buys pi coins from miners and pioneers and resell them to Investors looking forward to hold massive amounts before mainnet launch in 2026.
I will leave the telegram contact of my personal pi merchant to trade pi coins with.
@Pi_vendor_247
If you are looking for a pi coin investor. Then look no further because I have the right one he is a pi vendor (he buy and resell to whales in China). I met him on a crypto conference and ever since I and my friends have sold more than 10k pi coins to him And he bought all and still want more. I will drop his telegram handle below just send him a message.
@Pi_vendor_247
how can i use my minded pi coins I need some funds.DOT TECH
If you are interested in selling your pi coins, i have a verified pi merchant, who buys pi coins and resell them to exchanges looking forward to hold till mainnet launch.
Because the core team has announced that pi network will not be doing any pre-sale. The only way exchanges like huobi, bitmart and hotbit can get pi is by buying from miners.
Now a merchant stands in between these exchanges and the miners. As a link to make transactions smooth. Because right now in the enclosed mainnet you can't sell pi coins your self. You need the help of a merchant,
i will leave the telegram contact of my personal pi merchant below. 👇 I and my friends has traded more than 3000pi coins with him successfully.
@Pi_vendor_247
The European Unemployment Puzzle: implications from population agingGRAPE
We study the link between the evolving age structure of the working population and unemployment. We build a large new Keynesian OLG model with a realistic age structure, labor market frictions, sticky prices, and aggregate shocks. Once calibrated to the European economy, we quantify the extent to which demographic changes over the last three decades have contributed to the decline of the unemployment rate. Our findings yield important implications for the future evolution of unemployment given the anticipated further aging of the working population in Europe. We also quantify the implications for optimal monetary policy: lowering inflation volatility becomes less costly in terms of GDP and unemployment volatility, which hints that optimal monetary policy may be more hawkish in an aging society. Finally, our results also propose a partial reversal of the European-US unemployment puzzle due to the fact that the share of young workers is expected to remain robust in the US.
The secret way to sell pi coins effortlessly.DOT TECH
Well as we all know pi isn't launched yet. But you can still sell your pi coins effortlessly because some whales in China are interested in holding massive pi coins. And they are willing to pay good money for it. If you are interested in selling I will leave a contact for you. Just telegram this number below. I sold about 3000 pi coins to him and he paid me immediately.
Telegram: @Pi_vendor_247
Seminar: Gender Board Diversity through Ownership NetworksGRAPE
Seminar on gender diversity spillovers through ownership networks at FAME|GRAPE. Presenting novel research. Studies in economics and management using econometrics methods.
how to sell pi coins in all Africa Countries.DOT TECH
Yes. You can sell your pi network for other cryptocurrencies like Bitcoin, usdt , Ethereum and other currencies And this is done easily with the help from a pi merchant.
What is a pi merchant ?
Since pi is not launched yet in any exchange. The only way you can sell right now is through merchants.
A verified Pi merchant is someone who buys pi network coins from miners and resell them to investors looking forward to hold massive quantities of pi coins before mainnet launch in 2026.
I will leave the telegram contact of my personal pi merchant to trade with.
@Pi_vendor_247
Lecture slide titled Fraud Risk Mitigation, Webinar Lecture Delivered at the Society for West African Internal Audit Practitioners (SWAIAP) on Wednesday, November 8, 2023.
how can I sell pi coins after successfully completing KYCDOT TECH
Pi coins is not launched yet in any exchange 💱 this means it's not swappable, the current pi displaying on coin market cap is the iou version of pi. And you can learn all about that on my previous post.
RIGHT NOW THE ONLY WAY you can sell pi coins is through verified pi merchants. A pi merchant is someone who buys pi coins and resell them to exchanges and crypto whales. Looking forward to hold massive quantities of pi coins before the mainnet launch.
This is because pi network is not doing any pre-sale or ico offerings, the only way to get my coins is from buying from miners. So a merchant facilitates the transactions between the miners and these exchanges holding pi.
I and my friends has sold more than 6000 pi coins successfully with this method. I will be happy to share the contact of my personal pi merchant. The one i trade with, if you have your own merchant you can trade with them. For those who are new.
Message: @Pi_vendor_247 on telegram.
I wouldn't advise you selling all percentage of the pi coins. Leave at least a before so its a win win during open mainnet. Have a nice day pioneers ♥️
#kyc #mainnet #picoins #pi #sellpi #piwallet
#pinetwork
2. Forward-Looking Statement
Readers are cautioned that statements contained in this presentation about our and our subsidiaries' future performance, including future
revenues, earnings, strategies, prospects and all other statements that are not purely historical, are forward-looking statements for purposes of
the safe harbor provisions under The Private Securities Litigation Reform Act of 1995. Although we believe that our expectations are based on
reasonable assumptions, we can give no assurance they will be achieved. The results or events predicted in these statements may differ
materially from actual results or events. Factors which could cause results or events to differ from current expectations include, but are not
limited to:
• Adverse Changes in energy industry, policies and regulation, including market rules that may adversely affect our operating results.
• Any inability of our energy transmission and distribution businesses to obtain adequate and timely rate relief and/or regulatory approvals from
federal and/or state regulators.
• Changes in federal and/or state environmental regulations that could increase our costs or limit operations of our generating units.
• Changes in nuclear regulation and/or developments in the nuclear power industry generally, that could limit operations of our nuclear generating
units.
• Actions or activities at one of our nuclear units that might adversely affect our ability to continue to operate that unit or other units at the same
site.
• Any inability to balance successfully our energy obligations, available supply and trading risks.
• Any deterioration in our credit quality.
• Availability of capital and credit markets at reasonable pricing terms and ability to meet cash needs.
• Any inability to realize anticipated tax benefits or retain tax credits.
• Increases in the cost of or interruption in the supply of fuel and other commodities necessary to the operation of our generating units.
• Delays or cost escalations in our construction and development activities.
• Adverse capital market performance of our decommissioning and defined benefit plan trust funds.
• Changes in technology and/or increased customer conservation.
For further information, please refer to our Annual Report on Form 10-K, including Item 1A. Risk Factors, and subsequent reports on Form 10-Q
and Form 8-K filed with the Securities and Exchange Commission. These documents address in further detail our business, industry issues and
other factors that could cause actual results to differ materially from those indicated in this presentation. In addition, any forward-looking
statements included herein represent our estimates only as of today and should not be relied upon as representing our estimates as of any
subsequent date. While we may elect to update forward-looking statements from time to time, we specifically disclaim any obligation to do so,
even if our estimates change, unless otherwise required by applicable securities laws.
1
3. GAAP Disclaimer
PSEG presents Operating Earnings in addition to its Net Income reported
in accordance with accounting principles generally accepted in the United
States (GAAP). Operating Earnings is a non-GAAP financial measure that
differs from Net Income because it excludes the impact of the sale of
certain non-core domestic and international assets and material
impairments and lease-transaction-related charges. PSEG presents
Operating Earnings because management believes that it is appropriate
for investors to consider results excluding these items in addition to the
results reported in accordance with GAAP. PSEG believes that the non-
GAAP financial measure of Operating Earnings provides a consistent and
comparable measure of performance of its businesses to help
shareholders understand performance trends. This information is
not intended to be viewed as an alternative to GAAP information. The last
slide in this presentation includes a list of items excluded from Net Income
to reconcile to Operating Earnings, with a reference to that slide included
on each of the slides where the non-GAAP information appears.
2
5. PSEG – Q3 2008 Highlights
Solid earnings performance:
Maintaining 2008 guidance of $2.80 - $3.05 per share
Supporting lower half of 2009 earnings of $3.05 - $3.35 per share
Strong operating performance maintained
PSE&G honored as America’s Most Reliable Electric Utility
PSEG Power -- Nuclear capacity factor at 93% YTD September 30
-- Nuclear uprates yield 173MW of new capacity
Supportive regulatory environment
NJ releases Energy Master Plan
Transmission rate order effective October 1, 2008
FERC endorses Reliability Pricing Model
RGGI auction in September 2008 – price for carbon at $3.07/ton
Strong balance sheet
Received approximately $600 million on sale of SAESA
$ 3.35 billion of available liquidity; capital needs funded from internal cash
Responding to challenging credit markets
4
6. Q3 2008 Earnings Summary
Quarter ended September 30,
2008 2007
$ millions (except EPS)
Operating Earnings $ 476 $ 497
Reconciling Items -- (7)
Income from Continuing Operations 476 490
Discontinued Operations 180 16
Net Income 656 506
EPS from Operating Earnings $ 0.94 $ 0.97
5
7. YTD Earnings Summary
Nine months ended September 30,
2008 2007
$ millions (except EPS)
Operating Earnings $ 1,237 $ 1,113
Reconciling Items (491) (7)
Income from Continuing Operations 746 1,106
Discontinued Operations, net of tax 208 4
Net Income 954 1,110
EPS from Operating Earnings $ 2.43 $ 2.19
6
8. On Track to Meet 2008 Earnings Guidance
$2.80 - $3.05
$2.71
2007 Operating Earnings* 2008 Guidance
7
* As reported. Excludes Loss on Sale of Chilquinta and Luz Del Sur ($0.05), Write-down of Turboven ($0.01), Premium on Bond Redemption ($0.06), and Income from Discontinued Operations ($0.03)
9. Fundamentals Continue to Support Growth in 2009 …
$3.05 - $3.35
$2.80 - $3.05
2008 Guidance 2009 Guidance
… But, Financial Market Stress May Limit Growth to Lower Half
of Forecast Range. 8
10. PSEG
2008 Q3 Operating Company Review
Tom O’Flynn
Executive Vice President and Chief Financial Officer
14. PSEG Power – Q3 2008 EPS Summary
Q3 2008 Q3 2007 Variance
$ millions (except EPS)
Operating Revenues $ 1,833 $ 1,580 $ 253
Operating Earnings 328 338 (10)
Income from Continuing Operations 328 338 (10)
Discontinued Operations -- 1 (1)
Net Income 328 339 (11)
EPS from Operating Earnings $ 0.65 $ 0.66 ($ 0.01)
13
15. PSEG Power EPS Reconciliation – Q3 2008 versus Q3 2007
1.00
.12 (.05)
(.06)
$.66 (.02) $.65
MTM
$ / share
O&M
Recontracting Depreciation, NDT &
and strong Other
markets
0.50
0.00
Q3 2008
Q3 2007
operating
operating
earnings*
earnings*
14
* See page 32 for Items excluded from Net Income to reconcile to Operating Earnings
16. PSEG Power – Generation Measures
PSEG Power – Generation (GWh)
Quarter ended September 30, Nine months ended September 30,
20,000 45,000 42,771
40,807
15,502 10,571
15,281 9,037
15,000
4,144 30,000
4,048
10,276
9,947
10,000
3,730
3,824
15,000
5,000 21,823 21,924
7,628
7,409
0 0
2007 2008 2007 2008
Total Oil & 15
Total Nuclear Total Coal*
Natural Gas
* Includes figures for Pumped Storage
17. Strong Pricing Supports Margin Improvement
PSEG Power Gross Margin* ($/MWh)
Quarter ended September 30, Nine months ended September 30,
$60 $60
$58
$56 $55
$50
$40 $40
2007 2008 2007 2008
16
* Includes MTM
18. PSEG Power – Q3 Operating Highlights
Operations
Output increased 1.5%.
For the quarter, nuclear fleet capacity factor improved to 94.6%; YTD capacity factor of
93.1% ahead of expectations.
Combined cycle fleet operated at capacity factors in excess of 50%.
Maintenance programs at NJ coal fleet limited capacity factor to 72%.
Power uprates at Hope Creek of 150MW; Salem No. 2 of 23MW.
Regulatory and Market Environment
RPM auction upheld by FERC in September; PJM evaluating ways to improve auction.
Clean Air Interstate Rule (CAIR) – US Court of Appeals for District of Columbia Circuit
requesting briefing on whether any party is seeking repeal and/or whether the Court should
stay its mandate to vacate.
RGGI auction in September; carbon prices set at $3.07/ton.
Financial
$1.7 billion of available liquidity on its lines of credit as of September 30; access to additional
PSEG credit of $1.1 billion.
Power wins bid to build 130MW of peaking capacity for June 2012 in-service at cost of
$130-$140 million.
17
Value of NDT fund affected by market volatility.
20. PSE&G – Q3 2008 Earnings Summary
Q3 2008 Q3 2007 Variance
$ millions (except EPS)
Operating Revenues $ 2,274 $ 2,106 $ 168
Operating Earnings 97 106 (9)
Income from Continuing Operations/ 97 106 (9)
Net Income
EPS from Operating Earnings $ 0.19 $ 0.21 ($ 0.02)
19
21. PSE&G EPS Reconciliation – Q3 2008 versus Q3 2007
0.25
$.21 (.01)
(.01)
$.19
0.20
Electric Margin
Depreciation, Interest
& O&M
0.15
$ / share
0.10
0.05
0.00
Q3 2007 Q3 2008
operating operating
earnings* earnings*
20
* See page 32 for Items excluded from Net Income to reconcile to Operating Earnings
22. PSE&G – Q3 Operating Highlights
Operations
PSE&G, for the third time in four years, has been named America’s most reliable
electric utility and the most reliable Mid-Atlantic utility for the seventh year.
O&M growth remains below inflation.
Accounts receivable balance and aging stable as a result of customer outreach
programs.
Regulatory and Market Environment
FERC approved request for cost of service formula rates for existing and future
transmission investments effective October 1, 2008.
NJ BPU approved 14.3% increase in base prices for gas commodity supply.
NJ released its Energy Master Plan calling for a 20% reduction in peak demand
by 2020, a 20% reduction in energy consumption by 2020 and 30% supply from
renewable resources by 2020.
Financial
Turmoil in financial markets affecting outlook for electric sales growth.
Capital to be invested in areas with regulatory support.
21
$447 million of available liquidity on its lines of credit as of September 30.
24. PSEG Energy Holdings – Q3 2008 Earnings Summary
Q3 2008 Q3 2007 Variance
$ millions (except EPS)
Operating Earnings $ 56 $ 63 ($ 7)
Reconciling Items - (7) 7
Income from Continuing Operations 56 56 -
Discontinued Operations 180 15 165
Net Income 236 71 165
EPS from Operating Earnings $ 0.11 $ 0.12 ($0.01)
23
25. PSEG Energy Holdings EPS Reconciliation – Q3 2008 versus
Q3 2007
0.20 (.02)
.02
(.01)
.05
(.02)
Interest Earnings
Expense on
Effective Tax
0.15 Chilquinta/ (.01)
Rate
LDS
(.01)
Effective Tax
$.12 Rate (.01)
Lease
$.11
Income
$ / share
Interest
Texas - Expense
0.10 Operations .01 Other
MTM .04
0.05
0.00
Q3 2007 Q3 2008
operating operating
earnings* earnings*
GLOBAL RESOURCES 24
* See page 32 for Items excluded from Net Income to reconcile to Operating Earnings
26. PSEG Energy Holdings – Q3 Operating Highlights
Operations
Texas – 2,000 MW gas-fired combined cycle capacity
1,000MW Guadalupe facility benefited from normal weather, increased dispatch and
spark spreads.
1,000MW Odessa facility Q3 dispatch flat to last year with increased spark spreads.
Regulatory and Market Environment
PSEG Global exploring options for its remaining international investments.
The Emergency Economic Stabilization Act of 2008 supports development of
renewables with extension of tax credits for solar and other renewable energy
sources.
Garden State Offshore Energy, a joint venture of PSEG Renewable Generation and
Deepwater Wind, was chosen by NJ BPU to explore the development of a 350MW
offshore wind farm.
Financial
SAESA sale – received approximately $600 million after Chilean and US taxes.
Additional $80 million tax deposit made with the IRS in September 2008 to defray
interest costs on disputed payments.
25
$115 million of available liquidity on its lines of credit as of September 30.
29. Liquidity – Sufficient to Meet Capital Requirements
PSEG has $3.35 billion of available liquidity as of September
30 to meet capital needs. During 2008, PSEG, PSEG Power
and PSE&G added capacity of $147 million, $225 million and
$28 million, respectively, to their lines of credit.
Capital expenditure forecast for 2009 reduced by
$275 - $325 million from prior levels.
PSEG, as of September 30, 2008, had $658 million of
remaining authorization under its $750 million common stock
repurchase program. The program was authorized in July
2008 to be executed over an 18-month period.
28
30. PSEG Liquidity as of September 30, 2008
Expiration Total Primary Usage at Available
Company Facility Date Facility Purpose 9/30/2008 9/30/2008
($ millions)
1 CP Support/Funding/LCs
5-year Credit Facility Dec-12 $1,000 $0 $1,000
PSEG
CP Support/Funding
Bilateral Credit Facility Jun-09 $100 $0 $100
Funding
Uncommitted Bilateral N/A N/A 0 N/A
Agreement
2 Funding/LCs
5-Year Credit Facility Dec-12 1,600 225 1,375
Power
Funding/LCs
Bilateral Credit Facility Jun-09 100 0 100
Funding/LCs
Bilateral Credit Facility Mar-09 150 59 91
Funding
Bilateral Credit Facility Sep-09 50 0 50
Funding/LCs
Bilateral Credit Facility Mar-10 100 25 75
3 CP Support/Funding/LCs
5-year Credit Facility Jun-12 600 153 447
PSE&G
Funding
Uncommitted Bilateral N/A N/A 28 N/A
Funding/LCs
5-year Credit Facility Jun-10 136 21 115
Energy
Holdings
Total $3,836 $3,353
1
PSEG Facility reduces by $47 million in 2012
2
Pow er Facility reduces by $75 million in 2012
3
PSE&G Facility reduces by $28 million in 2012
29
31. PSEG EPS Reconciliation – Q3 2007 versus Q3 2008
(.01)
$.97 (.02)
1.00 (.01) $.94
.01
Recontracting Electric Margin Global: Interest
and strong (.01)
Texas – MTM .04
markets .12
Depreciation, Operations .01
MTM (.05) interest and
Interest expense .02
O&M (.01)
O&M (.06)
Chilquinta/LDS (.02)
Depreciation,
Effective tax rate
interest & NDT
(.01)
(.02)
$ / share
Resources:
0.50
Effective tax rate
(.02)
Lease income (.01)
Interest Expense
(.01)
Other (.01)
0.00
Q3 2007 Q3 2008
PSEG Energy Enterprise
PSEG Power PSE&G
operating operating
Holdings
earnings* earnings*
30
* See page 32 for Items excluded from Net Income to reconcile to Operating Earnings
32. PSEG EPS Reconciliation – YTD 2007 versus YTD 2008
2.50 $2.43
.05
(.03)
.20 .02
Global: Interest
$2.19 Effective tax rate .06
Texas – MTM .02
Weather – Gas (.02)
Operations .07
O&M (.02)
Recontracting and
Interest expense .07
strong markets .36
Gas (.01)
2.00 Effective tax rate .02
MTM .03
Transmission (.01)
Chilquinta/LDS (.08)
Depreciation,
Electric (.01)
$ / share
Other (.02)
interest & NDT (.09)
Depreciation &
Gain on 2007 sale of
O&M (.10)
Other (.02)
Tracy (.01)
2007 settlement &
Other (.01)
1.50
Resources:
Effective tax rate .01
Lease income (.02)
Other (.02)
Interest Expense
(.01)
1.00
Nine months Nine months
PSEG Energy Enterprise
PSEG Power PSE&G
ended 9/30/2007 ended 9/30/2008
Holdings
operating operating
earnings* earnings*
31
* See page 32 for Items excluded from Net Income to reconcile to Operating Earnings
33. Items Excluded from Net Income to Reconcile to Operating Earnings
For the Quarters Ended For the Nine Months Ended
September 30, September 30,
Pro-forma Adjustments 2008 2007 2008 2007
Earnings Impact (in Millions)
Lease Transaction Reserves, net of tax $ - $ -$ (490) $ -
Loss from write-down of Turboven, net of tax - (7) - (7)
Premium on Bond Redemption, net of tax - - (1) -
Total Pro-forma to Operating Earnings $ - $ (7) $ (491) $ (7)
Fully Diluted Average Shares Outstanding (in Millions) 508 509 509 508
Per Share Impact (Diluted)
Lease Transaction Reserves, net of tax $ - $ - $ (0.96) $ -
Loss from write-down of Turboven, net of tax - (0.01) - (0.01)
Premium on Bond Redemption, net of tax - - - -
Total Pro-forma to Operating Earnings $ - $ (0.01) $ (0.96) $ (0.01)
Please see Slide 2 for an explanation of PSEG’s use of Operating Earnings as a non-GAAP financial measure and how
32
it differs from Net Income.