SlideShare a Scribd company logo
A     2006 Third Quarter


Financial
Supplement
Table of Contents


Financial Highlights                                                                                                                                          1

Health Care and Group Insurance Statistics                                                                                                                    2

Health Care and Group Insurance Enrollment                                                                                                                    3

Earnings Summary                                                                                                                                              4

Consolidating Statements of Income (Loss) from Continuing Operations by Segment                                                                             5-6

Consolidated Balance Sheets                                                                                                                                   7

Combining Balance Sheets                                                                                                                                      8

Condensed Combining Statements of Cash Flows                                                                                                              9-10

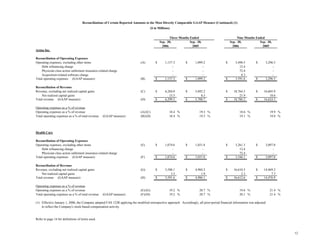
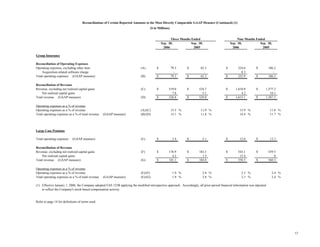
Reconciliations of Certain Reported Amounts to the Most Directly Comparable GAAP Measure                                                                 11-13

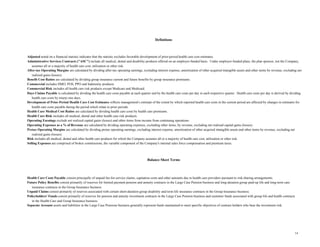
Definitions                                                                                                                                                 14


This document is supplemental to the Company’s third quarter 2006 earnings press release and should be read in conjunction therewith and in conjunction with the Company's September 30, 2006
Quarterly Report on Form 10-Q to be filed with the U.S. Securities and Exchange Commission. Please direct questions with respect to this material to David Entrekin, Vice President -
Investor Relations, Aetna Inc., 151 Farmington Avenue, RT21, Hartford, Connecticut 06156. Telephone: 860-273-7830. Email: entrekind@aetna.com.
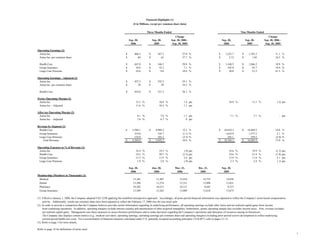
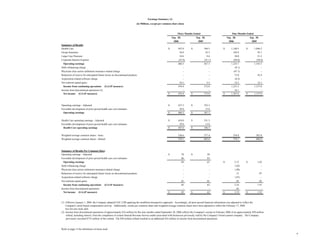
Financial Highlights (1)
                                                                                      ($ in Millions, except per common share data)

                                                                                                    Three Months Ended                                                                  Nine Months Ended
                                                                                                                              Change                                                                             Change
                                                                                   Sep. 30,               Sep. 30,         Sep. 30, 2006 -                             Sep. 30,              Sep. 30,         Sep. 30, 2006 -
                                                                                    2006                   2005             Sep. 30, 2005                               2006                  2005             Sep. 30, 2005

Operating Earnings (2)
 Aetna Inc.                                                                    $       466.3          $       367.3                  27.0 %                        $      1,223.7        $      1,101.5                 11.1 %
 Aetna Inc. per common share                                                   $         .84          $         .61                  37.7 %                        $         2.12        $         1.82                 16.5 %

 Health Care                                                                   $       447.0          $       346.5                  29.0 %                        $      1,160.5        $      1,046.2                 10.9 %
 Group Insurance                                                               $        34.6          $        32.3                   7.1 %                        $        102.8        $         92.7                 10.9 %
 Large Case Pensions                                                           $        10.6          $         9.6                  10.4 %                        $         30.0        $         21.2                 41.5 %

Operating Earnings - Adjusted (2)
 Aetna Inc.                                                                    $       437.3          $       352.3                  24.1 %
 Aetna Inc. per common share                                                   $         .78          $         .58                  34.5 %

 Health Care                                                                   $       418.0          $       331.5                  26.1 %

Pretax Operating Margin (2)
 Aetna Inc.                                                                              12.3 %                 10.9 %                1.4 pts.                               10.9 %                11.1 %                (.2) pts.
 Aetna Inc. - Adjusted                                                                   11.6 %                 10.5 %                1.1 pts.

After-tax Operating Margin (2)
 Aetna Inc.                                                                               8.1 %                  7.0 %                1.1 pts.                                7.1 %                 7.1 %                  - pts.
 Aetna Inc. - Adjusted                                                                    7.6 %                  6.7 %                 .9 pts.

Revenue by Segment (2)
 Health Care                                                                   $      5,588.1         $      4,984.2                 12.1    %                     $    16,610.3         $    14,469.2                  14.8    %
 Group Insurance                                                                        519.0                  524.7                 (1.1)   %                           1,610.9               1,577.2                   2.1    %
 Large Case Pensions                                                                    176.9                  183.3                 (3.5)   %                             543.1                 559.5                  (2.9)   %
    Total Revenue                                                              $      6,284.0         $      5,692.2                 10.4    %                     $    18,764.3         $    16,605.9                  13.0    %

Operating Expenses as % of Revenue (2)
 Aetna Inc.                                                                              18.4   %               19.3   %              (.9)   pts.                            18.6   %              19.9   %             (1.3)   pts.
 Health Care                                                                             19.2   %               20.7   %             (1.5)   pts.                            19.6   %              21.4   %             (1.8)   pts.
 Group Insurance                                                                         15.3   %               11.9   %              3.4    pts.                            13.9   %              11.8   %              2.1    pts.
 Large Case Pensions                                                                      1.9   %                2.8   %              (.9)   pts.                             2.3   %               2.4   %              (.1)   pts.

                                                                                   Sep. 30,               Jun. 30,             Mar. 31,             Dec. 31,           Sep. 30,
                                                                                    2006                   2006                 2006                 2005               2005
Membership (Members in Thousands) (3)
 Medical                                                                              15,383                 15,407               15,418               14,755             14,650
 Dental                                                                               13,396                 13,374               13,331               13,098             13,031
 Pharmacy                                                                             10,202                 10,213               10,151                9,445              9,337
 Group Insurance                                                                      15,309                 15,265               13,089               13,618             13,675

(1) Effective January 1, 2006, the Company adopted FAS 123R applying the modified retrospective approach. Accordingly, all prior-period financial information was adjusted to reflect the Company's stock-based compensation
    activity. Additionally, results per common share have been adjusted to reflect the February 17, 2006 two-for-one stock split.
(2) In order to provide a comparison that the Company believes provides useful information regarding its underlying performance, all operating earnings exclude other items and net realized capital gains from income
    from continuing operations. In addition, operating margins exclude interest expense and amortization of other acquired intangibles; furthermore, pretax operating margin also excludes income taxes. Also, revenue excludes
    net realized capital gains. Management uses these measures to assess business performance and to make decisions regarding the Company's operations and allocation of resources among its businesses.
    The Company also displays certain metrics (e.g., medical cost ratios, operating earnings, operating earnings per common share and operating margins) excluding prior-period reserve development to reflect underlying
    current-period health care costs. For a reconciliation of financial measures calculated under U.S. generally accepted accounting principles (quot;GAAPquot;), refer to pages 11-13.
(3) Refer to page 3 for more details.

Refer to page 14 for definitions of terms used.
                                                                                                                                                                                                                                       1
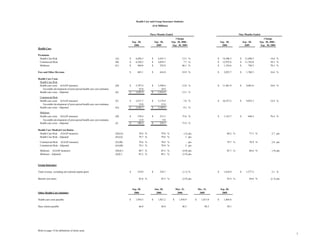
Health Care and Group Insurance Statistics
                                                                                                      ($ in Millions)


                                                                                                    Three Months Ended                                                                 Nine Months Ended
                                                                                                                            Change                                                                            Change
                                                                                     Sep. 30,             Sep. 30,       Sep. 30, 2006 -                                Sep. 30,            Sep. 30,       Sep. 30, 2006 -
                                                                                       2006                 2005          Sep. 30, 2005                                   2006                2005          Sep. 30, 2005
Health Care

Premiums
 Health Care Risk                                                      (A)       $      4,820.3       $      4,291.3               12.3 %                           $     14,308.3      $     12,490.5              14.6 %
 Commercial Risk                                                       (B)       $      4,350.2       $      4,039.3                7.7 %                           $     12,972.6      $     11,742.0              10.5 %
 Medicare                                                              (C)       $        469.0       $        252.0               86.1 %                           $      1,334.6      $        748.5              78.3 %

Fees and Other Revenue                                                           $       683.1        $       616.0                10.9 %                           $      2,052.7      $      1,760.5              16.6 %

Health Care Costs
 Health Care Risk
 Health care costs (GAAP measure)                                      (D)       $      3,797.4       $      3,390.4               12.0 %                           $     11,481.9      $      9,683.6              18.6 %
    Favorable development of prior-period health care cost estimates                       45.0                 24.0
 Health care costs - Adjusted                                          (E)       $      3,842.4       $      3,414.4               12.5 %

 Commercial Risk
 Health care costs (GAAP measure)                                      (F)       $      3,417.7       $      3,174.9                 7.6 %                          $     10,337.2      $      9,035.3              14.4 %
   Favorable development of prior-period health care cost estimates                        33.0                 15.0
 Health care costs - Adjusted                                          (G)       $      3,450.7       $      3,189.9                 8.2 %

 Medicare
 Health care costs (GAAP measure)                                      (H)       $       378.4        $       215.5                75.6 %                           $      1,143.7      $       648.4               76.4 %
   Favorable development of prior-period health care cost estimates                       12.0                  9.0
 Health care costs - Adjusted                                          (I)       $       390.4        $       224.5                73.9 %

Health Care Medical Cost Ratios
 Health Care Risk (GAAP measure)                                       (D)/(A)             78.8 %               79.0 %               (.2) pts.                                80.2 %              77.5 %              2.7 pts.
 Health Care Risk - Adjusted                                           (E)/(A)             79.7 %               79.6 %                .1 pts.

 Commercial Risk (GAAP measure)                                        (F)/(B)             78.6 %               78.6 %                    - pts.                              79.7 %              76.9 %              2.8 pts.
 Commercial Risk - Adjusted                                            (G)/(B)             79.3 %               79.0 %                   .3 pts.

 Medicare (GAAP measure)                                               (H)/(C)             80.7 %               85.5 %              (4.8) pts.                                85.7 %              86.6 %              (.9) pts.
 Medicare - Adjusted                                                   (I)/(C)             83.2 %               89.1 %              (5.9) pts.


Group Insurance

Total revenue, excluding net realized capital gains                              $       519.0        $       524.7                 (1.1) %                         $      1,610.9      $      1,577.2                2.1 %

Benefit cost ratios                                                                        92.6 %               95.5 %              (2.9) pts.                                93.4 %              94.6 %             (1.2) pts.


                                                                                     Sep. 30,             Jun. 30,            Mar. 31,                 Dec. 31,         Sep. 30,
Other Health Care Statistics                                                          2006                 2006                2006                     2005             2005

Health care costs payable                                                        $      1,954.5       $      1,921.2      $      1,934.9           $      1,817.0   $      1,864.8

Days claims payable                                                                        46.8                 44.8               46.5                      48.3             50.1


Refer to page 14 for definitions of terms used.
                                                                                                                                                                                                                                  2
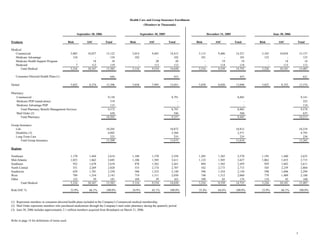
Health Care and Group Insurance Enrollment
                                                                                                         (Members in Thousands)


                                                         September 30, 2006                            September 30, 2005                         December 31, 2005                      June 30, 2006

Products                                          Risk          ASC           Total          Risk            ASC            Total        Risk           ASC           Total     Risk         ASC         Total

Medical:
  Commercial                                       5,085        10,037        15,122           5,014           9,401         14,415       5,115           9,406       14,521     5,103        10,054         15,157
  Medicare Advantage                                 124             -           124             102               -            102         101               -          101       123             -            123
  Medicare Health Support Program                      -            18            18               -              20             20           -              19           19         -            14             14
  Medicaid                                             7           112           119               -             113            113           -             114          114         -           113            113
      Total Medical                                5,216        10,167        15,383           5,116           9,534         14,650       5,216           9,539       14,755     5,226        10,181         15,407

   Consumer-Directed Health Plans (1)                                            644                                           433                                       453                                   621

Dental                                             5,022         8,374        13,396           5,038           7,993         13,031       5,078           8,020       13,098     5,022         8,352         13,374

Pharmacy:
    Commercial                                                                 9,138                                          8,791                                     8,885                                 9,141
    Medicare PDP (stand-alone)                                                   319                                              -                                         -                                   323
    Medicare Advantage PDP                                                       115                                              -                                         -                                   114
      Total Pharmacy Benefit Management Services                               9,572                                          8,791                                     8,885                                 9,578
    Mail Order (2)                                                               630                                            546                                       560                                   635
      Total Pharmacy                                                          10,202                                          9,337                                     9,445                                10,213

Group Insurance:
   Life                                                                       10,205                                         10,872                                   10,812                                 10,234
   Disability (3)                                                              4,882                                          2,568                                    2,571                                  4,793
   Long-Term Care                                                                222                                            235                                      235                                    238
       Total Group Insurance                                                  15,309                                         13,675                                   13,618                                 15,265

Regions

Northeast                                          1,170         1,444         2,614           1,188           1,370          2,558       1,205           1,365        2,570     1,195         1,440          2,635
Mid-Atlantic                                       1,023         1,662         2,685           1,106           1,505          2,611       1,122           1,505        2,627     1,062         1,653          2,715
Southeast                                            932         1,678         2,610             878           1,563          2,441         894           1,565        2,459       929         1,682          2,611
North Central                                        551         2,269         2,820             533           2,174          2,707         542           2,173        2,715       545         2,259          2,804
Southwest                                            629         1,701         2,330             588           1,552          2,140         596           1,554        2,150       598         1,696          2,294
West                                                 789         1,354         2,143             719           1,311          2,030         748           1,312        2,060       779         1,409          2,188
Other                                                122            59           181             104              59            163         109              65          174       118            42            160
       Total Medical                               5,216        10,167        15,383           5,116           9,534         14,650       5,216           9,539       14,755     5,226        10,181         15,407

Risk/ASC %                                         33.9%         66.1%        100.0%           34.9%           65.1%         100.0%       35.4%           64.6%       100.0%     33.9%         66.1%         100.0%


(1) Represents members in consumer-directed health plans included in the Company's Commercial medical membership.
(2) Mail Order represents members who purchased medications through the Company's mail order pharmacy during the quarterly period.
(3) June 30, 2006 includes approximately 2.1 million members acquired from Broadspire on March 31, 2006.


Refer to page 14 for definitions of terms used.


                                                                                                                                                                                                         3
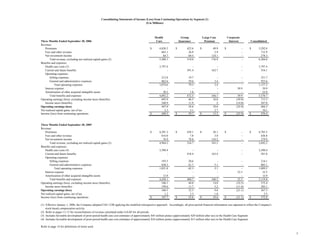
Earnings Summary (1)
                                                                          (in Millions, except per common share data)


                                                                                                               Three Months Ended                                 Nine Months Ended
                                                                                                          Sep. 30,              Sep. 30,                      Sep. 30,              Sep. 30,
                                                                                                           2006                  2005                          2006                  2005
Summary of Results
Health Care                                                                                           $        447.0       $           346.5              $       1,160.5       $       1,046.2
Group Insurance                                                                                                 34.6                    32.3                        102.8                  92.7
Large Case Pensions                                                                                             10.6                     9.6                         30.0                  21.2
Corporate Interest Expense                                                                                     (25.9)                  (21.1)                       (69.6)                (58.6)
 Operating earnings                                                                                            466.3                   367.3                      1,223.7               1,101.5
Debt refinancing charge                                                                                            -                       -                         (8.1)                    -
Physician class action settlement insurance-related charge                                                         -                       -                        (47.1)                    -
Reduction of reserve for anticipated future losses on discontinued products                                        -                       -                         75.0                  43.4
Acquisition-related software charge                                                                                -                       -                         (6.2)                    -
Net realized capital gains                                                                                      10.1                     5.5                         14.2                  12.1
  Income from continuing operations (GAAP measure)                                                             476.4                   372.8                      1,251.5               1,157.0
Income from discontinued operations (2)                                                                            -                       -                         16.1                     -
  Net income (GAAP measure)                                                                           $        476.4       $           372.8              $       1,267.6       $       1,157.0


Operating earnings - Adjusted                                                                         $        437.3       $           352.3
Favorable development of prior-period health care cost estimates                                                29.0                    15.0
 Operating earnings                                                                                   $        466.3       $           367.3


Health Care operating earnings - Adjusted                                                             $        418.0       $           331.5
Favorable development of prior-period health care cost estimates                                                29.0                    15.0
 Health Care operating earnings                                                                       $        447.0       $           346.5


Weighted average common shares - basic                                                                         536.6                   577.4                       554.8                 581.8
Weighted average common shares - diluted                                                                       558.1                   602.6                       578.3                 606.0


Summary of Results Per Common Share
Operating earnings - Adjusted                                                                         $              .78   $               .58
Favorable development of prior-period health care cost estimates                                                     .06                   .03
 Operating earnings                                                                                                  .84                   .61            $          2.12       $         1.82
Debt refinancing charge                                                                                                -                     -                       (.02)                   -
Physician class action settlement insurance-related charge                                                             -                     -                       (.08)                   -
Reduction of reserve for anticipated future losses on discontinued products                                            -                     -                        .13                  .07
Acquisition-related software charge                                                                                    -                     -                       (.01)                   -
Net realized capital gains                                                                                           .01                   .01                        .02                  .02
  Income from continuing operations        (GAAP measure)                                                            .85                   .62                       2.16                 1.91
Income from discontinued operations                                                                                    -                     -                        .03                    -
  Net income (GAAP measure)                                                                           $              .85   $               .62            $          2.19       $         1.91


(1) Effective January 1, 2006, the Company adopted FAS 123R applying the modified retrospective approach. Accordingly, all prior-period financial information was adjusted to reflect the
    Company's stock-based compensation activity. Additionally, results per common share and weighted average common shares have been adjusted to reflect the February 17, 2006
    two-for-one stock split.
(2) Income from discontinued operations of approximately $16 million for the nine months ended September 30, 2006 reflects the Company's receipt in February 2006 of an approximately $50 million
     refund, including interest, from the completion of certain Internal Revenue Service audits associated with businesses previously sold by the Company's former parent company. The Company
     previously recorded $735 million of this refund. The $50 million refund resulted in an additional $16 million in income from discontinued operations.


Refer to page 14 for definitions of terms used.
                                                                                                                                                                                                    4
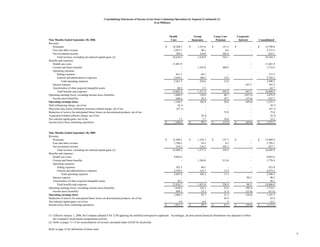
Consolidating Statements of Income (Loss) from Continuing Operations by Segment (1)
                                                                                        ($ in Millions)


                                                                                                Health                  Group             Large Case           Corporate
Three Months Ended September 30, 2006                                                            Care                 Insurance            Pensions             Interest         Consolidated
Revenue:
   Premiums                                                                                 $       4,820.3       $         422.6     $          49.9      $               -    $       5,292.8
   Fees and other revenue                                                                             683.1                  26.9                 2.9                      -              712.9
   Net investment income                                                                               84.7                  69.5               124.1                      -              278.3
       Total revenue, excluding net realized capital gains (2)                                      5,588.1                 519.0               176.9                      -            6,284.0
Benefits and expenses:
   Health care costs (3)                                                                            3,797.4                     -                   -                      -            3,797.4
   Current and future benefits                                                                            -                 391.4               162.7                      -              554.1
   Operating expenses:
       Selling expenses                                                                               212.0                  19.7                   -                    -                231.7
       General and administrative expenses                                                            862.6                  59.6                 3.4                    -                925.6
           Total operating expenses                                                                 1,074.6                  79.3                 3.4                    -              1,157.3
   Interest expense                                                                                       -                     -                   -                 39.9                 39.9
   Amortization of other acquired intangible assets                                                    20.2                   1.8                   -                    -                 22.0
       Total benefits and expenses                                                                  4,892.2                 472.5               166.1                 39.9              5,570.7
Operating earnings (loss), excluding income taxes (benefits)                                          695.9                  46.5                10.8                (39.9)               713.3
   Income taxes (benefits)                                                                            248.9                  11.9                  .2                (14.0)               247.0
Operating earnings (loss)                                                                             447.0                  34.6                10.6                (25.9)               466.3
Net realized capital gains, net of tax                                                                  2.3                   5.1                 2.7                    -                 10.1
Income (loss) from continuing operations                                                    $         449.3       $          39.7     $          13.3      $         (25.9)     $         476.4


Three Months Ended September 30, 2005
Revenue:
   Premiums                                                                                 $       4,291.3       $         438.1     $          56.1      $               -    $       4,785.5
   Fees and other revenue                                                                             616.0                   7.8                 3.0                      -              626.8
   Net investment income                                                                               76.9                  78.8               124.2                      -              279.9
       Total revenue, excluding net realized capital gains (2)                                      4,984.2                 524.7               183.3                      -            5,692.2
Benefits and expenses:
   Health care costs (4)                                                                            3,390.4                     -                   -                      -            3,390.4
   Current and future benefits                                                                            -                 418.4               163.4                      -              581.8
   Operating expenses:
       Selling expenses                                                                               193.5                  20.6                   -                    -                214.1
       General and administrative expenses                                                            838.3                  41.7                 5.1                    -                885.1
           Total operating expenses                                                                 1,031.8                  62.3                 5.1                    -              1,099.2
   Interest expense                                                                                       -                     -                   -                 32.5                 32.5
   Amortization of other acquired intangible assets                                                    15.9                     -                   -                    -                 15.9
       Total benefits and expenses                                                                  4,438.1                 480.7               168.5                 32.5              5,119.8
Operating earnings (loss), excluding income taxes (benefits)                                          546.1                  44.0                14.8                (32.5)               572.4
   Income taxes (benefits)                                                                            199.6                  11.7                 5.2                (11.4)               205.1
Operating earnings (loss)                                                                             346.5                  32.3                 9.6                (21.1)               367.3
Net realized capital gains, net of tax                                                                  1.2                   3.3                 1.0                    -                  5.5
Income (loss) from continuing operations                                                    $         347.7       $          35.6     $          10.6      $         (21.1)     $         372.8

(1) Effective January 1, 2006, the Company adopted FAS 123R applying the modified retrospective approach. Accordingly, all prior-period financial information was adjusted to reflect the Company's
    stock-based compensation activity.
(2) Refer to pages 11-13 for reconciliations of revenue calculated under GAAP for all periods.
(3) Includes favorable development of prior-period health care cost estimates of approximately $45 million pretax (approximately $29 million after tax) in the Health Care Segment.
(4) Includes favorable development of prior-period health care cost estimates of approximately $24 million pretax (approximately $15 million after tax) in the Health Care Segment.

Refer to page 14 for definitions of terms used.

                                                                                                                                                                                                      5
Consolidating Statements of Income (Loss) from Continuing Operations by Segment (Continued) (1)
                                                                                             ($ in Millions)


                                                                                                            Health                 Group              Large Case          Corporate
Nine Months Ended September 30, 2006                                                                         Care                Insurance             Pensions            Interest       Consolidated
Revenue:
   Premiums                                                                                             $     14,308.3       $       1,331.0      $         151.5     $               -   $    15,790.8
   Fees and other revenue                                                                                      2,052.7                  60.1                  8.6                     -         2,121.4
   Net investment income                                                                                         249.3                 219.8                383.0                     -           852.1
       Total revenue, excluding net realized capital gains (2)                                                16,610.3               1,610.9                543.1                     -        18,764.3
Benefits and expenses:
   Health care costs                                                                                          11,481.9                     -                    -                     -        11,481.9
   Current and future benefits                                                                                       -               1,243.8                489.8                     -         1,733.6
   Operating expenses:
       Selling expenses                                                                                          651.2                  64.1                    -                   -             715.3
       General and administrative expenses                                                                     2,610.1                 160.5                 12.6                   -           2,783.2
           Total operating expenses                                                                            3,261.3                 224.6                 12.6                   -           3,498.5
   Interest expense                                                                                                  -                     -                    -               107.2             107.2
   Amortization of other acquired intangible assets                                                               60.2                   3.5                    -                   -              63.7
       Total benefits and expenses                                                                            14,803.4               1,471.9                502.4               107.2          16,884.9
Operating earnings (loss), excluding income taxes (benefits)                                                   1,806.9                 139.0                 40.7              (107.2)          1,879.4
   Income taxes (benefits)                                                                                       646.4                  36.2                 10.7               (37.6)            655.7
Operating earnings (loss)                                                                                      1,160.5                 102.8                 30.0               (69.6)          1,223.7
Debt refinancing charge, net of tax                                                                               (8.1)                    -                    -                   -              (8.1)
Physician class action settlement insurance-related charge, net of tax                                           (47.1)                    -                    -                   -             (47.1)
Reduction of reserve for anticipated future losses on discontinued products, net of tax                              -                     -                 75.0                   -              75.0
Acquisition-related software charge, net of tax                                                                      -                  (6.2)                   -                   -              (6.2)
Net realized capital gains, net of tax                                                                             1.5                   2.7                 10.0                   -              14.2
Income (loss) from continuing operations                                                                $      1,106.8       $          99.3      $         115.0     $         (69.6)    $     1,251.5


Nine Months Ended September 30, 2005
Revenue:
   Premiums                                                                                             $     12,490.5       $       1,336.7      $         157.7     $               -   $    13,984.9
   Fees and other revenue                                                                                      1,760.5                  24.3                  8.5                     -         1,793.3
   Net investment income                                                                                         218.2                 216.2                393.3                     -           827.7
       Total revenue, excluding net realized capital gains (2)                                                14,469.2               1,577.2                559.5                     -        16,605.9
Benefits and expenses:
   Health care costs                                                                                            9,683.6                    -                    -                     -         9,683.6
   Current and future benefits                                                                                        -              1,264.8                513.6                     -         1,778.4
   Operating expenses:
       Selling expenses                                                                                          562.5                  60.5                    -                   -             623.0
       General and administrative expenses                                                                     2,534.5                 125.7                 13.3                   -           2,673.5
           Total operating expenses                                                                            3,097.0                 186.2                 13.3                   -           3,296.5
   Interest expense                                                                                                  -                     -                    -                90.2              90.2
   Amortization of other acquired intangible assets                                                               38.1                     -                    -                   -              38.1
       Total benefits and expenses                                                                            12,818.7               1,451.0                526.9                90.2          14,886.8
Operating earnings (loss), excluding income taxes (benefits)                                                   1,650.5                 126.2                 32.6               (90.2)          1,719.1
   Income taxes (benefits)                                                                                       604.3                  33.5                 11.4               (31.6)            617.6
Operating earnings (loss)                                                                                      1,046.2                  92.7                 21.2               (58.6)          1,101.5
Reduction of reserve for anticipated future losses on discontinued products, net of tax                              -                     -                 43.4                   -              43.4
Net realized capital gains, net of tax                                                                             5.0                   6.6                   .5                   -              12.1
Income (loss) from continuing operations                                                                $      1,051.2       $          99.3      $          65.1     $         (58.6)    $     1,157.0


(1) Effective January 1, 2006, the Company adopted FAS 123R applying the modified retrospective approach. Accordingly, all prior-period financial information was adjusted to reflect
    the Company's stock-based compensation activity.
(2) Refer to pages 11-13 for reconciliations of revenue calculated under GAAP for all periods.

Refer to page 14 for definitions of terms used.
                                                                                                                                                                                                           6
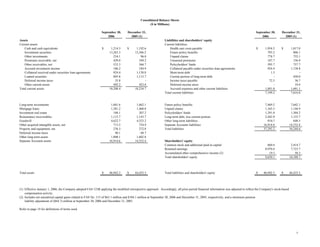
Consolidated Balance Sheets
                                                                                                    ($ in Millions)

                                                               September 30,       December 31,                                                                                      September 30,       December 31,
                                                                   2006              2005 (1)                                                                                            2006              2005 (1)
Assets                                                                                                         Liabilities and shareholders' equity
Current assets:                                                                                                Current liabilities:
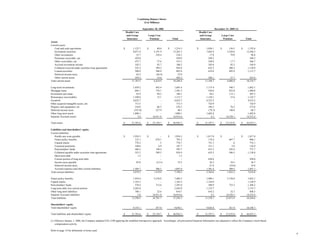
    Cash and cash equivalents                                  $      1,214.3     $      1,192.6                   Health care costs payable                                         $      1,954.5      $         1,817.0
    Investment securities                                            13,263.3           13,366.2                   Future policy benefits                                                     793.2                  806.1
    Other investments                                                   234.1               96.8                   Unpaid claims                                                              778.7                  752.1
    Premiums receivable, net                                            429.0              349.2                   Unearned premiums                                                          187.7                  156.9
    Other receivables, net                                              533.3              366.7                   Policyholders' funds                                                       595.7                  757.7
    Accrued investment income                                           186.2              184.9                   Collateral payable under securities loan agreements                        924.4                1,138.8
    Collateral received under securities loan agreements                924.4            1,138.8                   Short-term debt                                                              1.5                      -
    Loaned securities                                                   895.8            1,115.7                   Current portion of long-term debt                                              -                  450.0
    Deferred income taxes                                                35.8                  -                   Income taxes payable                                                        72.5                   36.7
    Other current assets                                                492.2              423.8                   Deferred income taxes                                                          -                   10.4
Total current assets                                                 18,208.4           18,234.7                   Accrued expenses and other current liabilities                           1,891.0                1,691.1
                                                                                                               Total current liabilities                                                    7,199.2                7,616.8


Long-term investments                                                 1,681.6            1,662.1               Future policy benefits                                                       7,469.2                7,642.1
Mortgage loans                                                        1,381.2            1,460.8               Unpaid claims                                                                1,165.5                1,144.9
Investment real estate                                                  188.1              207.2               Policyholders' funds                                                         1,291.0                1,304.2
Reinsurance recoverables                                              1,115.7            1,143.7               Long-term debt, less current portion                                         2,442.0                1,155.7
Goodwill                                                              4,622.7            4,523.2               Other long-term liabilities                                                    810.7                  848.5
Other acquired intangible assets, net                                   713.5              724.9               Separate Accounts liabilities                                               16,914.6               14,532.4
Property and equipment, net                                             276.3              272.8               Total liabilities                                                           37,292.2               34,244.6
Deferred income taxes                                                    40.1               68.7
Other long-term assets                                                1,800.1            1,602.8
Separate Accounts assets                                             16,914.6           14,532.4               Shareholders' equity
                                                                                                               Common stock and additional paid-in capital                                    660.4                2,414.7
                                                                                                               Retained earnings                                                            8,970.4                7,723.7
                                                                                                               Accumulated other comprehensive income (2)                                      19.3                   50.3
                                                                                                               Total shareholders' equity                                                   9,650.1               10,188.7


Total assets                                                   $     46,942.3     $     44,433.3               Total liabilities and shareholders' equity                            $     46,942.3      $        44,433.3


(1) Effective January 1, 2006, the Company adopted FAS 123R applying the modified retrospective approach. Accordingly, all prior-period financial information was adjusted to reflect the Company's stock-based
    compensation activity.
(2) Includes net unrealized capital gains related to FAS No. 115 of $63.1 million and $104.1 million at September 30, 2006 and December 31, 2005, respectively, and a minimum pension
    liability adjustment of ($64.7) million at September 30, 2006 and December 31, 2005.

Refer to page 14 for definitions of terms used.


                                                                                                                                                                                                                       7
Combining Balance Sheets
                                                                                        ($ in Millions)

                                                                                           September 30, 2006                                                   December 31, 2005 (1)
                                                                          Health Care                                                           Health Care
                                                                          and Group            Large Case                                       and Group             Large Case
                                                                           Insurance            Pensions            Total                        Insurance             Pensions             Total
Assets
Current assets:
   Cash and cash equivalents                                          $         1,125.7        $       88.6     $     1,214.3               $         1,036.1        $       156.5      $    1,192.6
   Investment securities                                                        8,071.4             5,191.9          13,263.3                         7,845.6              5,520.6          13,366.2
   Other investments                                                               23.7               210.4             234.1                            17.8                 79.0              96.8
   Premiums receivable, net                                                       429.0                   -             429.0                           349.2                    -             349.2
   Other receivables, net                                                         475.7                57.6             533.3                           349.0                 17.7             366.7
   Accrued investment income                                                      102.5                83.7             186.2                           102.6                 82.3             184.9
   Collateral received under securities loan agreements                           525.2               399.2             924.4                           632.5                506.3           1,138.8
   Loaned securities                                                              508.9               386.9             895.8                           619.8                495.9           1,115.7
   Deferred income taxes                                                           62.2               (26.4)             35.8                               -                    -                 -
   Other current assets                                                           459.2                33.0             492.2                           396.1                 27.7             423.8
Total current assets                                                           11,783.5             6,424.9          18,208.4                        11,348.7              6,886.0          18,234.7

Long-term investments                                                           1,039.2               642.4           1,681.6                         1,115.4                546.7           1,662.1
Mortgage loans                                                                    605.1               776.1           1,381.2                           538.8                922.0           1,460.8
Investment real estate                                                             93.9                94.2             188.1                            94.1                113.1             207.2
Reinsurance recoverables                                                        1,100.6                15.1           1,115.7                         1,128.1                 15.6           1,143.7
Goodwill                                                                        4,622.7                   -           4,622.7                         4,523.2                    -           4,523.2
Other acquired intangible assets, net                                             713.5                   -             713.5                           724.9                    -             724.9
Property and equipment, net                                                       210.0                66.3             276.3                           196.5                 76.3             272.8
Deferred income taxes                                                            (187.8)              227.9              40.1                           (79.3)               148.0              68.7
Other long-term assets                                                          1,800.1                   -           1,800.1                         1,602.8                    -           1,602.8
Separate Accounts assets                                                            2.8            16,911.8          16,914.6                             4.3             14,528.1          14,532.4

Total assets                                                          $        21,783.6        $   25,158.7     $    46,942.3               $        21,197.5        $    23,235.8      $   44,433.3

Liabilities and shareholders' equity
Current liabilities:
   Health care costs payable                                          $         1,954.5        $          -     $     1,954.5               $         1,817.0        $           -      $    1,817.0
   Future policy benefits                                                         123.1               670.1             793.2                           118.4                687.7             806.1
   Unpaid claims                                                                  778.2                  .5             778.7                           751.5                   .6             752.1
   Unearned premiums                                                              180.8                 6.9             187.7                           151.1                  5.8             156.9
   Policyholders' funds                                                           446.3               149.4             595.7                           415.3                342.4             757.7
   Collateral payable under securities loan agreements                            525.2               399.2             924.4                           632.5                506.3           1,138.8
   Short-term debt                                                                  1.5                   -               1.5                               -                    -                 -
   Current portion of long-term debt                                                  -                   -                 -                           450.0                    -             450.0
   Income taxes payable                                                            85.0               (12.5)             72.5                            26.2                 10.5              36.7
   Deferred income taxes                                                              -                   -                 -                            21.0                (10.6)             10.4
   Accrued expenses and other current liabilities                               1,584.7               306.3           1,891.0                         1,381.6                309.5           1,691.1
Total current liabilities                                                       5,679.3             1,519.9           7,199.2                         5,764.6              1,852.2           7,616.8

Future policy benefits                                                          1,934.4             5,534.8           7,469.2                         1,904.1              5,738.0           7,642.1
Unpaid claims                                                                   1,165.5                   -           1,165.5                         1,144.9                    -           1,144.9
Policyholders' funds                                                              578.4               712.6           1,291.0                           580.9                723.3           1,304.2
Long-term debt, less current portion                                            2,442.0                   -           2,442.0                         1,155.7                    -           1,155.7
Other long-term liabilities                                                       788.1                22.6             810.7                           816.2                 32.3             848.5
Separate Accounts liabilities                                                       2.8            16,911.8          16,914.6                             4.3             14,528.1          14,532.4
Total liabilities                                                              12,590.5            24,701.7          37,292.2                        11,370.7             22,873.9          34,244.6

Shareholders' equity
Total shareholders' equity                                                      9,193.1               457.0           9,650.1                         9,826.8               361.9           10,188.7

Total liabilities and shareholders' equity                            $        21,783.6        $   25,158.7     $    46,942.3               $        21,197.5        $    23,235.8      $   44,433.3

(1) Effective January 1, 2006, the Company adopted FAS 123R applying the modified retrospective approach. Accordingly, all prior-period financial information was adjusted to reflect the Company's stock-based
    compensation activity.

Refer to page 14 for definitions of terms used.
                                                                                                                                                                                                                  8
Condensed Combining Statements of Cash Flows
                                                                                              ($ in Millions)


                                                                                                                                     Three Months Ended

                                                                                                       Sep. 30, 2006                                                    Sep. 30, 2005 (1)
                                                                                    Health Care                                                        Health Care
                                                                                    and Group            Large Case                                    and Group           Large Case
                                                                                     Insurance            Pensions               Total                  Insurance           Pensions                Total
Cash flows from operating activities:
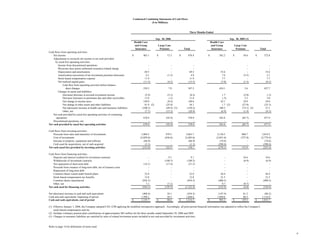
    Net income                                                                  $          463.1        $       13.3         $      476.4          $          362.2       $         10.6        $       372.8
    Adjustments to reconcile net income to net cash provided
      by (used for) operating activities:
         Income from discontinued operations                                                    -                   -                    -                                             -                    -
         Physician class action settlement insurance-related charge                             -                   -                    -                                             -                    -
         Depreciation and amortization                                                       69.5                   -                 69.5                     53.6                    -                 53.6
         Amortization (accretion) of net investment premium (discount)                        6.1                (1.2)                 4.9                      7.6                 (5.5)                 2.1
         Stock-based compensation expense                                                    11.9                   -                 11.9                      7.7                    -                  7.7
         Net realized capital gains                                                         (11.3)               (4.2)               (15.5)                    (7.0)                (1.5)                (8.5)
             Cash flow from operating activities before balance
                sheet changes                                                              539.3                  7.9               547.2                     424.1                  3.6                427.7
         Changes in assets and liabilities:
             (Increase) decrease in accrued investment income                               (2.9)                (3.3)               (6.2)                      1.7                 (2.0)                  (.3)
             Decrease (increase) in premiums due and other receivables                      11.6                  (.2)               11.4                       (.3)                 3.3                   3.0
             Net change in income taxes                                                    149.0                 (8.4)              140.6                      43.1                 10.9                  54.0
             Net change in other assets and other liabilities                               81.9 (2)            (25.8)               56.1                       1.7 (2)            (27.0)                (25.3)
             Net (decrease) increase in health care and insurance liabilities             (100.3)               (49.9) (3)         (150.2)                    100.2                (73.1) (3)             27.1
             Other, net                                                                     (7.7)               (13.2)              (20.9)                     (6.9)                (1.4)                 (8.3)
    Net cash provided by (used for) operating activities of continuing
       operations                                                                          670.9                (92.9)              578.0                     563.6                (85.7)               477.9
    Discontinued operations, net                                                               -                    -                   -                         -                    -                    -
Net cash provided by (used for) operating activities                                       670.9                (92.9)              578.0                     563.6                (85.7)               477.9

Cash flows from investing activities:
    Proceeds from sales and maturities of investments                                     1,884.2              979.5               2,863.7                   2,138.5               880.7               3,019.2
    Cost of investments                                                                  (2,029.0)            (656.6)             (2,685.6)                 (2,051.6)             (727.8)             (2,779.4)
    Increase in property, equipment and software                                            (66.9)                 -                 (66.9)                    (74.6)                  -                 (74.6)
    Cash used for acquisitions, net of cash acquired                                         (1.1)                 -                  (1.1)                   (390.4)                  -                (390.4)
Net cash (used for) provided by investing activities                                       (212.8)             322.9                 110.1                    (378.1)              152.9                (225.2)

Cash flows from financing activities:
    Deposits and interest credited for investment contracts                                    -                 9.1                   9.1                        -                 10.6                 10.6
    Withdrawals of investment contracts                                                        -              (180.5)               (180.5)                       -                 (6.9)                (6.9)
    Net repayment of short-term debt                                                       (14.1)              (17.4)                (31.5)                       -                    -                    -
    Proceeds from issuance of long-term debt, net of issuance costs                            -                   -                     -                        -                    -                    -
    Repayment of long-term debt                                                                -                   -                     -                        -                    -                    -
    Common shares issued under benefit plans                                                22.0                   -                  22.0                     44.4                    -                 44.4
    Stock-based compensation tax benefits                                                   12.8                   -                  12.8                     21.5                    -                 21.5
    Common shares repurchased                                                             (954.3)                  -                (954.3)                  (408.5)                   -               (408.5)
    Other, net                                                                               7.1                (7.1)                    -                      9.7                 (9.7)                   -
Net cash used for financing activities                                                    (926.5)             (195.9)             (1,122.4)                  (332.9)                (6.0)              (338.9)

Net (decrease) increase in cash and cash equivalents                                      (468.4)               34.1               (434.3)                   (147.4)               61.2                 (86.2)
Cash and cash equivalents, beginning of period                                           1,594.1                54.5              1,648.6                   1,050.6                68.3               1,118.9
Cash and cash equivalents, end of period                                        $        1,125.7        $       88.6         $    1,214.3          $          903.2       $       129.5         $     1,032.7

(1) Effective January 1, 2006, the Company adopted FAS 123R applying the modified retrospective approach. Accordingly, all prior-period financial information was adjusted to reflect the Company's
    stock-based compensation activity.
(2) Includes voluntary pension plan contributions of approximately $65 million for the three months ended September 30, 2006 and 2005.
(3) Changes in insurance liabilities are satisfied by sales of related investment assets included in net cash provided by investment activities.


Refer to page 14 for definitions of terms used.

                                                                                                                                                                                                                  9
Condensed Combining Statements of Cash Flows (Continued)
                                                                                                    ($ in Millions)


                                                                                                                                                 Nine Months Ended

                                                                                                               Sep. 30, 2006                                                       Sep. 30, 2005 (1)
                                                                                           Health Care                                                            Health Care
                                                                                           and Group             Large Case                                       and Group           Large Case
                                                                                            Insurance             Pensions               Total                     Insurance           Pensions                Total
Cash flows from operating activities:
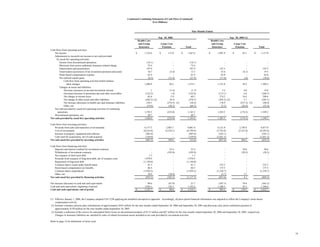
    Net income                                                                         $        1,152.6         $      115.0         $    1,267.6             $        1,091.9        $        65.1        $    1,157.0
    Adjustments to reconcile net income to net cash provided
      by (used for) operating activities:
         Income from discontinued operations                                                      (16.1)                    -               (16.1)                           -                    -                      -
         Physician class action settlement insurance-related charge                                72.4                     -                72.4                            -                    -                      -
         Depreciation and amortization                                                            197.9                     -               197.9                        147.5                    -                  147.5
         Amortization (accretion) of net investment premium (discount)                             18.7                  (5.4)               13.3                         25.6                 (6.1)                  19.5
         Stock-based compensation expense                                                          61.9                     -                61.9                         83.8                    -                   83.8
         Net realized capital gains                                                                (6.5)                (15.4)              (21.9)                       (17.8)                 (.8)                 (18.6)
             Cash flow from operating activities before balance
                sheet changes                                                                   1,480.9                  94.2             1,575.1                      1,331.0                 58.2             1,389.2
         Changes in assets and liabilities:
             Decrease (increase) in accrued investment income                                        .1                  (1.4)               (1.3)                         5.2                  6.8                12.0
             (Increase) decrease in premiums due and other receivables                           (122.2)                  (.4)             (122.6)                      (113.1)                 6.4              (106.7)
             Net change in income taxes                                                            62.6                   5.9                68.5                        274.2                 16.4               290.6
             Net change in other assets and other liabilities                                    (262.2) (2)             (8.5)             (270.7)                      (385.2) (2)             2.1              (383.1)
             Net increase (decrease) in health care and insurance liabilities                     238.1                (274.5) (3)          (36.4)                       176.9               (237.3) (3)          (60.4)
             Other, net                                                                           (19.0)                (50.3)              (69.3)                        (5.5)               (26.9)              (32.4)
    Net cash provided by (used for) operating activities of continuing
       operations                                                                               1,378.3                (235.0)            1,143.3                      1,283.5               (174.3)            1,109.2
    Discontinued operations, net                                                                   49.7                     -                49.7                            -                    -                   -
Net cash provided by (used for) operating activities                                            1,428.0                (235.0)            1,193.0                      1,283.5               (174.3)            1,109.2

Cash flows from investing activities:
    Proceeds from sales and maturities of investments                                            6,177.3              2,883.7              9,061.0                      6,121.0             2,756.0              8,877.0
    Cost of investments                                                                         (6,216.8)            (2,534.1)            (8,750.9)                    (5,743.8)           (2,551.8)            (8,295.6)
    Increase in property, equipment and software                                                  (203.8)                   -               (203.8)                      (183.1)                  -               (183.1)
    Cash used for acquisitions, net of cash acquired                                              (159.9)                   -               (159.9)                    (1,021.5)                  -             (1,021.5)
Net cash (used for) provided by investing activities                                              (403.2)               349.6                (53.6)                      (827.4)              204.2               (623.2)

Cash flows from financing activities:
    Deposits and interest credited for investment contracts                                            -                 23.4                 23.4                            -                30.6                 30.6
    Withdrawals of investment contracts                                                                -               (195.0)              (195.0)                           -               (30.2)               (30.2)
    Net issuance of short-term debt                                                                  1.5                    -                  1.5                            -                   -                    -
    Proceeds from issuance of long-term debt, net of issuance costs                              1,978.9                    -              1,978.9                            -                   -                    -
    Repayment of long-term debt                                                                 (1,150.0)                   -             (1,150.0)                           -                   -                    -
    Common shares issued under benefit plans                                                        81.3                    -                 81.3                        223.5                   -                223.5
    Stock-based compensation tax benefits                                                           66.5                    -                 66.5                        137.5                   -                137.5
    Common shares repurchased                                                                   (1,924.3)                   -             (1,924.3)                    (1,210.7)                  -             (1,210.7)
    Other, net                                                                                      10.9                (10.9)                   -                         (3.7)                3.7                    -
Net cash (used for) provided by financing activities                                              (935.2)              (182.5)            (1,117.7)                      (853.4)                4.1               (849.3)

Net increase (decrease) in cash and cash equivalents                                               89.6                (67.9)                21.7                       (397.3)               34.0               (363.3)
Cash and cash equivalents, beginning of period                                                  1,036.1                156.5              1,192.6                      1,300.5                95.5              1,396.0
Cash and cash equivalents, end of period                                               $        1,125.7         $       88.6         $    1,214.3             $          903.2        $      129.5         $    1,032.7


(1) Effective January 1, 2006, the Company adopted FAS 123R applying the modified retrospective approach. Accordingly, all prior-period financial information was adjusted to reflect the Company's stock-based
     compensation activity.
 (2) Includes voluntary pension plan contributions of approximately $245 million for the nine months ended September 30, 2006 and September 30, 2005 and physician class action settlement payment of
     approximately $150 million for the nine months ended September 30, 2005.
 (3) Includes a reduction of the reserve for anticipated future losses on discontinued products of $115 million and $67 million for the nine months ended September 30, 2006 and September 30, 2005, respectively.
     Changes in insurance liabilities are satisfied by sales of related investment assets included in net cash provided by investment activities.

Refer to page 14 for definitions of terms used.


                                                                                                                                                                                                                              10
Reconciliations of Certain Reported Amounts to the Most Directly Comparable GAAP Measure (1)
                                                                                              ($ in Millions, except per common share data)


                                                                                                                                        Three Months Ended                                        Nine Months Ended
                                                                                                                                  Sep. 30,              Sep. 30,                           Sep. 30,               Sep. 30,
                                                                                                                                    2006                  2005                               2006                   2005

Reconciliation to Income from continuing operations before income taxes
Operating earnings before income taxes, excluding interest expense, amortization of
    other acquired intangible assets and favorable development                                                   (A)         $           730.2         $            596.8
    Favorable development of prior-period health care cost estimates                                                                      45.0                       24.0
Operating earnings before income taxes, excluding interest expense and amortization
    of other acquired intangible assets                                                                          (B)                     775.2                      620.8             $          2,050.3         $          1,847.4
    Interest expense                                                                                                                     (39.9)                     (32.5)                        (107.2)                     (90.2)
    Amortization of other acquired intangible assets                                                                                     (22.0)                     (15.9)                         (63.7)                     (38.1)
    Debt refinancing charge                                                                                                                 -                          -                           (12.4)                        -
    Physician class action settlement insurance-related charge                                                                              -                          -                           (72.4)                        -
    Reduction of reserve for anticipated future losses on discontinued products                                                             -                          -                           115.4                       66.7
    Acquisition-related software charge                                                                                                     -                          -                            (8.3)                        -
    Net realized capital gains                                                                                                            15.5                        8.5                           21.9                       18.6
Income from continuing operations before income taxes (GAAP measure)                                             (C)         $           728.8         $            580.9             $          1,923.6         $          1,804.4

Reconciliation to Income from continuing operations
Operating earnings, excluding interest expense, amortization of other acquired
    intangible assets and favorable development                                                                  (D)         $           477.5         $            383.7
    Favorable development of prior-period health care cost estimates, net of tax                                                          29.0                       15.0
Operating earnings, excluding interest expense and amortization of other acquired
    intangible assets                                                                                            (E)                     506.5                      398.7             $          1,334.7         $          1,184.9
    Interest expense, net of tax                                                                                                         (25.9)                     (21.1)                         (69.6)                     (58.6)
    Amortization of other acquired intangible assets, net of tax                                                                         (14.3)                     (10.3)                         (41.4)                     (24.8)
    Debt refinancing charge, net of tax                                                                                                     -                          -                            (8.1)                        -
    Physician class action settlement insurance-related charge, net of tax                                                                  -                          -                           (47.1)                        -
    Reduction of reserve for anticipated future losses on discontinued products, net of tax                                                 -                          -                            75.0                       43.4
    Acquisition-related software charge, net of tax                                                                                         -                          -                            (6.2)                        -
    Net realized capita1 gains, net of tax                                                                                                10.1                        5.5                           14.2                       12.1
Income from continuing operations (GAAP measure)                                                                 (F)         $           476.4         $            372.8             $          1,251.5         $          1,157.0

Reconciliation of Revenue
Revenue, excluding net realized capital gains                                                                    (G)         $          6,284.0        $          5,692.2             $         18,764.3         $         16,605.9
    Net realized capital gains                                                                                                             15.5                       8.5                           21.9                       18.6
Total revenue (GAAP measure)                                                                                     (H)         $          6,299.5        $          5,700.7             $         18,786.2         $         16,624.5


Operating margin
Pretax operating margin                                                                                          (B)/(G)                      12.3 %                 10.9 %                          10.9 %                    11.1 %
Pretax operating margin - Adjusted                                                                               (A)/(G)                      11.6 %                 10.5 %
Pretax operating margin (GAAP measure)                                                                           (C)/(H)                      11.6 %                 10.2 %                          10.2 %                    10.9 %

After-tax operating margin                                                                                       (E)/(G)                      8.1 %                   7.0 %                           7.1 %                     7.1 %
After-tax operating margin - Adjusted                                                                            (D)/(G)                      7.6 %                   6.7 %
After-tax operating margin (GAAP measure)                                                                        (F)/(H)                      7.6 %                   6.5 %                           6.7 %                     7.0 %

(1) Effective January 1, 2006, the Company adopted FAS 123R applying the modified retrospective approach. Accordingly, all prior-period financial information was adjusted to reflect the Company's stock-based compensation activity.


Refer to page 14 for definitions of terms used.

                                                                                                                                                                                                                                         11
Reconciliations of Certain Reported Amounts to the Most Directly Comparable GAAP Measure (Continued) (1)
                                                                                    ($ in Millions)

                                                                                                  Three Months Ended                                 Nine Months Ended
                                                                                            Sep. 30,           Sep. 30,                         Sep. 30,           Sep. 30,
                                                                                             2006               2005                             2006                2005
Aetna Inc.

Reconciliation of Operating Expenses
Operating expenses, excluding other items                                    (A)        $      1,157.3        $      1,099.2                $      3,498.5        $      3,296.5
    Debt refinancing charge                                                                         -                     -                           12.4                    -
    Physician class action settlement insurance-related charge                                      -                     -                           72.4                    -
    Acquisition-related software charge                                                             -                     -                            8.3                    -
Total operating expenses (GAAP measure)                                      (B)        $      1,157.3        $      1,099.2                $      3,591.6        $      3,296.5

Reconciliation of Revenue
Revenue, excluding net realized capital gains                                (C)        $      6,284.0        $      5,692.2                $     18,764.3        $     16,605.9
    Net realized capital gains                                                                    15.5                   8.5                          21.9                  18.6
Total revenue (GAAP measure)                                                 (D)        $      6,299.5        $      5,700.7                $     18,786.2        $     16,624.5

Operating expenses as a % of revenue
Operating expenses as a % of revenue                                         (A)/(C)              18.4 %                 19.3 %                       18.6 %                 19.9 %
Total operating expenses as a % of total revenue   (GAAP measure)            (B)/(D)              18.4 %                 19.3 %                       19.1 %                 19.8 %


Health Care

Reconciliation of Operating Expenses
Operating expenses, excluding other items                                    (E)        $      1,074.6        $      1,031.8                $      3,261.3        $      3,097.0
    Debt refinancing charge                                                                         -                     -                           12.4                    -
    Physician class action settlement insurance-related charge                                      -                     -                           72.4                    -
Total operating expenses (GAAP measure)                                      (F)        $      1,074.6        $      1,031.8                $      3,346.1        $      3,097.0

Reconciliation of Revenue
Revenue, excluding net realized capital gains                                (G)        $      5,588.1        $      4,984.2                $     16,610.3        $     14,469.2
    Net realized capital gains                                                                     3.5                   1.9                           2.3                   7.7
Total revenue (GAAP measure)                                                 (H)        $      5,591.6        $      4,986.1                $     16,612.6        $     14,476.9

Operating expenses as a % of revenue
Operating expenses as a % of revenue                                         (E)/(G)              19.2 %                 20.7 %                       19.6 %                 21.4 %
Total operating expenses as a % of total revenue   (GAAP measure)            (F)/(H)              19.2 %                 20.7 %                       20.1 %                 21.4 %

(1) Effective January 1, 2006, the Company adopted FAS 123R applying the modified retrospective approach. Accordingly, all prior-period financial information was adjusted
    to reflect the Company's stock-based compensation activity.


Refer to page 14 for definitions of terms used.


                                                                                                                                                                                      12
aetna Financial Supplement 2006 3rd

More Related Content

What's hot

progressive mreport-03/08
 progressive mreport-03/08 progressive mreport-03/08
progressive mreport-03/08finance18
 
omnicom group Q4 2007 Investor Presentation
omnicom group  Q4 2007 Investor Presentationomnicom group  Q4 2007 Investor Presentation
omnicom group Q4 2007 Investor Presentationfinance22
 
Raytheon Reports 2008 Second Quarter Results
Raytheon Reports 2008 Second Quarter ResultsRaytheon Reports 2008 Second Quarter Results
Raytheon Reports 2008 Second Quarter Resultsfinance12
 
allstate Quarter Information2007 1st Earnings Press Release
allstate Quarter Information2007 1st Earnings Press Releaseallstate Quarter Information2007 1st Earnings Press Release
allstate Quarter Information2007 1st Earnings Press Releasefinance7
 
baxter international Schedules_Q2-05
baxter international Schedules_Q2-05baxter international Schedules_Q2-05
baxter international Schedules_Q2-05finance24
 
allstate Quarter Information 2007 4th Earnings Press Release
allstate Quarter Information 2007 4th Earnings Press Releaseallstate Quarter Information 2007 4th Earnings Press Release
allstate Quarter Information 2007 4th Earnings Press Releasefinance7
 
AES 2Q 2006 AE SFinancial
AES 2Q 2006 AE SFinancialAES 2Q 2006 AE SFinancial
AES 2Q 2006 AE SFinancialfinance19
 
omnicom group Q3 2007 Investor Presentation
omnicom group  Q3 2007 Investor Presentationomnicom group  Q3 2007 Investor Presentation
omnicom group Q3 2007 Investor Presentationfinance22
 
progressive mreport-03/05
progressive mreport-03/05progressive mreport-03/05
progressive mreport-03/05finance18
 
ecolab 2002BusinessDescription
ecolab  2002BusinessDescriptionecolab  2002BusinessDescription
ecolab 2002BusinessDescriptionfinance37
 
entergy 2006 AR FINAL
 	 entergy  2006 AR FINAL 	 entergy  2006 AR FINAL
entergy 2006 AR FINALfinance24
 
.progressive mreport-03/06
.progressive mreport-03/06.progressive mreport-03/06
.progressive mreport-03/06finance18
 
merck 2Q08 Other Financial Disclosures
merck  	2Q08 Other Financial Disclosuresmerck  	2Q08 Other Financial Disclosures
merck 2Q08 Other Financial Disclosuresfinance11
 
owens & minor 2002ar
owens & minor  2002arowens & minor  2002ar
owens & minor 2002arfinance33
 

What's hot (15)

progressive mreport-03/08
 progressive mreport-03/08 progressive mreport-03/08
progressive mreport-03/08
 
omnicom group Q4 2007 Investor Presentation
omnicom group  Q4 2007 Investor Presentationomnicom group  Q4 2007 Investor Presentation
omnicom group Q4 2007 Investor Presentation
 
Raytheon Reports 2008 Second Quarter Results
Raytheon Reports 2008 Second Quarter ResultsRaytheon Reports 2008 Second Quarter Results
Raytheon Reports 2008 Second Quarter Results
 
allstate Quarter Information2007 1st Earnings Press Release
allstate Quarter Information2007 1st Earnings Press Releaseallstate Quarter Information2007 1st Earnings Press Release
allstate Quarter Information2007 1st Earnings Press Release
 
dte_3q2000
dte_3q2000dte_3q2000
dte_3q2000
 
baxter international Schedules_Q2-05
baxter international Schedules_Q2-05baxter international Schedules_Q2-05
baxter international Schedules_Q2-05
 
allstate Quarter Information 2007 4th Earnings Press Release
allstate Quarter Information 2007 4th Earnings Press Releaseallstate Quarter Information 2007 4th Earnings Press Release
allstate Quarter Information 2007 4th Earnings Press Release
 
AES 2Q 2006 AE SFinancial
AES 2Q 2006 AE SFinancialAES 2Q 2006 AE SFinancial
AES 2Q 2006 AE SFinancial
 
omnicom group Q3 2007 Investor Presentation
omnicom group  Q3 2007 Investor Presentationomnicom group  Q3 2007 Investor Presentation
omnicom group Q3 2007 Investor Presentation
 
progressive mreport-03/05
progressive mreport-03/05progressive mreport-03/05
progressive mreport-03/05
 
ecolab 2002BusinessDescription
ecolab  2002BusinessDescriptionecolab  2002BusinessDescription
ecolab 2002BusinessDescription
 
entergy 2006 AR FINAL
 	 entergy  2006 AR FINAL 	 entergy  2006 AR FINAL
entergy 2006 AR FINAL
 
.progressive mreport-03/06
.progressive mreport-03/06.progressive mreport-03/06
.progressive mreport-03/06
 
merck 2Q08 Other Financial Disclosures
merck  	2Q08 Other Financial Disclosuresmerck  	2Q08 Other Financial Disclosures
merck 2Q08 Other Financial Disclosures
 
owens & minor 2002ar
owens & minor  2002arowens & minor  2002ar
owens & minor 2002ar
 

Viewers also liked

Authentic Personal Branding
Authentic Personal BrandingAuthentic Personal Branding
Authentic Personal BrandingChris Bailey
 
БИТ:Управление доступом 8
БИТ:Управление доступом 8БИТ:Управление доступом 8
БИТ:Управление доступом 8bitkiev
 
Factorización de polinomios-EMDH
Factorización de polinomios-EMDHFactorización de polinomios-EMDH
Factorización de polinomios-EMDH
Adela M. Ramos
 
marriott international 2006 10-K
marriott international 2006 10-Kmarriott international 2006 10-K
marriott international 2006 10-Kfinance20
 
public serviceenterprise group AGA Financial Forum
public serviceenterprise group AGA Financial Forumpublic serviceenterprise group AGA Financial Forum
public serviceenterprise group AGA Financial Forumfinance20
 
Expo Cci Port De Co Mars09
Expo Cci Port De Co Mars09Expo Cci Port De Co Mars09
Expo Cci Port De Co Mars09
abeilleiroise
 
public serviceenterprise group european_trip
public serviceenterprise group european_trippublic serviceenterprise group european_trip
public serviceenterprise group european_tripfinance20
 
sun trust banks 3Q 2004 10-Q
sun trust banks 	3Q 2004 10-Qsun trust banks 	3Q 2004 10-Q
sun trust banks 3Q 2004 10-Qfinance20
 
Snowmobile Rides article
Snowmobile Rides articleSnowmobile Rides article
Snowmobile Rides articleRob Bick
 
Knivsta IK F04-03 - Föräldramöte 16/10 -16
Knivsta IK F04-03 - Föräldramöte 16/10 -16Knivsta IK F04-03 - Föräldramöte 16/10 -16
Knivsta IK F04-03 - Föräldramöte 16/10 -16
jenslindquist
 
public serviceenterprise group CapReOFlynn
public serviceenterprise group CapReOFlynnpublic serviceenterprise group CapReOFlynn
public serviceenterprise group CapReOFlynnfinance20
 
Punks
PunksPunks
manuel_servais_2012-2013_defence_stage_IAGL
manuel_servais_2012-2013_defence_stage_IAGLmanuel_servais_2012-2013_defence_stage_IAGL
manuel_servais_2012-2013_defence_stage_IAGLManuel Servais
 
2007 11 07 Presentazione Ir In Asm
2007 11 07 Presentazione Ir In Asm2007 11 07 Presentazione Ir In Asm
2007 11 07 Presentazione Ir In Asm
lavegas
 
Test Ppt
Test PptTest Ppt
Test Ppt
Thomazz
 

Viewers also liked (20)

GPBC Slideshow
GPBC SlideshowGPBC Slideshow
GPBC Slideshow
 
Authentic Personal Branding
Authentic Personal BrandingAuthentic Personal Branding
Authentic Personal Branding
 
БИТ:Управление доступом 8
БИТ:Управление доступом 8БИТ:Управление доступом 8
БИТ:Управление доступом 8
 
Factorización de polinomios-EMDH
Factorización de polinomios-EMDHFactorización de polinomios-EMDH
Factorización de polinomios-EMDH
 
Affordable Housing Lecture Cnu 17
Affordable Housing Lecture Cnu 17Affordable Housing Lecture Cnu 17
Affordable Housing Lecture Cnu 17
 
marriott international 2006 10-K
marriott international 2006 10-Kmarriott international 2006 10-K
marriott international 2006 10-K
 
IndúStria TèXtil
IndúStria TèXtilIndúStria TèXtil
IndúStria TèXtil
 
public serviceenterprise group AGA Financial Forum
public serviceenterprise group AGA Financial Forumpublic serviceenterprise group AGA Financial Forum
public serviceenterprise group AGA Financial Forum
 
Expo Cci Port De Co Mars09
Expo Cci Port De Co Mars09Expo Cci Port De Co Mars09
Expo Cci Port De Co Mars09
 
public serviceenterprise group european_trip
public serviceenterprise group european_trippublic serviceenterprise group european_trip
public serviceenterprise group european_trip
 
sun trust banks 3Q 2004 10-Q
sun trust banks 	3Q 2004 10-Qsun trust banks 	3Q 2004 10-Q
sun trust banks 3Q 2004 10-Q
 
Snowmobile Rides article
Snowmobile Rides articleSnowmobile Rides article
Snowmobile Rides article
 
Knivsta IK F04-03 - Föräldramöte 16/10 -16
Knivsta IK F04-03 - Föräldramöte 16/10 -16Knivsta IK F04-03 - Föräldramöte 16/10 -16
Knivsta IK F04-03 - Föräldramöte 16/10 -16
 
public serviceenterprise group CapReOFlynn
public serviceenterprise group CapReOFlynnpublic serviceenterprise group CapReOFlynn
public serviceenterprise group CapReOFlynn
 
Punks
PunksPunks
Punks
 
manuel_servais_2012-2013_defence_stage_IAGL
manuel_servais_2012-2013_defence_stage_IAGLmanuel_servais_2012-2013_defence_stage_IAGL
manuel_servais_2012-2013_defence_stage_IAGL
 
green streets_richards
green streets_richardsgreen streets_richards
green streets_richards
 
Choosing The Right Image
Choosing The Right ImageChoosing The Right Image
Choosing The Right Image
 
2007 11 07 Presentazione Ir In Asm
2007 11 07 Presentazione Ir In Asm2007 11 07 Presentazione Ir In Asm
2007 11 07 Presentazione Ir In Asm
 
Test Ppt
Test PptTest Ppt
Test Ppt
 

Similar to aetna Financial Supplement 2006 3rd

progressive mreport-03/07
progressive mreport-03/07progressive mreport-03/07
progressive mreport-03/07finance18
 
progressive mreport-03/07
progressive mreport-03/07progressive mreport-03/07
progressive mreport-03/07finance18
 
progressive mreport-05/07
progressive mreport-05/07progressive mreport-05/07
progressive mreport-05/07finance18
 
progressive mreport-05/07
progressive mreport-05/07progressive mreport-05/07
progressive mreport-05/07finance18
 
progressive mreport-12/07
progressive mreport-12/07progressive mreport-12/07
progressive mreport-12/07finance18
 
progressive mreport-12/07
progressive mreport-12/07progressive mreport-12/07
progressive mreport-12/07finance18
 
progressive mreport-12/05
progressive mreport-12/05progressive mreport-12/05
progressive mreport-12/05finance18
 
progressive mreport-12/05
progressive mreport-12/05progressive mreport-12/05
progressive mreport-12/05finance18
 
progressive mreport-09/07
progressive mreport-09/07progressive mreport-09/07
progressive mreport-09/07finance18
 
progressive mreport-09/07
progressive mreport-09/07progressive mreport-09/07
progressive mreport-09/07finance18
 
progressive mreport-03/08
 progressive mreport-03/08 progressive mreport-03/08
progressive mreport-03/08finance18
 
.progressive mreport-03/06
.progressive mreport-03/06.progressive mreport-03/06
.progressive mreport-03/06finance18
 
110212 divulgação de resultados 4 t10 ingles
110212   divulgação de resultados 4 t10 ingles110212   divulgação de resultados 4 t10 ingles
110212 divulgação de resultados 4 t10 inglesMultiplus
 
First Quarter GAAP Reconciliations
First Quarter GAAP ReconciliationsFirst Quarter GAAP Reconciliations
First Quarter GAAP Reconciliationsfinance4
 
.progressive mreport-04/06
.progressive mreport-04/06.progressive mreport-04/06
.progressive mreport-04/06finance18
 
.progressive mreport-0406
.progressive mreport-0406.progressive mreport-0406
.progressive mreport-0406finance18
 
2Q11 Earnings Presentation
 2Q11 Earnings Presentation  2Q11 Earnings Presentation
2Q11 Earnings Presentation Multiplus
 
progressive mreport-01/08
 progressive mreport-01/08 progressive mreport-01/08
progressive mreport-01/08finance18
 
progressive mreport-01/08
 progressive mreport-01/08 progressive mreport-01/08
progressive mreport-01/08finance18
 

Similar to aetna Financial Supplement 2006 3rd (20)

progressive mreport-03/07
progressive mreport-03/07progressive mreport-03/07
progressive mreport-03/07
 
progressive mreport-03/07
progressive mreport-03/07progressive mreport-03/07
progressive mreport-03/07
 
progressive mreport-05/07
progressive mreport-05/07progressive mreport-05/07
progressive mreport-05/07
 
progressive mreport-05/07
progressive mreport-05/07progressive mreport-05/07
progressive mreport-05/07
 
progressive mreport-12/07
progressive mreport-12/07progressive mreport-12/07
progressive mreport-12/07
 
progressive mreport-12/07
progressive mreport-12/07progressive mreport-12/07
progressive mreport-12/07
 
progressive mreport-12/05
progressive mreport-12/05progressive mreport-12/05
progressive mreport-12/05
 
progressive mreport-12/05
progressive mreport-12/05progressive mreport-12/05
progressive mreport-12/05
 
progressive mreport-09/07
progressive mreport-09/07progressive mreport-09/07
progressive mreport-09/07
 
progressive mreport-09/07
progressive mreport-09/07progressive mreport-09/07
progressive mreport-09/07
 
progressive mreport-03/08
 progressive mreport-03/08 progressive mreport-03/08
progressive mreport-03/08
 
.progressive mreport-03/06
.progressive mreport-03/06.progressive mreport-03/06
.progressive mreport-03/06
 
110212 divulgação de resultados 4 t10 ingles
110212   divulgação de resultados 4 t10 ingles110212   divulgação de resultados 4 t10 ingles
110212 divulgação de resultados 4 t10 ingles
 
First Quarter GAAP Reconciliations
First Quarter GAAP ReconciliationsFirst Quarter GAAP Reconciliations
First Quarter GAAP Reconciliations
 
.progressive mreport-04/06
.progressive mreport-04/06.progressive mreport-04/06
.progressive mreport-04/06
 
.progressive mreport-0406
.progressive mreport-0406.progressive mreport-0406
.progressive mreport-0406
 
dte_3q2000
dte_3q2000dte_3q2000
dte_3q2000
 
2Q11 Earnings Presentation
 2Q11 Earnings Presentation  2Q11 Earnings Presentation
2Q11 Earnings Presentation
 
progressive mreport-01/08
 progressive mreport-01/08 progressive mreport-01/08
progressive mreport-01/08
 
progressive mreport-01/08
 progressive mreport-01/08 progressive mreport-01/08
progressive mreport-01/08
 

More from finance9

enterprise gp holdings Organizational and Ownership Structure Chart
enterprise gp holdings  Organizational and Ownership Structure Chart enterprise gp holdings  Organizational and Ownership Structure Chart
enterprise gp holdings Organizational and Ownership Structure Chart finance9
 
enterprise gp holdings Standards of Business Conduct
enterprise gp holdings Standards of Business Conductenterprise gp holdings Standards of Business Conduct
enterprise gp holdings Standards of Business Conductfinance9
 
enterprise gp holdings Governance Guidelines
enterprise gp holdings Governance Guidelinesenterprise gp holdings Governance Guidelines
enterprise gp holdings Governance Guidelinesfinance9
 
enterprise gp holdings Audit, Conflicts & Governance Committee
enterprise gp holdings Audit, Conflicts & Governance Committeeenterprise gp holdings Audit, Conflicts & Governance Committee
enterprise gp holdings Audit, Conflicts & Governance Committeefinance9
 
enterprise gp holdings Code of Conduct & Related Policies
enterprise gp holdings Code of Conduct & Related Policiesenterprise gp holdings Code of Conduct & Related Policies
enterprise gp holdings Code of Conduct & Related Policiesfinance9
 
02/11/09 HCA Announces Offering of $300 Million Senior Secured Second Lien Notes
02/11/09 HCA Announces Offering of $300 Million Senior Secured Second Lien Notes02/11/09 HCA Announces Offering of $300 Million Senior Secured Second Lien Notes
02/11/09 HCA Announces Offering of $300 Million Senior Secured Second Lien Notesfinance9
 
hca annual reports2000
hca annual reports2000hca annual reports2000
hca annual reports2000finance9
 
hca annual reports2001
hca annual reports2001hca annual reports2001
hca annual reports2001finance9
 
hca annual reports2002
hca annual reports2002hca annual reports2002
hca annual reports2002finance9
 
hca annual reports2003
hca annual reports2003hca annual reports2003
hca annual reports2003finance9
 
hca annual reports2004
hca annual reports2004hca annual reports2004
hca annual reports2004finance9
 
hca annual reports2005
hca annual reports2005hca annual reports2005
hca annual reports2005finance9
 
JP Morgan Presentation 15-Feb-2008
JP Morgan Presentation 15-Feb-2008JP Morgan Presentation 15-Feb-2008
JP Morgan Presentation 15-Feb-2008finance9
 
HCA Presents at Bank of America 2008 Credit Conference 20-Nov-2008
HCA Presents at Bank of America 2008 Credit Conference 20-Nov-2008HCA Presents at Bank of America 2008 Credit Conference 20-Nov-2008
HCA Presents at Bank of America 2008 Credit Conference 20-Nov-2008finance9
 
tyson foods 2007 Sustainability Report
tyson foods  2007 Sustainability Report tyson foods  2007 Sustainability Report
tyson foods 2007 Sustainability Report finance9
 
tyson foods Investor Fact Book
tyson foods Investor Fact Book tyson foods Investor Fact Book
tyson foods Investor Fact Book finance9
 
tyson foods 2008 Annual Report
tyson foods  2008 Annual Report tyson foods  2008 Annual Report
tyson foods 2008 Annual Report finance9
 
general dynamics 2008 Proxy Statement
general dynamics 2008 Proxy Statement	 general dynamics 2008 Proxy Statement
general dynamics 2008 Proxy Statement finance9
 
general dynamics 2007 Annual Report
general dynamics 2007 Annual Report	general dynamics 2007 Annual Report
general dynamics 2007 Annual Report finance9
 
general dynamics Restated Certificate of Incorporation
general dynamics Restated Certificate of Incorporation general dynamics Restated Certificate of Incorporation
general dynamics Restated Certificate of Incorporation finance9
 

More from finance9 (20)

enterprise gp holdings Organizational and Ownership Structure Chart
enterprise gp holdings  Organizational and Ownership Structure Chart enterprise gp holdings  Organizational and Ownership Structure Chart
enterprise gp holdings Organizational and Ownership Structure Chart
 
enterprise gp holdings Standards of Business Conduct
enterprise gp holdings Standards of Business Conductenterprise gp holdings Standards of Business Conduct
enterprise gp holdings Standards of Business Conduct
 
enterprise gp holdings Governance Guidelines
enterprise gp holdings Governance Guidelinesenterprise gp holdings Governance Guidelines
enterprise gp holdings Governance Guidelines
 
enterprise gp holdings Audit, Conflicts & Governance Committee
enterprise gp holdings Audit, Conflicts & Governance Committeeenterprise gp holdings Audit, Conflicts & Governance Committee
enterprise gp holdings Audit, Conflicts & Governance Committee
 
enterprise gp holdings Code of Conduct & Related Policies
enterprise gp holdings Code of Conduct & Related Policiesenterprise gp holdings Code of Conduct & Related Policies
enterprise gp holdings Code of Conduct & Related Policies
 
02/11/09 HCA Announces Offering of $300 Million Senior Secured Second Lien Notes
02/11/09 HCA Announces Offering of $300 Million Senior Secured Second Lien Notes02/11/09 HCA Announces Offering of $300 Million Senior Secured Second Lien Notes
02/11/09 HCA Announces Offering of $300 Million Senior Secured Second Lien Notes
 
hca annual reports2000
hca annual reports2000hca annual reports2000
hca annual reports2000
 
hca annual reports2001
hca annual reports2001hca annual reports2001
hca annual reports2001
 
hca annual reports2002
hca annual reports2002hca annual reports2002
hca annual reports2002
 
hca annual reports2003
hca annual reports2003hca annual reports2003
hca annual reports2003
 
hca annual reports2004
hca annual reports2004hca annual reports2004
hca annual reports2004
 
hca annual reports2005
hca annual reports2005hca annual reports2005
hca annual reports2005
 
JP Morgan Presentation 15-Feb-2008
JP Morgan Presentation 15-Feb-2008JP Morgan Presentation 15-Feb-2008
JP Morgan Presentation 15-Feb-2008
 
HCA Presents at Bank of America 2008 Credit Conference 20-Nov-2008
HCA Presents at Bank of America 2008 Credit Conference 20-Nov-2008HCA Presents at Bank of America 2008 Credit Conference 20-Nov-2008
HCA Presents at Bank of America 2008 Credit Conference 20-Nov-2008
 
tyson foods 2007 Sustainability Report
tyson foods  2007 Sustainability Report tyson foods  2007 Sustainability Report
tyson foods 2007 Sustainability Report
 
tyson foods Investor Fact Book
tyson foods Investor Fact Book tyson foods Investor Fact Book
tyson foods Investor Fact Book
 
tyson foods 2008 Annual Report
tyson foods  2008 Annual Report tyson foods  2008 Annual Report
tyson foods 2008 Annual Report
 
general dynamics 2008 Proxy Statement
general dynamics 2008 Proxy Statement	 general dynamics 2008 Proxy Statement
general dynamics 2008 Proxy Statement
 
general dynamics 2007 Annual Report
general dynamics 2007 Annual Report	general dynamics 2007 Annual Report
general dynamics 2007 Annual Report
 
general dynamics Restated Certificate of Incorporation
general dynamics Restated Certificate of Incorporation general dynamics Restated Certificate of Incorporation
general dynamics Restated Certificate of Incorporation
 

Recently uploaded

Seminar: Gender Board Diversity through Ownership Networks
Seminar: Gender Board Diversity through Ownership NetworksSeminar: Gender Board Diversity through Ownership Networks
Seminar: Gender Board Diversity through Ownership Networks
GRAPE
 
What price will pi network be listed on exchanges
What price will pi network be listed on exchangesWhat price will pi network be listed on exchanges
What price will pi network be listed on exchanges
DOT TECH
 
how to sell pi coins in South Korea profitably.
how to sell pi coins in South Korea profitably.how to sell pi coins in South Korea profitably.
how to sell pi coins in South Korea profitably.
DOT TECH
 
一比一原版(UoB毕业证)伯明翰大学毕业证如何办理
一比一原版(UoB毕业证)伯明翰大学毕业证如何办理一比一原版(UoB毕业证)伯明翰大学毕业证如何办理
一比一原版(UoB毕业证)伯明翰大学毕业证如何办理
nexop1
 
Transkredit Finance Company Products Presentation (1).pptx
Transkredit Finance Company Products Presentation (1).pptxTranskredit Finance Company Products Presentation (1).pptx
Transkredit Finance Company Products Presentation (1).pptx
jenomjaneh
 
Which Crypto to Buy Today for Short-Term in May-June 2024.pdf
Which Crypto to Buy Today for Short-Term in May-June 2024.pdfWhich Crypto to Buy Today for Short-Term in May-June 2024.pdf
Which Crypto to Buy Today for Short-Term in May-June 2024.pdf
Kezex (KZX)
 
一比一原版(IC毕业证)帝国理工大学毕业证如何办理
一比一原版(IC毕业证)帝国理工大学毕业证如何办理一比一原版(IC毕业证)帝国理工大学毕业证如何办理
一比一原版(IC毕业证)帝国理工大学毕业证如何办理
conose1
 
Analyzing the instability of equilibrium in thr harrod domar model
Analyzing the instability of equilibrium in thr harrod domar modelAnalyzing the instability of equilibrium in thr harrod domar model
Analyzing the instability of equilibrium in thr harrod domar model
ManthanBhardwaj4
 
how to sell pi coins effectively (from 50 - 100k pi)
how to sell pi coins effectively (from 50 - 100k  pi)how to sell pi coins effectively (from 50 - 100k  pi)
how to sell pi coins effectively (from 50 - 100k pi)
DOT TECH
 
Abhay Bhutada Leads Poonawalla Fincorp To Record Low NPA And Unprecedented Gr...
Abhay Bhutada Leads Poonawalla Fincorp To Record Low NPA And Unprecedented Gr...Abhay Bhutada Leads Poonawalla Fincorp To Record Low NPA And Unprecedented Gr...
Abhay Bhutada Leads Poonawalla Fincorp To Record Low NPA And Unprecedented Gr...
Vighnesh Shashtri
 
The Role of Non-Banking Financial Companies (NBFCs)
The Role of Non-Banking Financial Companies (NBFCs)The Role of Non-Banking Financial Companies (NBFCs)
The Role of Non-Banking Financial Companies (NBFCs)
nickysharmasucks
 
Earn a passive income with prosocial investing
Earn a passive income with prosocial investingEarn a passive income with prosocial investing
Earn a passive income with prosocial investing
Colin R. Turner
 
when will pi network coin be available on crypto exchange.
when will pi network coin be available on crypto exchange.when will pi network coin be available on crypto exchange.
when will pi network coin be available on crypto exchange.
DOT TECH
 
2. Elemental Economics - Mineral demand.pdf
2. Elemental Economics - Mineral demand.pdf2. Elemental Economics - Mineral demand.pdf
2. Elemental Economics - Mineral demand.pdf
Neal Brewster
 
BYD SWOT Analysis and In-Depth Insights 2024.pptx
BYD SWOT Analysis and In-Depth Insights 2024.pptxBYD SWOT Analysis and In-Depth Insights 2024.pptx
BYD SWOT Analysis and In-Depth Insights 2024.pptx
mikemetalprod
 
Scope Of Macroeconomics introduction and basic theories
Scope Of Macroeconomics introduction and basic theoriesScope Of Macroeconomics introduction and basic theories
Scope Of Macroeconomics introduction and basic theories
nomankalyar153
 
Instant Issue Debit Cards
Instant Issue Debit CardsInstant Issue Debit Cards
Instant Issue Debit Cards
egoetzinger
 
一比一原版(UCSB毕业证)圣芭芭拉分校毕业证如何办理
一比一原版(UCSB毕业证)圣芭芭拉分校毕业证如何办理一比一原版(UCSB毕业证)圣芭芭拉分校毕业证如何办理
一比一原版(UCSB毕业证)圣芭芭拉分校毕业证如何办理
bbeucd
 
Introduction to Value Added Tax System.ppt
Introduction to Value Added Tax System.pptIntroduction to Value Added Tax System.ppt
Introduction to Value Added Tax System.ppt
VishnuVenugopal84
 
Tax System, Behaviour, Justice, and Voluntary Compliance Culture in Nigeria -...
Tax System, Behaviour, Justice, and Voluntary Compliance Culture in Nigeria -...Tax System, Behaviour, Justice, and Voluntary Compliance Culture in Nigeria -...
Tax System, Behaviour, Justice, and Voluntary Compliance Culture in Nigeria -...
Godwin Emmanuel Oyedokun MBA MSc PhD FCA FCTI FCNA CFE FFAR
 

Recently uploaded (20)

Seminar: Gender Board Diversity through Ownership Networks
Seminar: Gender Board Diversity through Ownership NetworksSeminar: Gender Board Diversity through Ownership Networks
Seminar: Gender Board Diversity through Ownership Networks
 
What price will pi network be listed on exchanges
What price will pi network be listed on exchangesWhat price will pi network be listed on exchanges
What price will pi network be listed on exchanges
 
how to sell pi coins in South Korea profitably.
how to sell pi coins in South Korea profitably.how to sell pi coins in South Korea profitably.
how to sell pi coins in South Korea profitably.
 
一比一原版(UoB毕业证)伯明翰大学毕业证如何办理
一比一原版(UoB毕业证)伯明翰大学毕业证如何办理一比一原版(UoB毕业证)伯明翰大学毕业证如何办理
一比一原版(UoB毕业证)伯明翰大学毕业证如何办理
 
Transkredit Finance Company Products Presentation (1).pptx
Transkredit Finance Company Products Presentation (1).pptxTranskredit Finance Company Products Presentation (1).pptx
Transkredit Finance Company Products Presentation (1).pptx
 
Which Crypto to Buy Today for Short-Term in May-June 2024.pdf
Which Crypto to Buy Today for Short-Term in May-June 2024.pdfWhich Crypto to Buy Today for Short-Term in May-June 2024.pdf
Which Crypto to Buy Today for Short-Term in May-June 2024.pdf
 
一比一原版(IC毕业证)帝国理工大学毕业证如何办理
一比一原版(IC毕业证)帝国理工大学毕业证如何办理一比一原版(IC毕业证)帝国理工大学毕业证如何办理
一比一原版(IC毕业证)帝国理工大学毕业证如何办理
 
Analyzing the instability of equilibrium in thr harrod domar model
Analyzing the instability of equilibrium in thr harrod domar modelAnalyzing the instability of equilibrium in thr harrod domar model
Analyzing the instability of equilibrium in thr harrod domar model
 
how to sell pi coins effectively (from 50 - 100k pi)
how to sell pi coins effectively (from 50 - 100k  pi)how to sell pi coins effectively (from 50 - 100k  pi)
how to sell pi coins effectively (from 50 - 100k pi)
 
Abhay Bhutada Leads Poonawalla Fincorp To Record Low NPA And Unprecedented Gr...
Abhay Bhutada Leads Poonawalla Fincorp To Record Low NPA And Unprecedented Gr...Abhay Bhutada Leads Poonawalla Fincorp To Record Low NPA And Unprecedented Gr...
Abhay Bhutada Leads Poonawalla Fincorp To Record Low NPA And Unprecedented Gr...
 
The Role of Non-Banking Financial Companies (NBFCs)
The Role of Non-Banking Financial Companies (NBFCs)The Role of Non-Banking Financial Companies (NBFCs)
The Role of Non-Banking Financial Companies (NBFCs)
 
Earn a passive income with prosocial investing
Earn a passive income with prosocial investingEarn a passive income with prosocial investing
Earn a passive income with prosocial investing
 
when will pi network coin be available on crypto exchange.
when will pi network coin be available on crypto exchange.when will pi network coin be available on crypto exchange.
when will pi network coin be available on crypto exchange.
 
2. Elemental Economics - Mineral demand.pdf
2. Elemental Economics - Mineral demand.pdf2. Elemental Economics - Mineral demand.pdf
2. Elemental Economics - Mineral demand.pdf
 
BYD SWOT Analysis and In-Depth Insights 2024.pptx
BYD SWOT Analysis and In-Depth Insights 2024.pptxBYD SWOT Analysis and In-Depth Insights 2024.pptx
BYD SWOT Analysis and In-Depth Insights 2024.pptx
 
Scope Of Macroeconomics introduction and basic theories
Scope Of Macroeconomics introduction and basic theoriesScope Of Macroeconomics introduction and basic theories
Scope Of Macroeconomics introduction and basic theories
 
Instant Issue Debit Cards
Instant Issue Debit CardsInstant Issue Debit Cards
Instant Issue Debit Cards
 
一比一原版(UCSB毕业证)圣芭芭拉分校毕业证如何办理
一比一原版(UCSB毕业证)圣芭芭拉分校毕业证如何办理一比一原版(UCSB毕业证)圣芭芭拉分校毕业证如何办理
一比一原版(UCSB毕业证)圣芭芭拉分校毕业证如何办理
 
Introduction to Value Added Tax System.ppt
Introduction to Value Added Tax System.pptIntroduction to Value Added Tax System.ppt
Introduction to Value Added Tax System.ppt
 
Tax System, Behaviour, Justice, and Voluntary Compliance Culture in Nigeria -...
Tax System, Behaviour, Justice, and Voluntary Compliance Culture in Nigeria -...Tax System, Behaviour, Justice, and Voluntary Compliance Culture in Nigeria -...
Tax System, Behaviour, Justice, and Voluntary Compliance Culture in Nigeria -...
 

aetna Financial Supplement 2006 3rd

  • 1. A 2006 Third Quarter Financial Supplement
  • 2. Table of Contents Financial Highlights 1 Health Care and Group Insurance Statistics 2 Health Care and Group Insurance Enrollment 3 Earnings Summary 4 Consolidating Statements of Income (Loss) from Continuing Operations by Segment 5-6 Consolidated Balance Sheets 7 Combining Balance Sheets 8 Condensed Combining Statements of Cash Flows 9-10 Reconciliations of Certain Reported Amounts to the Most Directly Comparable GAAP Measure 11-13 Definitions 14 This document is supplemental to the Company’s third quarter 2006 earnings press release and should be read in conjunction therewith and in conjunction with the Company's September 30, 2006 Quarterly Report on Form 10-Q to be filed with the U.S. Securities and Exchange Commission. Please direct questions with respect to this material to David Entrekin, Vice President - Investor Relations, Aetna Inc., 151 Farmington Avenue, RT21, Hartford, Connecticut 06156. Telephone: 860-273-7830. Email: entrekind@aetna.com.
  • 3. Financial Highlights (1) ($ in Millions, except per common share data) Three Months Ended Nine Months Ended Change Change Sep. 30, Sep. 30, Sep. 30, 2006 - Sep. 30, Sep. 30, Sep. 30, 2006 - 2006 2005 Sep. 30, 2005 2006 2005 Sep. 30, 2005 Operating Earnings (2) Aetna Inc. $ 466.3 $ 367.3 27.0 % $ 1,223.7 $ 1,101.5 11.1 % Aetna Inc. per common share $ .84 $ .61 37.7 % $ 2.12 $ 1.82 16.5 % Health Care $ 447.0 $ 346.5 29.0 % $ 1,160.5 $ 1,046.2 10.9 % Group Insurance $ 34.6 $ 32.3 7.1 % $ 102.8 $ 92.7 10.9 % Large Case Pensions $ 10.6 $ 9.6 10.4 % $ 30.0 $ 21.2 41.5 % Operating Earnings - Adjusted (2) Aetna Inc. $ 437.3 $ 352.3 24.1 % Aetna Inc. per common share $ .78 $ .58 34.5 % Health Care $ 418.0 $ 331.5 26.1 % Pretax Operating Margin (2) Aetna Inc. 12.3 % 10.9 % 1.4 pts. 10.9 % 11.1 % (.2) pts. Aetna Inc. - Adjusted 11.6 % 10.5 % 1.1 pts. After-tax Operating Margin (2) Aetna Inc. 8.1 % 7.0 % 1.1 pts. 7.1 % 7.1 % - pts. Aetna Inc. - Adjusted 7.6 % 6.7 % .9 pts. Revenue by Segment (2) Health Care $ 5,588.1 $ 4,984.2 12.1 % $ 16,610.3 $ 14,469.2 14.8 % Group Insurance 519.0 524.7 (1.1) % 1,610.9 1,577.2 2.1 % Large Case Pensions 176.9 183.3 (3.5) % 543.1 559.5 (2.9) % Total Revenue $ 6,284.0 $ 5,692.2 10.4 % $ 18,764.3 $ 16,605.9 13.0 % Operating Expenses as % of Revenue (2) Aetna Inc. 18.4 % 19.3 % (.9) pts. 18.6 % 19.9 % (1.3) pts. Health Care 19.2 % 20.7 % (1.5) pts. 19.6 % 21.4 % (1.8) pts. Group Insurance 15.3 % 11.9 % 3.4 pts. 13.9 % 11.8 % 2.1 pts. Large Case Pensions 1.9 % 2.8 % (.9) pts. 2.3 % 2.4 % (.1) pts. Sep. 30, Jun. 30, Mar. 31, Dec. 31, Sep. 30, 2006 2006 2006 2005 2005 Membership (Members in Thousands) (3) Medical 15,383 15,407 15,418 14,755 14,650 Dental 13,396 13,374 13,331 13,098 13,031 Pharmacy 10,202 10,213 10,151 9,445 9,337 Group Insurance 15,309 15,265 13,089 13,618 13,675 (1) Effective January 1, 2006, the Company adopted FAS 123R applying the modified retrospective approach. Accordingly, all prior-period financial information was adjusted to reflect the Company's stock-based compensation activity. Additionally, results per common share have been adjusted to reflect the February 17, 2006 two-for-one stock split. (2) In order to provide a comparison that the Company believes provides useful information regarding its underlying performance, all operating earnings exclude other items and net realized capital gains from income from continuing operations. In addition, operating margins exclude interest expense and amortization of other acquired intangibles; furthermore, pretax operating margin also excludes income taxes. Also, revenue excludes net realized capital gains. Management uses these measures to assess business performance and to make decisions regarding the Company's operations and allocation of resources among its businesses. The Company also displays certain metrics (e.g., medical cost ratios, operating earnings, operating earnings per common share and operating margins) excluding prior-period reserve development to reflect underlying current-period health care costs. For a reconciliation of financial measures calculated under U.S. generally accepted accounting principles (quot;GAAPquot;), refer to pages 11-13. (3) Refer to page 3 for more details. Refer to page 14 for definitions of terms used. 1
  • 4. Health Care and Group Insurance Statistics ($ in Millions) Three Months Ended Nine Months Ended Change Change Sep. 30, Sep. 30, Sep. 30, 2006 - Sep. 30, Sep. 30, Sep. 30, 2006 - 2006 2005 Sep. 30, 2005 2006 2005 Sep. 30, 2005 Health Care Premiums Health Care Risk (A) $ 4,820.3 $ 4,291.3 12.3 % $ 14,308.3 $ 12,490.5 14.6 % Commercial Risk (B) $ 4,350.2 $ 4,039.3 7.7 % $ 12,972.6 $ 11,742.0 10.5 % Medicare (C) $ 469.0 $ 252.0 86.1 % $ 1,334.6 $ 748.5 78.3 % Fees and Other Revenue $ 683.1 $ 616.0 10.9 % $ 2,052.7 $ 1,760.5 16.6 % Health Care Costs Health Care Risk Health care costs (GAAP measure) (D) $ 3,797.4 $ 3,390.4 12.0 % $ 11,481.9 $ 9,683.6 18.6 % Favorable development of prior-period health care cost estimates 45.0 24.0 Health care costs - Adjusted (E) $ 3,842.4 $ 3,414.4 12.5 % Commercial Risk Health care costs (GAAP measure) (F) $ 3,417.7 $ 3,174.9 7.6 % $ 10,337.2 $ 9,035.3 14.4 % Favorable development of prior-period health care cost estimates 33.0 15.0 Health care costs - Adjusted (G) $ 3,450.7 $ 3,189.9 8.2 % Medicare Health care costs (GAAP measure) (H) $ 378.4 $ 215.5 75.6 % $ 1,143.7 $ 648.4 76.4 % Favorable development of prior-period health care cost estimates 12.0 9.0 Health care costs - Adjusted (I) $ 390.4 $ 224.5 73.9 % Health Care Medical Cost Ratios Health Care Risk (GAAP measure) (D)/(A) 78.8 % 79.0 % (.2) pts. 80.2 % 77.5 % 2.7 pts. Health Care Risk - Adjusted (E)/(A) 79.7 % 79.6 % .1 pts. Commercial Risk (GAAP measure) (F)/(B) 78.6 % 78.6 % - pts. 79.7 % 76.9 % 2.8 pts. Commercial Risk - Adjusted (G)/(B) 79.3 % 79.0 % .3 pts. Medicare (GAAP measure) (H)/(C) 80.7 % 85.5 % (4.8) pts. 85.7 % 86.6 % (.9) pts. Medicare - Adjusted (I)/(C) 83.2 % 89.1 % (5.9) pts. Group Insurance Total revenue, excluding net realized capital gains $ 519.0 $ 524.7 (1.1) % $ 1,610.9 $ 1,577.2 2.1 % Benefit cost ratios 92.6 % 95.5 % (2.9) pts. 93.4 % 94.6 % (1.2) pts. Sep. 30, Jun. 30, Mar. 31, Dec. 31, Sep. 30, Other Health Care Statistics 2006 2006 2006 2005 2005 Health care costs payable $ 1,954.5 $ 1,921.2 $ 1,934.9 $ 1,817.0 $ 1,864.8 Days claims payable 46.8 44.8 46.5 48.3 50.1 Refer to page 14 for definitions of terms used. 2
  • 5. Health Care and Group Insurance Enrollment (Members in Thousands) September 30, 2006 September 30, 2005 December 31, 2005 June 30, 2006 Products Risk ASC Total Risk ASC Total Risk ASC Total Risk ASC Total Medical: Commercial 5,085 10,037 15,122 5,014 9,401 14,415 5,115 9,406 14,521 5,103 10,054 15,157 Medicare Advantage 124 - 124 102 - 102 101 - 101 123 - 123 Medicare Health Support Program - 18 18 - 20 20 - 19 19 - 14 14 Medicaid 7 112 119 - 113 113 - 114 114 - 113 113 Total Medical 5,216 10,167 15,383 5,116 9,534 14,650 5,216 9,539 14,755 5,226 10,181 15,407 Consumer-Directed Health Plans (1) 644 433 453 621 Dental 5,022 8,374 13,396 5,038 7,993 13,031 5,078 8,020 13,098 5,022 8,352 13,374 Pharmacy: Commercial 9,138 8,791 8,885 9,141 Medicare PDP (stand-alone) 319 - - 323 Medicare Advantage PDP 115 - - 114 Total Pharmacy Benefit Management Services 9,572 8,791 8,885 9,578 Mail Order (2) 630 546 560 635 Total Pharmacy 10,202 9,337 9,445 10,213 Group Insurance: Life 10,205 10,872 10,812 10,234 Disability (3) 4,882 2,568 2,571 4,793 Long-Term Care 222 235 235 238 Total Group Insurance 15,309 13,675 13,618 15,265 Regions Northeast 1,170 1,444 2,614 1,188 1,370 2,558 1,205 1,365 2,570 1,195 1,440 2,635 Mid-Atlantic 1,023 1,662 2,685 1,106 1,505 2,611 1,122 1,505 2,627 1,062 1,653 2,715 Southeast 932 1,678 2,610 878 1,563 2,441 894 1,565 2,459 929 1,682 2,611 North Central 551 2,269 2,820 533 2,174 2,707 542 2,173 2,715 545 2,259 2,804 Southwest 629 1,701 2,330 588 1,552 2,140 596 1,554 2,150 598 1,696 2,294 West 789 1,354 2,143 719 1,311 2,030 748 1,312 2,060 779 1,409 2,188 Other 122 59 181 104 59 163 109 65 174 118 42 160 Total Medical 5,216 10,167 15,383 5,116 9,534 14,650 5,216 9,539 14,755 5,226 10,181 15,407 Risk/ASC % 33.9% 66.1% 100.0% 34.9% 65.1% 100.0% 35.4% 64.6% 100.0% 33.9% 66.1% 100.0% (1) Represents members in consumer-directed health plans included in the Company's Commercial medical membership. (2) Mail Order represents members who purchased medications through the Company's mail order pharmacy during the quarterly period. (3) June 30, 2006 includes approximately 2.1 million members acquired from Broadspire on March 31, 2006. Refer to page 14 for definitions of terms used. 3
  • 6. Earnings Summary (1) (in Millions, except per common share data) Three Months Ended Nine Months Ended Sep. 30, Sep. 30, Sep. 30, Sep. 30, 2006 2005 2006 2005 Summary of Results Health Care $ 447.0 $ 346.5 $ 1,160.5 $ 1,046.2 Group Insurance 34.6 32.3 102.8 92.7 Large Case Pensions 10.6 9.6 30.0 21.2 Corporate Interest Expense (25.9) (21.1) (69.6) (58.6) Operating earnings 466.3 367.3 1,223.7 1,101.5 Debt refinancing charge - - (8.1) - Physician class action settlement insurance-related charge - - (47.1) - Reduction of reserve for anticipated future losses on discontinued products - - 75.0 43.4 Acquisition-related software charge - - (6.2) - Net realized capital gains 10.1 5.5 14.2 12.1 Income from continuing operations (GAAP measure) 476.4 372.8 1,251.5 1,157.0 Income from discontinued operations (2) - - 16.1 - Net income (GAAP measure) $ 476.4 $ 372.8 $ 1,267.6 $ 1,157.0 Operating earnings - Adjusted $ 437.3 $ 352.3 Favorable development of prior-period health care cost estimates 29.0 15.0 Operating earnings $ 466.3 $ 367.3 Health Care operating earnings - Adjusted $ 418.0 $ 331.5 Favorable development of prior-period health care cost estimates 29.0 15.0 Health Care operating earnings $ 447.0 $ 346.5 Weighted average common shares - basic 536.6 577.4 554.8 581.8 Weighted average common shares - diluted 558.1 602.6 578.3 606.0 Summary of Results Per Common Share Operating earnings - Adjusted $ .78 $ .58 Favorable development of prior-period health care cost estimates .06 .03 Operating earnings .84 .61 $ 2.12 $ 1.82 Debt refinancing charge - - (.02) - Physician class action settlement insurance-related charge - - (.08) - Reduction of reserve for anticipated future losses on discontinued products - - .13 .07 Acquisition-related software charge - - (.01) - Net realized capital gains .01 .01 .02 .02 Income from continuing operations (GAAP measure) .85 .62 2.16 1.91 Income from discontinued operations - - .03 - Net income (GAAP measure) $ .85 $ .62 $ 2.19 $ 1.91 (1) Effective January 1, 2006, the Company adopted FAS 123R applying the modified retrospective approach. Accordingly, all prior-period financial information was adjusted to reflect the Company's stock-based compensation activity. Additionally, results per common share and weighted average common shares have been adjusted to reflect the February 17, 2006 two-for-one stock split. (2) Income from discontinued operations of approximately $16 million for the nine months ended September 30, 2006 reflects the Company's receipt in February 2006 of an approximately $50 million refund, including interest, from the completion of certain Internal Revenue Service audits associated with businesses previously sold by the Company's former parent company. The Company previously recorded $735 million of this refund. The $50 million refund resulted in an additional $16 million in income from discontinued operations. Refer to page 14 for definitions of terms used. 4
  • 7. Consolidating Statements of Income (Loss) from Continuing Operations by Segment (1) ($ in Millions) Health Group Large Case Corporate Three Months Ended September 30, 2006 Care Insurance Pensions Interest Consolidated Revenue: Premiums $ 4,820.3 $ 422.6 $ 49.9 $ - $ 5,292.8 Fees and other revenue 683.1 26.9 2.9 - 712.9 Net investment income 84.7 69.5 124.1 - 278.3 Total revenue, excluding net realized capital gains (2) 5,588.1 519.0 176.9 - 6,284.0 Benefits and expenses: Health care costs (3) 3,797.4 - - - 3,797.4 Current and future benefits - 391.4 162.7 - 554.1 Operating expenses: Selling expenses 212.0 19.7 - - 231.7 General and administrative expenses 862.6 59.6 3.4 - 925.6 Total operating expenses 1,074.6 79.3 3.4 - 1,157.3 Interest expense - - - 39.9 39.9 Amortization of other acquired intangible assets 20.2 1.8 - - 22.0 Total benefits and expenses 4,892.2 472.5 166.1 39.9 5,570.7 Operating earnings (loss), excluding income taxes (benefits) 695.9 46.5 10.8 (39.9) 713.3 Income taxes (benefits) 248.9 11.9 .2 (14.0) 247.0 Operating earnings (loss) 447.0 34.6 10.6 (25.9) 466.3 Net realized capital gains, net of tax 2.3 5.1 2.7 - 10.1 Income (loss) from continuing operations $ 449.3 $ 39.7 $ 13.3 $ (25.9) $ 476.4 Three Months Ended September 30, 2005 Revenue: Premiums $ 4,291.3 $ 438.1 $ 56.1 $ - $ 4,785.5 Fees and other revenue 616.0 7.8 3.0 - 626.8 Net investment income 76.9 78.8 124.2 - 279.9 Total revenue, excluding net realized capital gains (2) 4,984.2 524.7 183.3 - 5,692.2 Benefits and expenses: Health care costs (4) 3,390.4 - - - 3,390.4 Current and future benefits - 418.4 163.4 - 581.8 Operating expenses: Selling expenses 193.5 20.6 - - 214.1 General and administrative expenses 838.3 41.7 5.1 - 885.1 Total operating expenses 1,031.8 62.3 5.1 - 1,099.2 Interest expense - - - 32.5 32.5 Amortization of other acquired intangible assets 15.9 - - - 15.9 Total benefits and expenses 4,438.1 480.7 168.5 32.5 5,119.8 Operating earnings (loss), excluding income taxes (benefits) 546.1 44.0 14.8 (32.5) 572.4 Income taxes (benefits) 199.6 11.7 5.2 (11.4) 205.1 Operating earnings (loss) 346.5 32.3 9.6 (21.1) 367.3 Net realized capital gains, net of tax 1.2 3.3 1.0 - 5.5 Income (loss) from continuing operations $ 347.7 $ 35.6 $ 10.6 $ (21.1) $ 372.8 (1) Effective January 1, 2006, the Company adopted FAS 123R applying the modified retrospective approach. Accordingly, all prior-period financial information was adjusted to reflect the Company's stock-based compensation activity. (2) Refer to pages 11-13 for reconciliations of revenue calculated under GAAP for all periods. (3) Includes favorable development of prior-period health care cost estimates of approximately $45 million pretax (approximately $29 million after tax) in the Health Care Segment. (4) Includes favorable development of prior-period health care cost estimates of approximately $24 million pretax (approximately $15 million after tax) in the Health Care Segment. Refer to page 14 for definitions of terms used. 5
  • 8. Consolidating Statements of Income (Loss) from Continuing Operations by Segment (Continued) (1) ($ in Millions) Health Group Large Case Corporate Nine Months Ended September 30, 2006 Care Insurance Pensions Interest Consolidated Revenue: Premiums $ 14,308.3 $ 1,331.0 $ 151.5 $ - $ 15,790.8 Fees and other revenue 2,052.7 60.1 8.6 - 2,121.4 Net investment income 249.3 219.8 383.0 - 852.1 Total revenue, excluding net realized capital gains (2) 16,610.3 1,610.9 543.1 - 18,764.3 Benefits and expenses: Health care costs 11,481.9 - - - 11,481.9 Current and future benefits - 1,243.8 489.8 - 1,733.6 Operating expenses: Selling expenses 651.2 64.1 - - 715.3 General and administrative expenses 2,610.1 160.5 12.6 - 2,783.2 Total operating expenses 3,261.3 224.6 12.6 - 3,498.5 Interest expense - - - 107.2 107.2 Amortization of other acquired intangible assets 60.2 3.5 - - 63.7 Total benefits and expenses 14,803.4 1,471.9 502.4 107.2 16,884.9 Operating earnings (loss), excluding income taxes (benefits) 1,806.9 139.0 40.7 (107.2) 1,879.4 Income taxes (benefits) 646.4 36.2 10.7 (37.6) 655.7 Operating earnings (loss) 1,160.5 102.8 30.0 (69.6) 1,223.7 Debt refinancing charge, net of tax (8.1) - - - (8.1) Physician class action settlement insurance-related charge, net of tax (47.1) - - - (47.1) Reduction of reserve for anticipated future losses on discontinued products, net of tax - - 75.0 - 75.0 Acquisition-related software charge, net of tax - (6.2) - - (6.2) Net realized capital gains, net of tax 1.5 2.7 10.0 - 14.2 Income (loss) from continuing operations $ 1,106.8 $ 99.3 $ 115.0 $ (69.6) $ 1,251.5 Nine Months Ended September 30, 2005 Revenue: Premiums $ 12,490.5 $ 1,336.7 $ 157.7 $ - $ 13,984.9 Fees and other revenue 1,760.5 24.3 8.5 - 1,793.3 Net investment income 218.2 216.2 393.3 - 827.7 Total revenue, excluding net realized capital gains (2) 14,469.2 1,577.2 559.5 - 16,605.9 Benefits and expenses: Health care costs 9,683.6 - - - 9,683.6 Current and future benefits - 1,264.8 513.6 - 1,778.4 Operating expenses: Selling expenses 562.5 60.5 - - 623.0 General and administrative expenses 2,534.5 125.7 13.3 - 2,673.5 Total operating expenses 3,097.0 186.2 13.3 - 3,296.5 Interest expense - - - 90.2 90.2 Amortization of other acquired intangible assets 38.1 - - - 38.1 Total benefits and expenses 12,818.7 1,451.0 526.9 90.2 14,886.8 Operating earnings (loss), excluding income taxes (benefits) 1,650.5 126.2 32.6 (90.2) 1,719.1 Income taxes (benefits) 604.3 33.5 11.4 (31.6) 617.6 Operating earnings (loss) 1,046.2 92.7 21.2 (58.6) 1,101.5 Reduction of reserve for anticipated future losses on discontinued products, net of tax - - 43.4 - 43.4 Net realized capital gains, net of tax 5.0 6.6 .5 - 12.1 Income (loss) from continuing operations $ 1,051.2 $ 99.3 $ 65.1 $ (58.6) $ 1,157.0 (1) Effective January 1, 2006, the Company adopted FAS 123R applying the modified retrospective approach. Accordingly, all prior-period financial information was adjusted to reflect the Company's stock-based compensation activity. (2) Refer to pages 11-13 for reconciliations of revenue calculated under GAAP for all periods. Refer to page 14 for definitions of terms used. 6
  • 9. Consolidated Balance Sheets ($ in Millions) September 30, December 31, September 30, December 31, 2006 2005 (1) 2006 2005 (1) Assets Liabilities and shareholders' equity Current assets: Current liabilities: Cash and cash equivalents $ 1,214.3 $ 1,192.6 Health care costs payable $ 1,954.5 $ 1,817.0 Investment securities 13,263.3 13,366.2 Future policy benefits 793.2 806.1 Other investments 234.1 96.8 Unpaid claims 778.7 752.1 Premiums receivable, net 429.0 349.2 Unearned premiums 187.7 156.9 Other receivables, net 533.3 366.7 Policyholders' funds 595.7 757.7 Accrued investment income 186.2 184.9 Collateral payable under securities loan agreements 924.4 1,138.8 Collateral received under securities loan agreements 924.4 1,138.8 Short-term debt 1.5 - Loaned securities 895.8 1,115.7 Current portion of long-term debt - 450.0 Deferred income taxes 35.8 - Income taxes payable 72.5 36.7 Other current assets 492.2 423.8 Deferred income taxes - 10.4 Total current assets 18,208.4 18,234.7 Accrued expenses and other current liabilities 1,891.0 1,691.1 Total current liabilities 7,199.2 7,616.8 Long-term investments 1,681.6 1,662.1 Future policy benefits 7,469.2 7,642.1 Mortgage loans 1,381.2 1,460.8 Unpaid claims 1,165.5 1,144.9 Investment real estate 188.1 207.2 Policyholders' funds 1,291.0 1,304.2 Reinsurance recoverables 1,115.7 1,143.7 Long-term debt, less current portion 2,442.0 1,155.7 Goodwill 4,622.7 4,523.2 Other long-term liabilities 810.7 848.5 Other acquired intangible assets, net 713.5 724.9 Separate Accounts liabilities 16,914.6 14,532.4 Property and equipment, net 276.3 272.8 Total liabilities 37,292.2 34,244.6 Deferred income taxes 40.1 68.7 Other long-term assets 1,800.1 1,602.8 Separate Accounts assets 16,914.6 14,532.4 Shareholders' equity Common stock and additional paid-in capital 660.4 2,414.7 Retained earnings 8,970.4 7,723.7 Accumulated other comprehensive income (2) 19.3 50.3 Total shareholders' equity 9,650.1 10,188.7 Total assets $ 46,942.3 $ 44,433.3 Total liabilities and shareholders' equity $ 46,942.3 $ 44,433.3 (1) Effective January 1, 2006, the Company adopted FAS 123R applying the modified retrospective approach. Accordingly, all prior-period financial information was adjusted to reflect the Company's stock-based compensation activity. (2) Includes net unrealized capital gains related to FAS No. 115 of $63.1 million and $104.1 million at September 30, 2006 and December 31, 2005, respectively, and a minimum pension liability adjustment of ($64.7) million at September 30, 2006 and December 31, 2005. Refer to page 14 for definitions of terms used. 7
  • 10. Combining Balance Sheets ($ in Millions) September 30, 2006 December 31, 2005 (1) Health Care Health Care and Group Large Case and Group Large Case Insurance Pensions Total Insurance Pensions Total Assets Current assets: Cash and cash equivalents $ 1,125.7 $ 88.6 $ 1,214.3 $ 1,036.1 $ 156.5 $ 1,192.6 Investment securities 8,071.4 5,191.9 13,263.3 7,845.6 5,520.6 13,366.2 Other investments 23.7 210.4 234.1 17.8 79.0 96.8 Premiums receivable, net 429.0 - 429.0 349.2 - 349.2 Other receivables, net 475.7 57.6 533.3 349.0 17.7 366.7 Accrued investment income 102.5 83.7 186.2 102.6 82.3 184.9 Collateral received under securities loan agreements 525.2 399.2 924.4 632.5 506.3 1,138.8 Loaned securities 508.9 386.9 895.8 619.8 495.9 1,115.7 Deferred income taxes 62.2 (26.4) 35.8 - - - Other current assets 459.2 33.0 492.2 396.1 27.7 423.8 Total current assets 11,783.5 6,424.9 18,208.4 11,348.7 6,886.0 18,234.7 Long-term investments 1,039.2 642.4 1,681.6 1,115.4 546.7 1,662.1 Mortgage loans 605.1 776.1 1,381.2 538.8 922.0 1,460.8 Investment real estate 93.9 94.2 188.1 94.1 113.1 207.2 Reinsurance recoverables 1,100.6 15.1 1,115.7 1,128.1 15.6 1,143.7 Goodwill 4,622.7 - 4,622.7 4,523.2 - 4,523.2 Other acquired intangible assets, net 713.5 - 713.5 724.9 - 724.9 Property and equipment, net 210.0 66.3 276.3 196.5 76.3 272.8 Deferred income taxes (187.8) 227.9 40.1 (79.3) 148.0 68.7 Other long-term assets 1,800.1 - 1,800.1 1,602.8 - 1,602.8 Separate Accounts assets 2.8 16,911.8 16,914.6 4.3 14,528.1 14,532.4 Total assets $ 21,783.6 $ 25,158.7 $ 46,942.3 $ 21,197.5 $ 23,235.8 $ 44,433.3 Liabilities and shareholders' equity Current liabilities: Health care costs payable $ 1,954.5 $ - $ 1,954.5 $ 1,817.0 $ - $ 1,817.0 Future policy benefits 123.1 670.1 793.2 118.4 687.7 806.1 Unpaid claims 778.2 .5 778.7 751.5 .6 752.1 Unearned premiums 180.8 6.9 187.7 151.1 5.8 156.9 Policyholders' funds 446.3 149.4 595.7 415.3 342.4 757.7 Collateral payable under securities loan agreements 525.2 399.2 924.4 632.5 506.3 1,138.8 Short-term debt 1.5 - 1.5 - - - Current portion of long-term debt - - - 450.0 - 450.0 Income taxes payable 85.0 (12.5) 72.5 26.2 10.5 36.7 Deferred income taxes - - - 21.0 (10.6) 10.4 Accrued expenses and other current liabilities 1,584.7 306.3 1,891.0 1,381.6 309.5 1,691.1 Total current liabilities 5,679.3 1,519.9 7,199.2 5,764.6 1,852.2 7,616.8 Future policy benefits 1,934.4 5,534.8 7,469.2 1,904.1 5,738.0 7,642.1 Unpaid claims 1,165.5 - 1,165.5 1,144.9 - 1,144.9 Policyholders' funds 578.4 712.6 1,291.0 580.9 723.3 1,304.2 Long-term debt, less current portion 2,442.0 - 2,442.0 1,155.7 - 1,155.7 Other long-term liabilities 788.1 22.6 810.7 816.2 32.3 848.5 Separate Accounts liabilities 2.8 16,911.8 16,914.6 4.3 14,528.1 14,532.4 Total liabilities 12,590.5 24,701.7 37,292.2 11,370.7 22,873.9 34,244.6 Shareholders' equity Total shareholders' equity 9,193.1 457.0 9,650.1 9,826.8 361.9 10,188.7 Total liabilities and shareholders' equity $ 21,783.6 $ 25,158.7 $ 46,942.3 $ 21,197.5 $ 23,235.8 $ 44,433.3 (1) Effective January 1, 2006, the Company adopted FAS 123R applying the modified retrospective approach. Accordingly, all prior-period financial information was adjusted to reflect the Company's stock-based compensation activity. Refer to page 14 for definitions of terms used. 8
  • 11. Condensed Combining Statements of Cash Flows ($ in Millions) Three Months Ended Sep. 30, 2006 Sep. 30, 2005 (1) Health Care Health Care and Group Large Case and Group Large Case Insurance Pensions Total Insurance Pensions Total Cash flows from operating activities: Net income $ 463.1 $ 13.3 $ 476.4 $ 362.2 $ 10.6 $ 372.8 Adjustments to reconcile net income to net cash provided by (used for) operating activities: Income from discontinued operations - - - - - Physician class action settlement insurance-related charge - - - - - Depreciation and amortization 69.5 - 69.5 53.6 - 53.6 Amortization (accretion) of net investment premium (discount) 6.1 (1.2) 4.9 7.6 (5.5) 2.1 Stock-based compensation expense 11.9 - 11.9 7.7 - 7.7 Net realized capital gains (11.3) (4.2) (15.5) (7.0) (1.5) (8.5) Cash flow from operating activities before balance sheet changes 539.3 7.9 547.2 424.1 3.6 427.7 Changes in assets and liabilities: (Increase) decrease in accrued investment income (2.9) (3.3) (6.2) 1.7 (2.0) (.3) Decrease (increase) in premiums due and other receivables 11.6 (.2) 11.4 (.3) 3.3 3.0 Net change in income taxes 149.0 (8.4) 140.6 43.1 10.9 54.0 Net change in other assets and other liabilities 81.9 (2) (25.8) 56.1 1.7 (2) (27.0) (25.3) Net (decrease) increase in health care and insurance liabilities (100.3) (49.9) (3) (150.2) 100.2 (73.1) (3) 27.1 Other, net (7.7) (13.2) (20.9) (6.9) (1.4) (8.3) Net cash provided by (used for) operating activities of continuing operations 670.9 (92.9) 578.0 563.6 (85.7) 477.9 Discontinued operations, net - - - - - - Net cash provided by (used for) operating activities 670.9 (92.9) 578.0 563.6 (85.7) 477.9 Cash flows from investing activities: Proceeds from sales and maturities of investments 1,884.2 979.5 2,863.7 2,138.5 880.7 3,019.2 Cost of investments (2,029.0) (656.6) (2,685.6) (2,051.6) (727.8) (2,779.4) Increase in property, equipment and software (66.9) - (66.9) (74.6) - (74.6) Cash used for acquisitions, net of cash acquired (1.1) - (1.1) (390.4) - (390.4) Net cash (used for) provided by investing activities (212.8) 322.9 110.1 (378.1) 152.9 (225.2) Cash flows from financing activities: Deposits and interest credited for investment contracts - 9.1 9.1 - 10.6 10.6 Withdrawals of investment contracts - (180.5) (180.5) - (6.9) (6.9) Net repayment of short-term debt (14.1) (17.4) (31.5) - - - Proceeds from issuance of long-term debt, net of issuance costs - - - - - - Repayment of long-term debt - - - - - - Common shares issued under benefit plans 22.0 - 22.0 44.4 - 44.4 Stock-based compensation tax benefits 12.8 - 12.8 21.5 - 21.5 Common shares repurchased (954.3) - (954.3) (408.5) - (408.5) Other, net 7.1 (7.1) - 9.7 (9.7) - Net cash used for financing activities (926.5) (195.9) (1,122.4) (332.9) (6.0) (338.9) Net (decrease) increase in cash and cash equivalents (468.4) 34.1 (434.3) (147.4) 61.2 (86.2) Cash and cash equivalents, beginning of period 1,594.1 54.5 1,648.6 1,050.6 68.3 1,118.9 Cash and cash equivalents, end of period $ 1,125.7 $ 88.6 $ 1,214.3 $ 903.2 $ 129.5 $ 1,032.7 (1) Effective January 1, 2006, the Company adopted FAS 123R applying the modified retrospective approach. Accordingly, all prior-period financial information was adjusted to reflect the Company's stock-based compensation activity. (2) Includes voluntary pension plan contributions of approximately $65 million for the three months ended September 30, 2006 and 2005. (3) Changes in insurance liabilities are satisfied by sales of related investment assets included in net cash provided by investment activities. Refer to page 14 for definitions of terms used. 9
  • 12. Condensed Combining Statements of Cash Flows (Continued) ($ in Millions) Nine Months Ended Sep. 30, 2006 Sep. 30, 2005 (1) Health Care Health Care and Group Large Case and Group Large Case Insurance Pensions Total Insurance Pensions Total Cash flows from operating activities: Net income $ 1,152.6 $ 115.0 $ 1,267.6 $ 1,091.9 $ 65.1 $ 1,157.0 Adjustments to reconcile net income to net cash provided by (used for) operating activities: Income from discontinued operations (16.1) - (16.1) - - - Physician class action settlement insurance-related charge 72.4 - 72.4 - - - Depreciation and amortization 197.9 - 197.9 147.5 - 147.5 Amortization (accretion) of net investment premium (discount) 18.7 (5.4) 13.3 25.6 (6.1) 19.5 Stock-based compensation expense 61.9 - 61.9 83.8 - 83.8 Net realized capital gains (6.5) (15.4) (21.9) (17.8) (.8) (18.6) Cash flow from operating activities before balance sheet changes 1,480.9 94.2 1,575.1 1,331.0 58.2 1,389.2 Changes in assets and liabilities: Decrease (increase) in accrued investment income .1 (1.4) (1.3) 5.2 6.8 12.0 (Increase) decrease in premiums due and other receivables (122.2) (.4) (122.6) (113.1) 6.4 (106.7) Net change in income taxes 62.6 5.9 68.5 274.2 16.4 290.6 Net change in other assets and other liabilities (262.2) (2) (8.5) (270.7) (385.2) (2) 2.1 (383.1) Net increase (decrease) in health care and insurance liabilities 238.1 (274.5) (3) (36.4) 176.9 (237.3) (3) (60.4) Other, net (19.0) (50.3) (69.3) (5.5) (26.9) (32.4) Net cash provided by (used for) operating activities of continuing operations 1,378.3 (235.0) 1,143.3 1,283.5 (174.3) 1,109.2 Discontinued operations, net 49.7 - 49.7 - - - Net cash provided by (used for) operating activities 1,428.0 (235.0) 1,193.0 1,283.5 (174.3) 1,109.2 Cash flows from investing activities: Proceeds from sales and maturities of investments 6,177.3 2,883.7 9,061.0 6,121.0 2,756.0 8,877.0 Cost of investments (6,216.8) (2,534.1) (8,750.9) (5,743.8) (2,551.8) (8,295.6) Increase in property, equipment and software (203.8) - (203.8) (183.1) - (183.1) Cash used for acquisitions, net of cash acquired (159.9) - (159.9) (1,021.5) - (1,021.5) Net cash (used for) provided by investing activities (403.2) 349.6 (53.6) (827.4) 204.2 (623.2) Cash flows from financing activities: Deposits and interest credited for investment contracts - 23.4 23.4 - 30.6 30.6 Withdrawals of investment contracts - (195.0) (195.0) - (30.2) (30.2) Net issuance of short-term debt 1.5 - 1.5 - - - Proceeds from issuance of long-term debt, net of issuance costs 1,978.9 - 1,978.9 - - - Repayment of long-term debt (1,150.0) - (1,150.0) - - - Common shares issued under benefit plans 81.3 - 81.3 223.5 - 223.5 Stock-based compensation tax benefits 66.5 - 66.5 137.5 - 137.5 Common shares repurchased (1,924.3) - (1,924.3) (1,210.7) - (1,210.7) Other, net 10.9 (10.9) - (3.7) 3.7 - Net cash (used for) provided by financing activities (935.2) (182.5) (1,117.7) (853.4) 4.1 (849.3) Net increase (decrease) in cash and cash equivalents 89.6 (67.9) 21.7 (397.3) 34.0 (363.3) Cash and cash equivalents, beginning of period 1,036.1 156.5 1,192.6 1,300.5 95.5 1,396.0 Cash and cash equivalents, end of period $ 1,125.7 $ 88.6 $ 1,214.3 $ 903.2 $ 129.5 $ 1,032.7 (1) Effective January 1, 2006, the Company adopted FAS 123R applying the modified retrospective approach. Accordingly, all prior-period financial information was adjusted to reflect the Company's stock-based compensation activity. (2) Includes voluntary pension plan contributions of approximately $245 million for the nine months ended September 30, 2006 and September 30, 2005 and physician class action settlement payment of approximately $150 million for the nine months ended September 30, 2005. (3) Includes a reduction of the reserve for anticipated future losses on discontinued products of $115 million and $67 million for the nine months ended September 30, 2006 and September 30, 2005, respectively. Changes in insurance liabilities are satisfied by sales of related investment assets included in net cash provided by investment activities. Refer to page 14 for definitions of terms used. 10
  • 13. Reconciliations of Certain Reported Amounts to the Most Directly Comparable GAAP Measure (1) ($ in Millions, except per common share data) Three Months Ended Nine Months Ended Sep. 30, Sep. 30, Sep. 30, Sep. 30, 2006 2005 2006 2005 Reconciliation to Income from continuing operations before income taxes Operating earnings before income taxes, excluding interest expense, amortization of other acquired intangible assets and favorable development (A) $ 730.2 $ 596.8 Favorable development of prior-period health care cost estimates 45.0 24.0 Operating earnings before income taxes, excluding interest expense and amortization of other acquired intangible assets (B) 775.2 620.8 $ 2,050.3 $ 1,847.4 Interest expense (39.9) (32.5) (107.2) (90.2) Amortization of other acquired intangible assets (22.0) (15.9) (63.7) (38.1) Debt refinancing charge - - (12.4) - Physician class action settlement insurance-related charge - - (72.4) - Reduction of reserve for anticipated future losses on discontinued products - - 115.4 66.7 Acquisition-related software charge - - (8.3) - Net realized capital gains 15.5 8.5 21.9 18.6 Income from continuing operations before income taxes (GAAP measure) (C) $ 728.8 $ 580.9 $ 1,923.6 $ 1,804.4 Reconciliation to Income from continuing operations Operating earnings, excluding interest expense, amortization of other acquired intangible assets and favorable development (D) $ 477.5 $ 383.7 Favorable development of prior-period health care cost estimates, net of tax 29.0 15.0 Operating earnings, excluding interest expense and amortization of other acquired intangible assets (E) 506.5 398.7 $ 1,334.7 $ 1,184.9 Interest expense, net of tax (25.9) (21.1) (69.6) (58.6) Amortization of other acquired intangible assets, net of tax (14.3) (10.3) (41.4) (24.8) Debt refinancing charge, net of tax - - (8.1) - Physician class action settlement insurance-related charge, net of tax - - (47.1) - Reduction of reserve for anticipated future losses on discontinued products, net of tax - - 75.0 43.4 Acquisition-related software charge, net of tax - - (6.2) - Net realized capita1 gains, net of tax 10.1 5.5 14.2 12.1 Income from continuing operations (GAAP measure) (F) $ 476.4 $ 372.8 $ 1,251.5 $ 1,157.0 Reconciliation of Revenue Revenue, excluding net realized capital gains (G) $ 6,284.0 $ 5,692.2 $ 18,764.3 $ 16,605.9 Net realized capital gains 15.5 8.5 21.9 18.6 Total revenue (GAAP measure) (H) $ 6,299.5 $ 5,700.7 $ 18,786.2 $ 16,624.5 Operating margin Pretax operating margin (B)/(G) 12.3 % 10.9 % 10.9 % 11.1 % Pretax operating margin - Adjusted (A)/(G) 11.6 % 10.5 % Pretax operating margin (GAAP measure) (C)/(H) 11.6 % 10.2 % 10.2 % 10.9 % After-tax operating margin (E)/(G) 8.1 % 7.0 % 7.1 % 7.1 % After-tax operating margin - Adjusted (D)/(G) 7.6 % 6.7 % After-tax operating margin (GAAP measure) (F)/(H) 7.6 % 6.5 % 6.7 % 7.0 % (1) Effective January 1, 2006, the Company adopted FAS 123R applying the modified retrospective approach. Accordingly, all prior-period financial information was adjusted to reflect the Company's stock-based compensation activity. Refer to page 14 for definitions of terms used. 11
  • 14. Reconciliations of Certain Reported Amounts to the Most Directly Comparable GAAP Measure (Continued) (1) ($ in Millions) Three Months Ended Nine Months Ended Sep. 30, Sep. 30, Sep. 30, Sep. 30, 2006 2005 2006 2005 Aetna Inc. Reconciliation of Operating Expenses Operating expenses, excluding other items (A) $ 1,157.3 $ 1,099.2 $ 3,498.5 $ 3,296.5 Debt refinancing charge - - 12.4 - Physician class action settlement insurance-related charge - - 72.4 - Acquisition-related software charge - - 8.3 - Total operating expenses (GAAP measure) (B) $ 1,157.3 $ 1,099.2 $ 3,591.6 $ 3,296.5 Reconciliation of Revenue Revenue, excluding net realized capital gains (C) $ 6,284.0 $ 5,692.2 $ 18,764.3 $ 16,605.9 Net realized capital gains 15.5 8.5 21.9 18.6 Total revenue (GAAP measure) (D) $ 6,299.5 $ 5,700.7 $ 18,786.2 $ 16,624.5 Operating expenses as a % of revenue Operating expenses as a % of revenue (A)/(C) 18.4 % 19.3 % 18.6 % 19.9 % Total operating expenses as a % of total revenue (GAAP measure) (B)/(D) 18.4 % 19.3 % 19.1 % 19.8 % Health Care Reconciliation of Operating Expenses Operating expenses, excluding other items (E) $ 1,074.6 $ 1,031.8 $ 3,261.3 $ 3,097.0 Debt refinancing charge - - 12.4 - Physician class action settlement insurance-related charge - - 72.4 - Total operating expenses (GAAP measure) (F) $ 1,074.6 $ 1,031.8 $ 3,346.1 $ 3,097.0 Reconciliation of Revenue Revenue, excluding net realized capital gains (G) $ 5,588.1 $ 4,984.2 $ 16,610.3 $ 14,469.2 Net realized capital gains 3.5 1.9 2.3 7.7 Total revenue (GAAP measure) (H) $ 5,591.6 $ 4,986.1 $ 16,612.6 $ 14,476.9 Operating expenses as a % of revenue Operating expenses as a % of revenue (E)/(G) 19.2 % 20.7 % 19.6 % 21.4 % Total operating expenses as a % of total revenue (GAAP measure) (F)/(H) 19.2 % 20.7 % 20.1 % 21.4 % (1) Effective January 1, 2006, the Company adopted FAS 123R applying the modified retrospective approach. Accordingly, all prior-period financial information was adjusted to reflect the Company's stock-based compensation activity. Refer to page 14 for definitions of terms used. 12