Download as PDF, PPTX
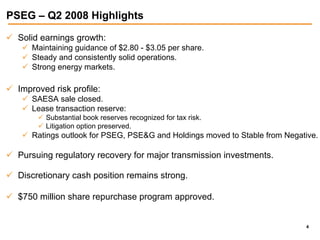
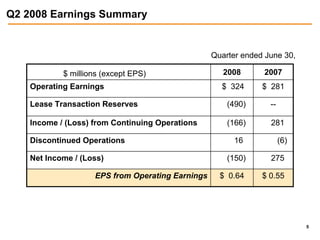
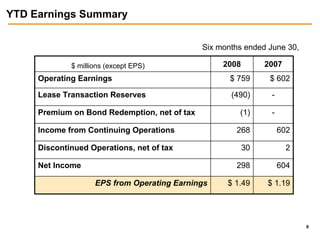
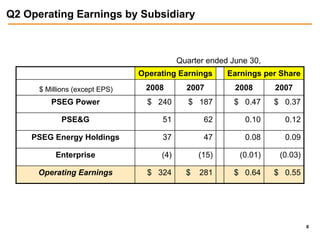
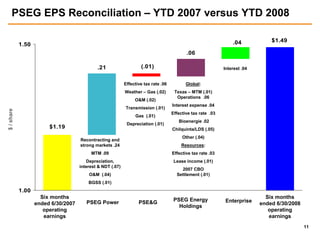
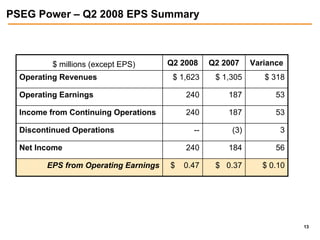
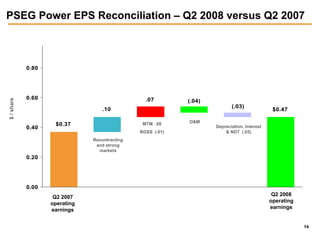
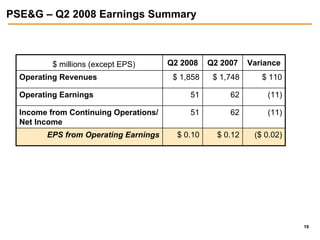
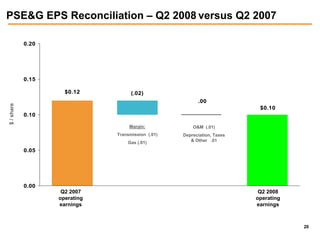
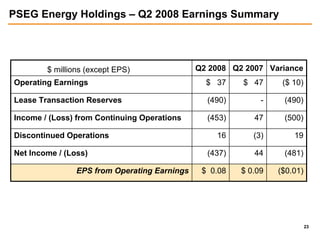
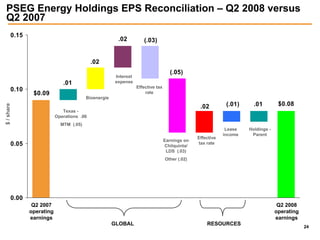

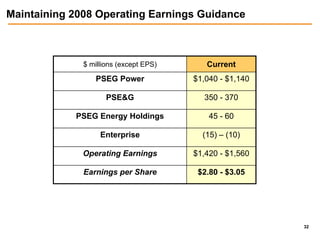
PSEG reported lower earnings for Q2 2008 compared to Q2 2007. Operating earnings were $324 million versus $281 million last year. However, the company recorded a $490 million reserve related to a lease transaction, resulting in a reported net loss of $150 million. Key drivers for the lower operating results included higher O&M costs and depreciation expense partially offset by improved performance at PSEG Power due to contract roll-offs and higher energy prices. PSEG maintained its full-year earnings guidance range of $2.80-$3.05 per share.


