


![40
TRANSPARENCY
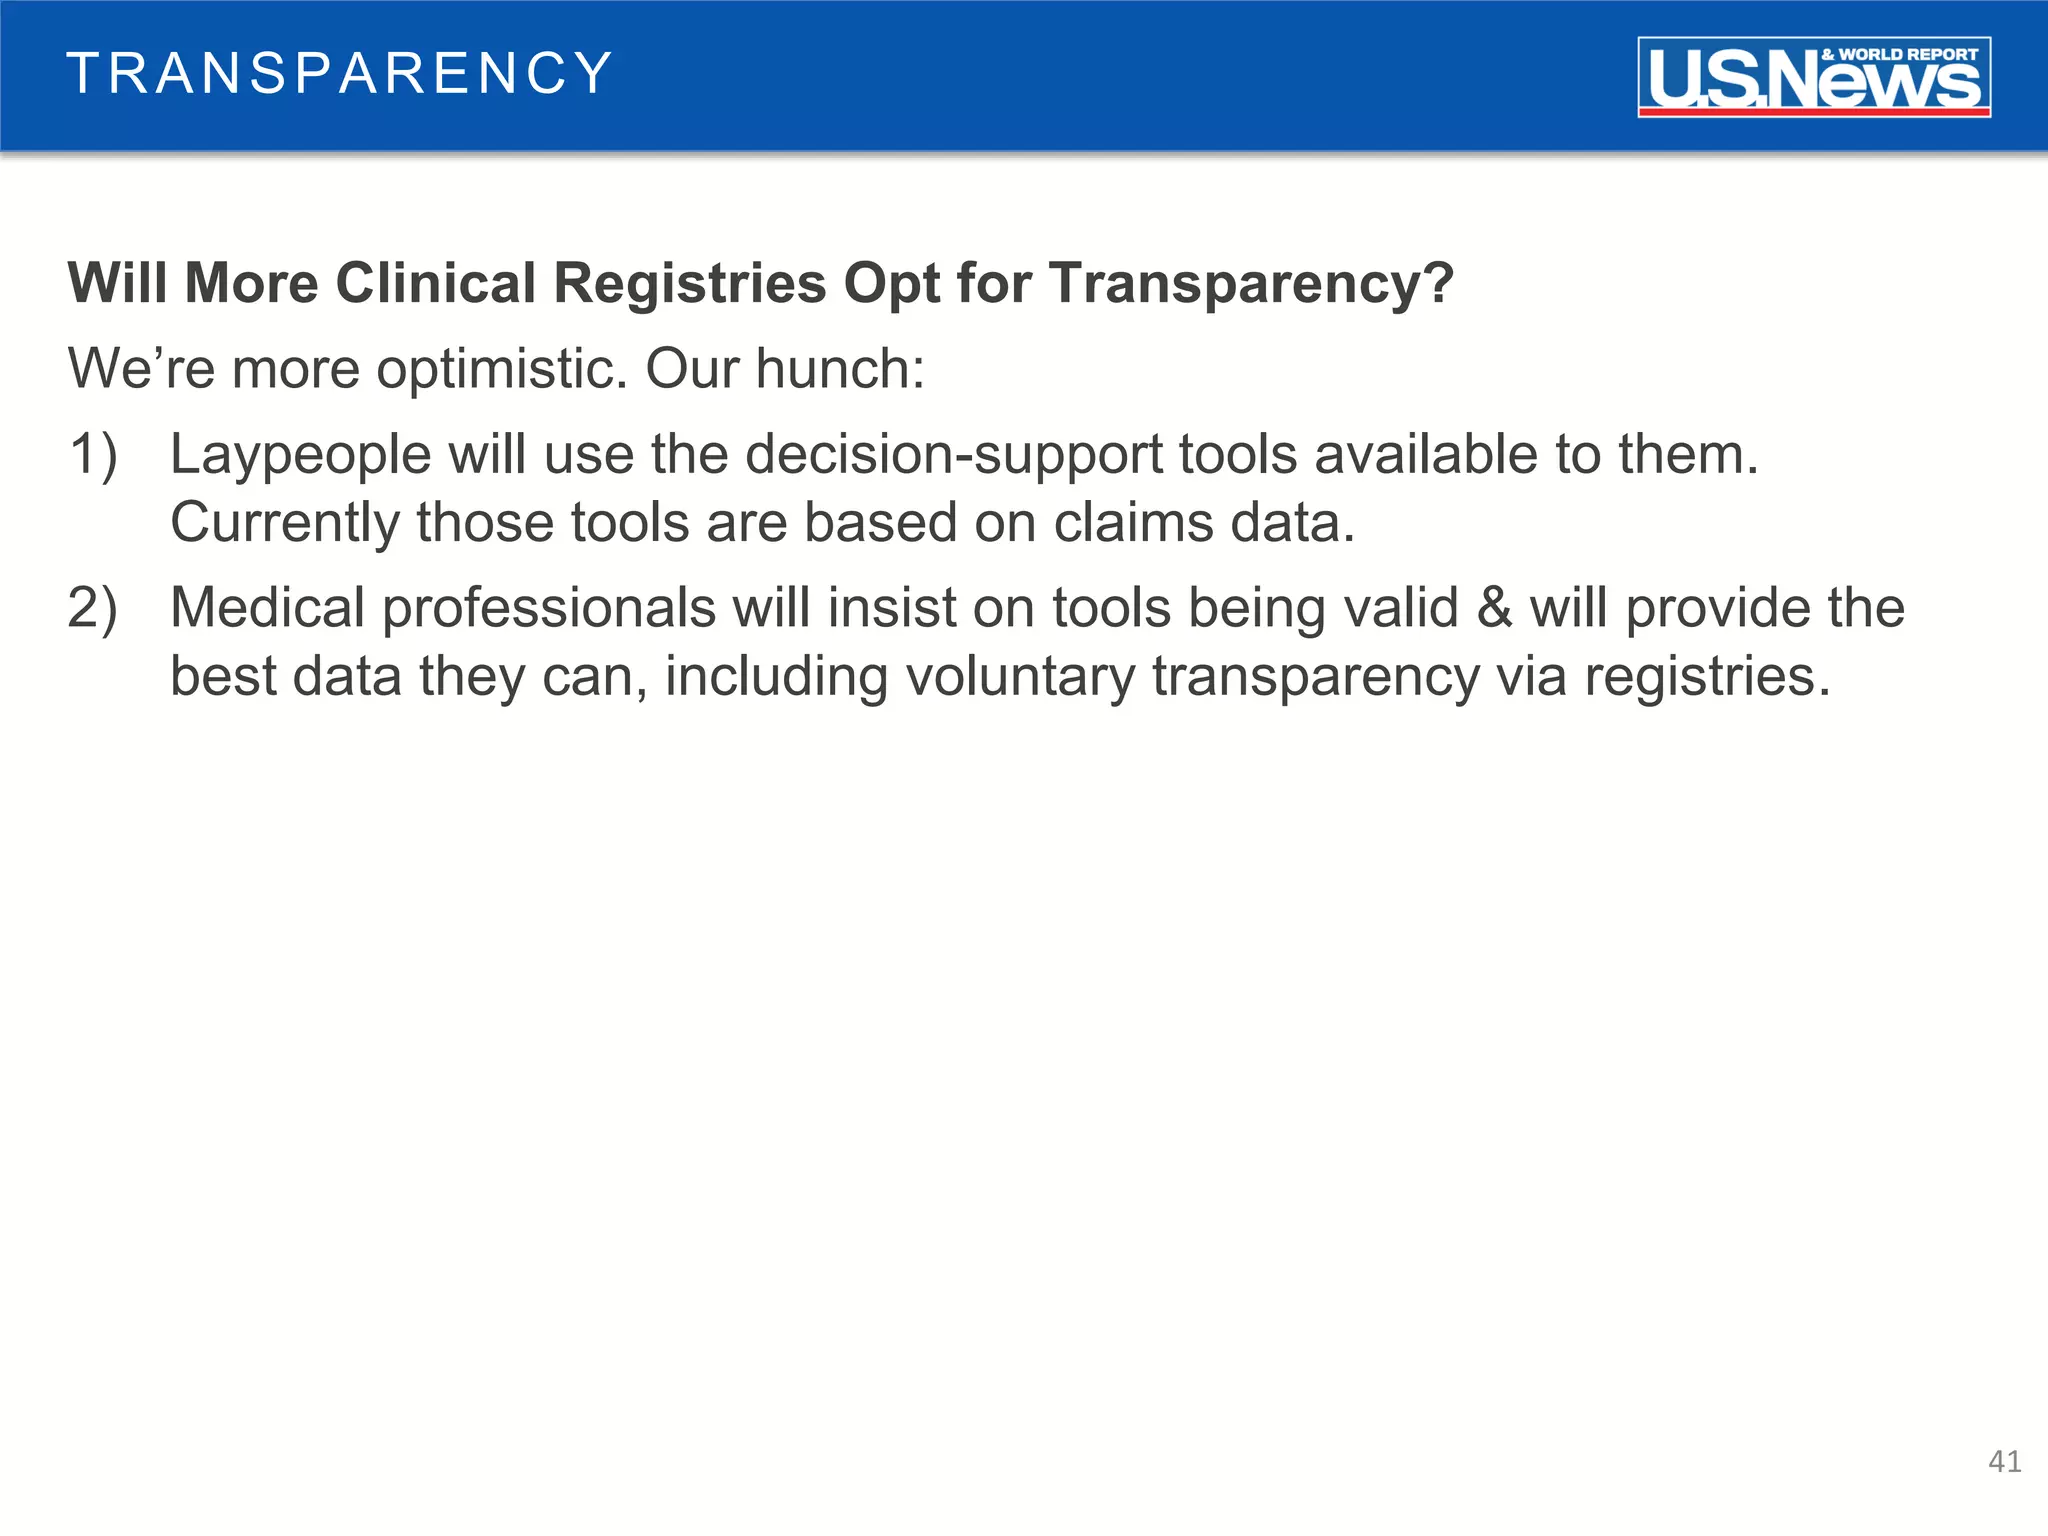
Will More Clinical Registries Opt for Transparency?
• One observer thinks not:
“the medical priesthood [says]: ‘You are not worthy to judge us.’ ”](https://image.slidesharecdn.com/atlas-benharder-public-151103161845-lva1-app6891/75/Public-Reporting-as-a-Catalyst-for-Better-Consumer-Decisions-40-2048.jpg)


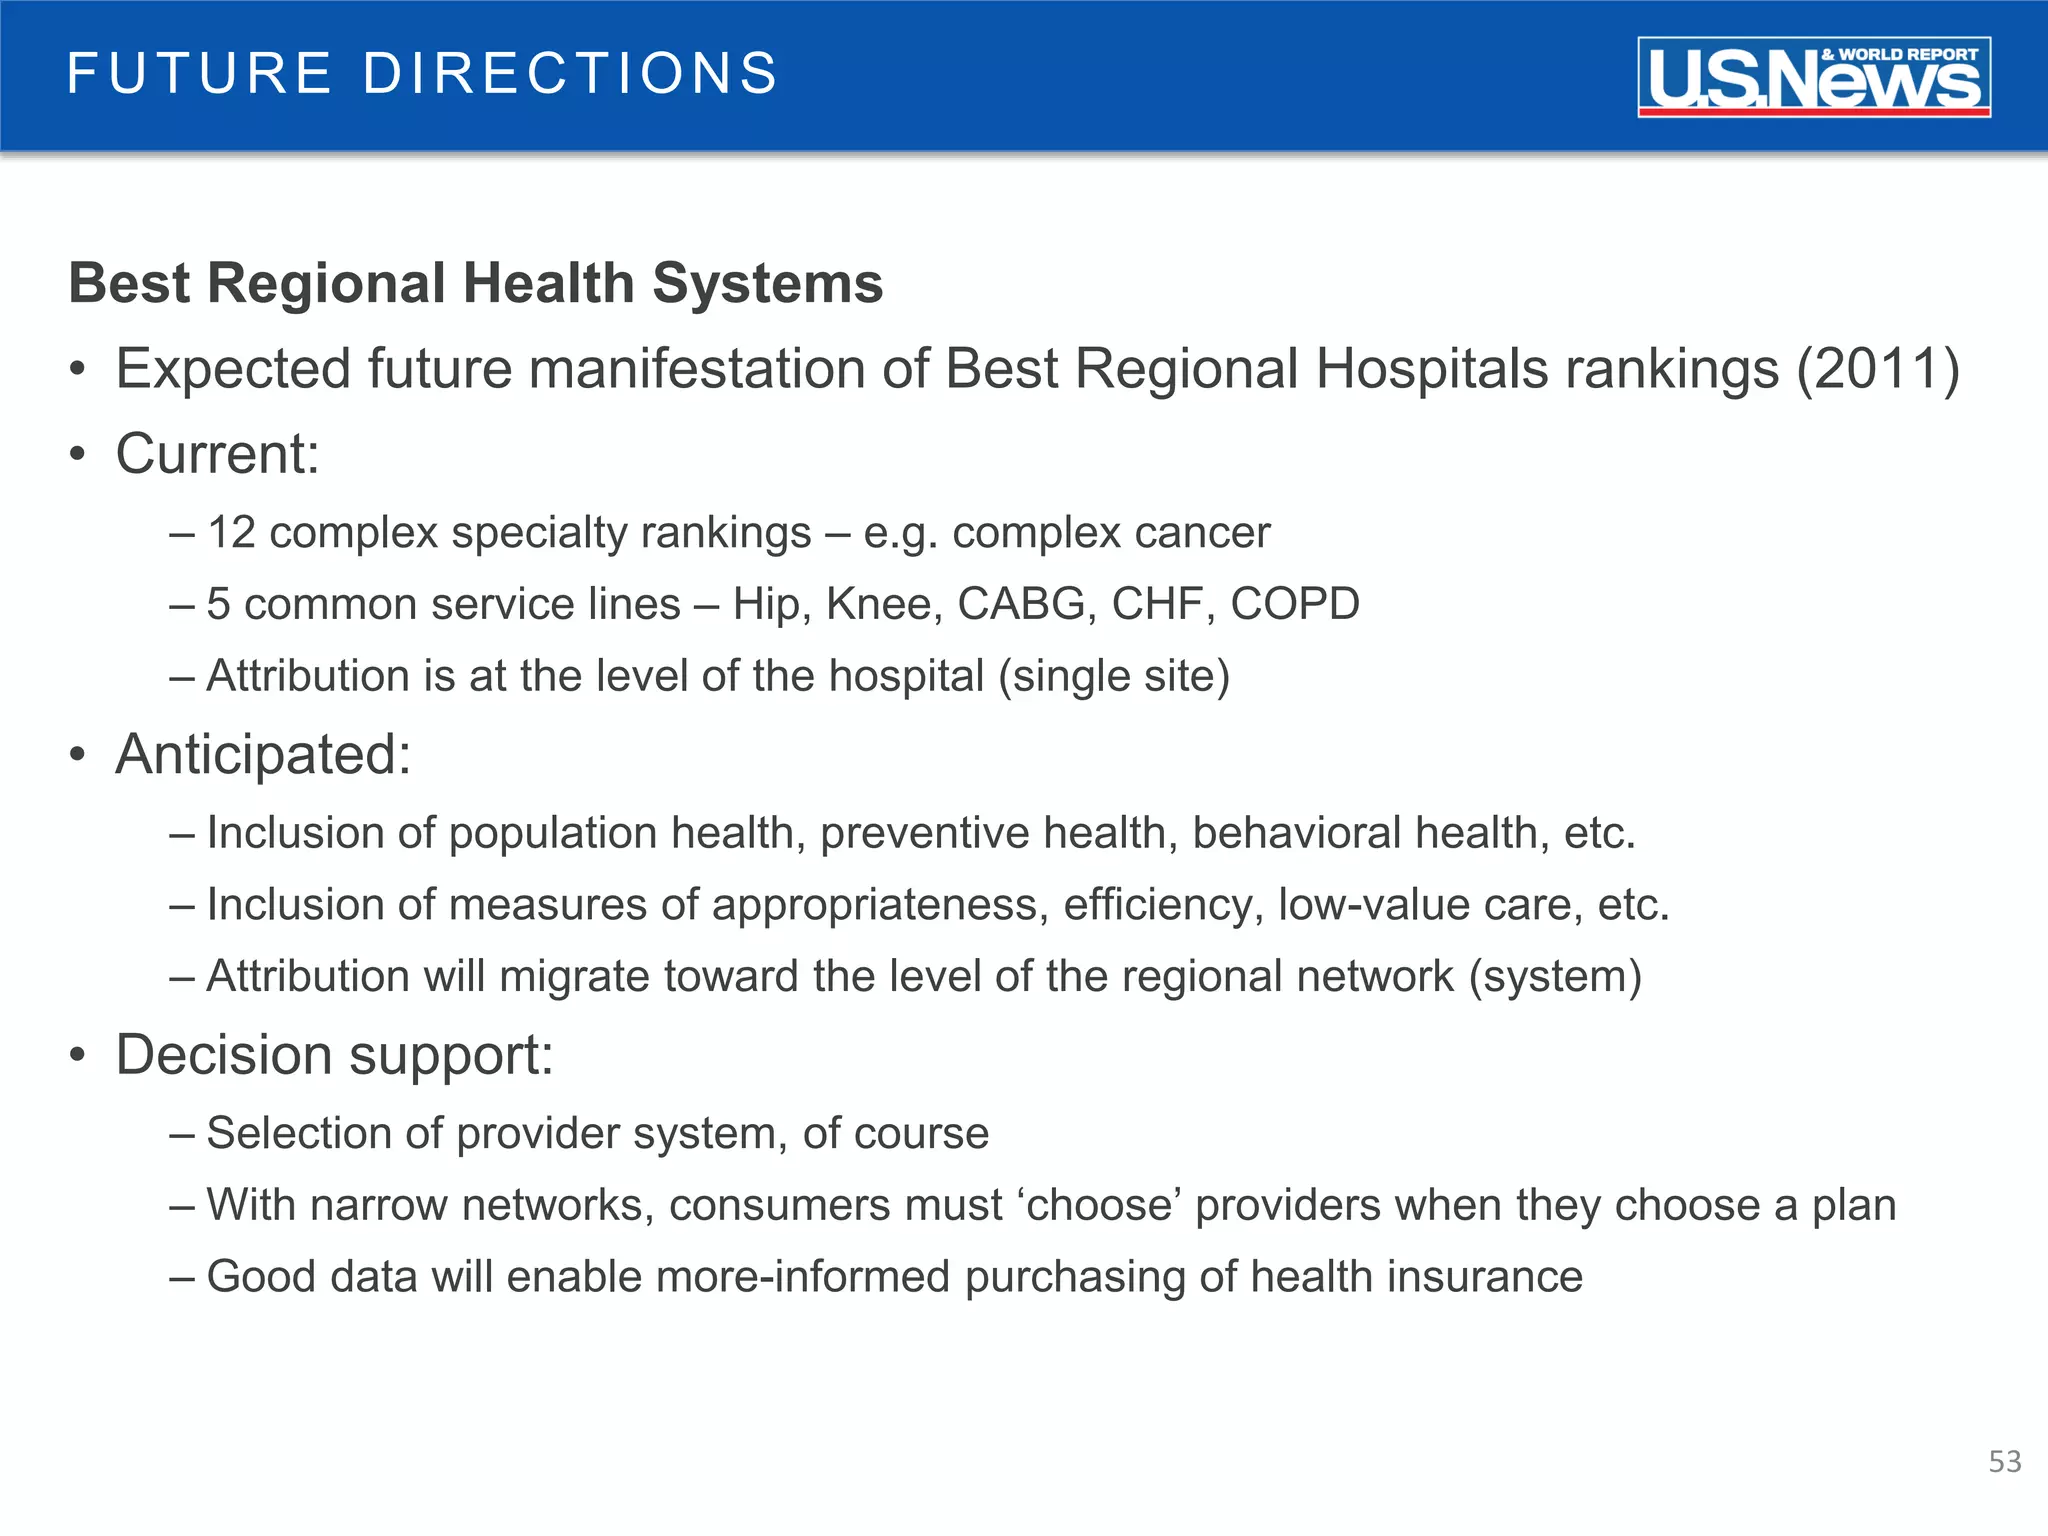
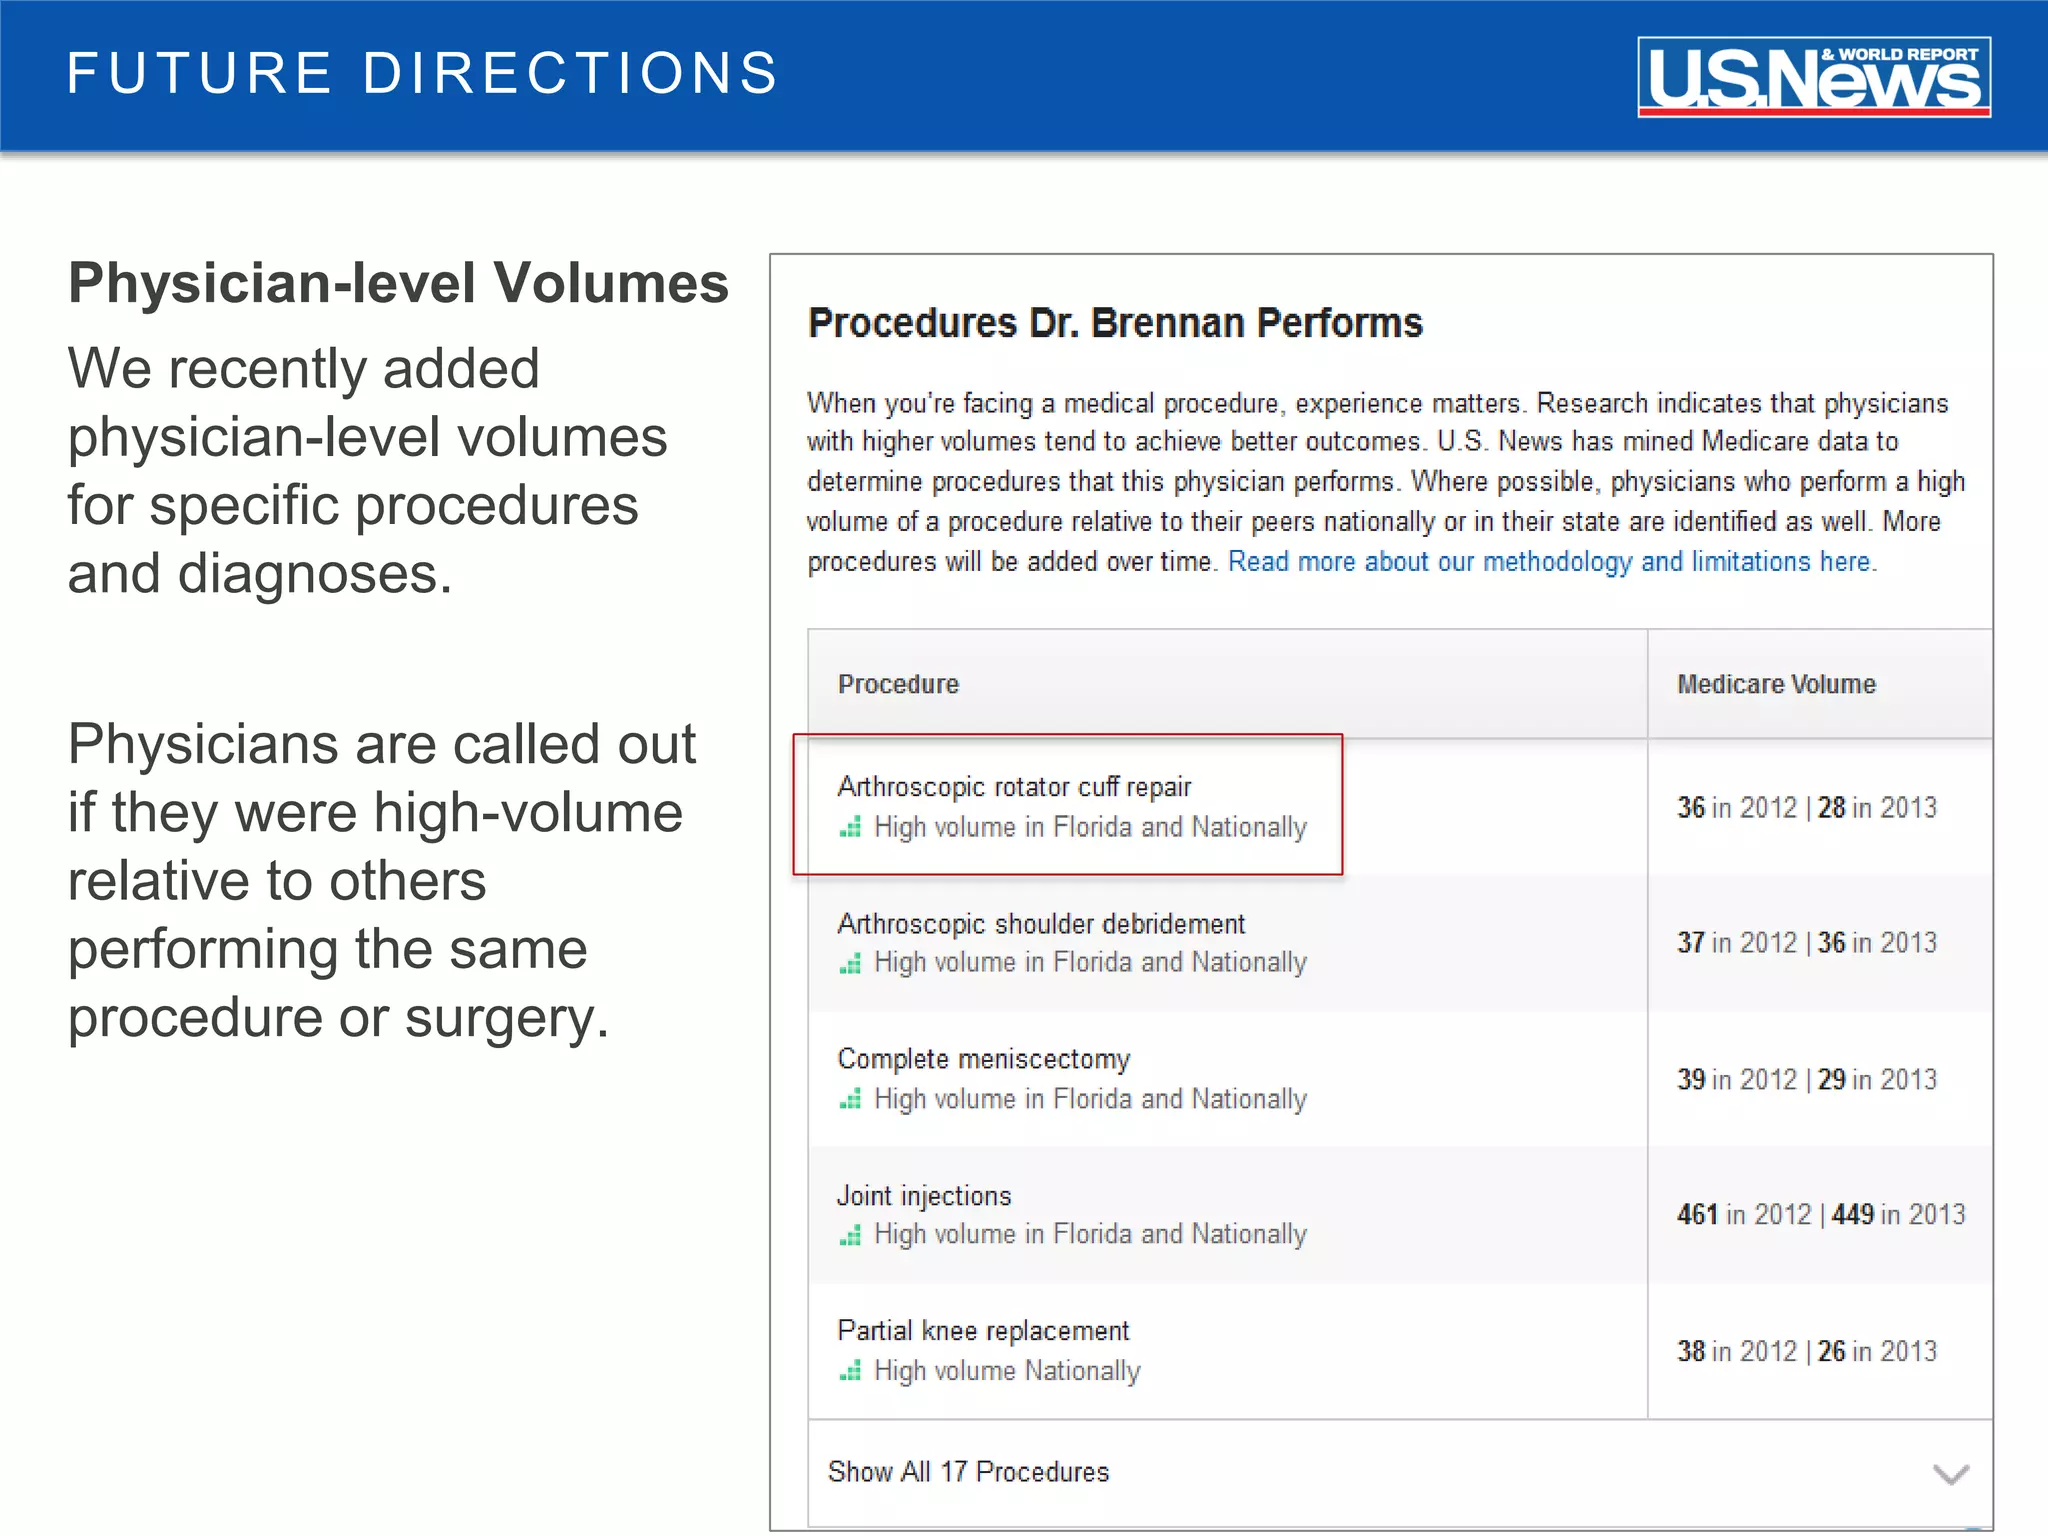
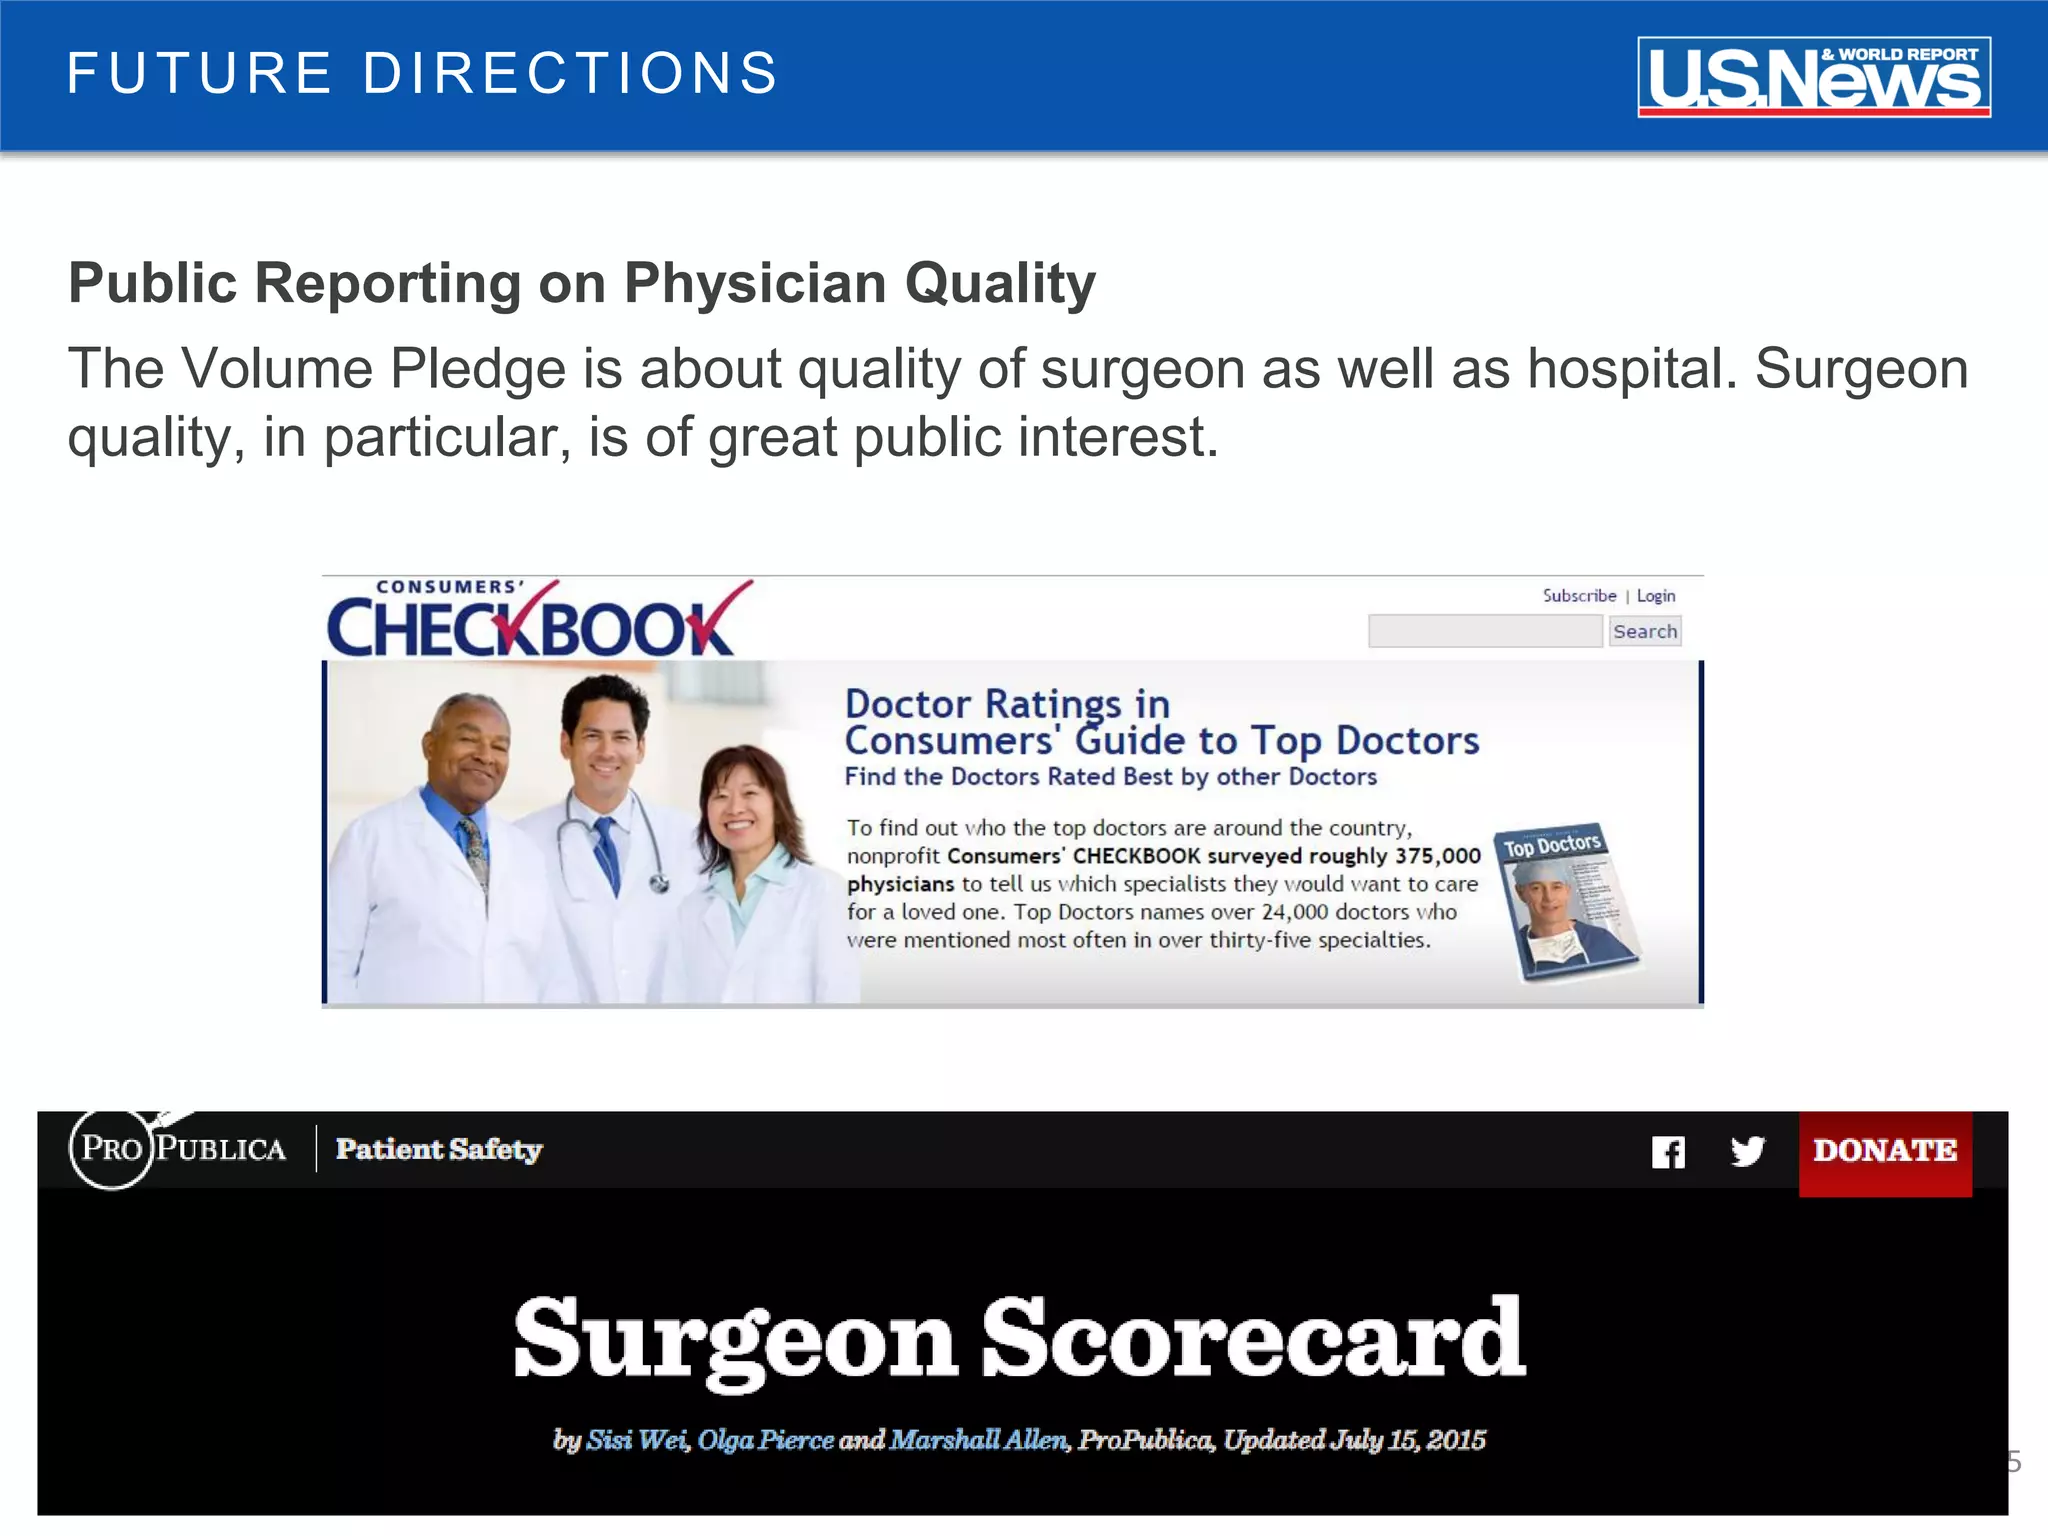
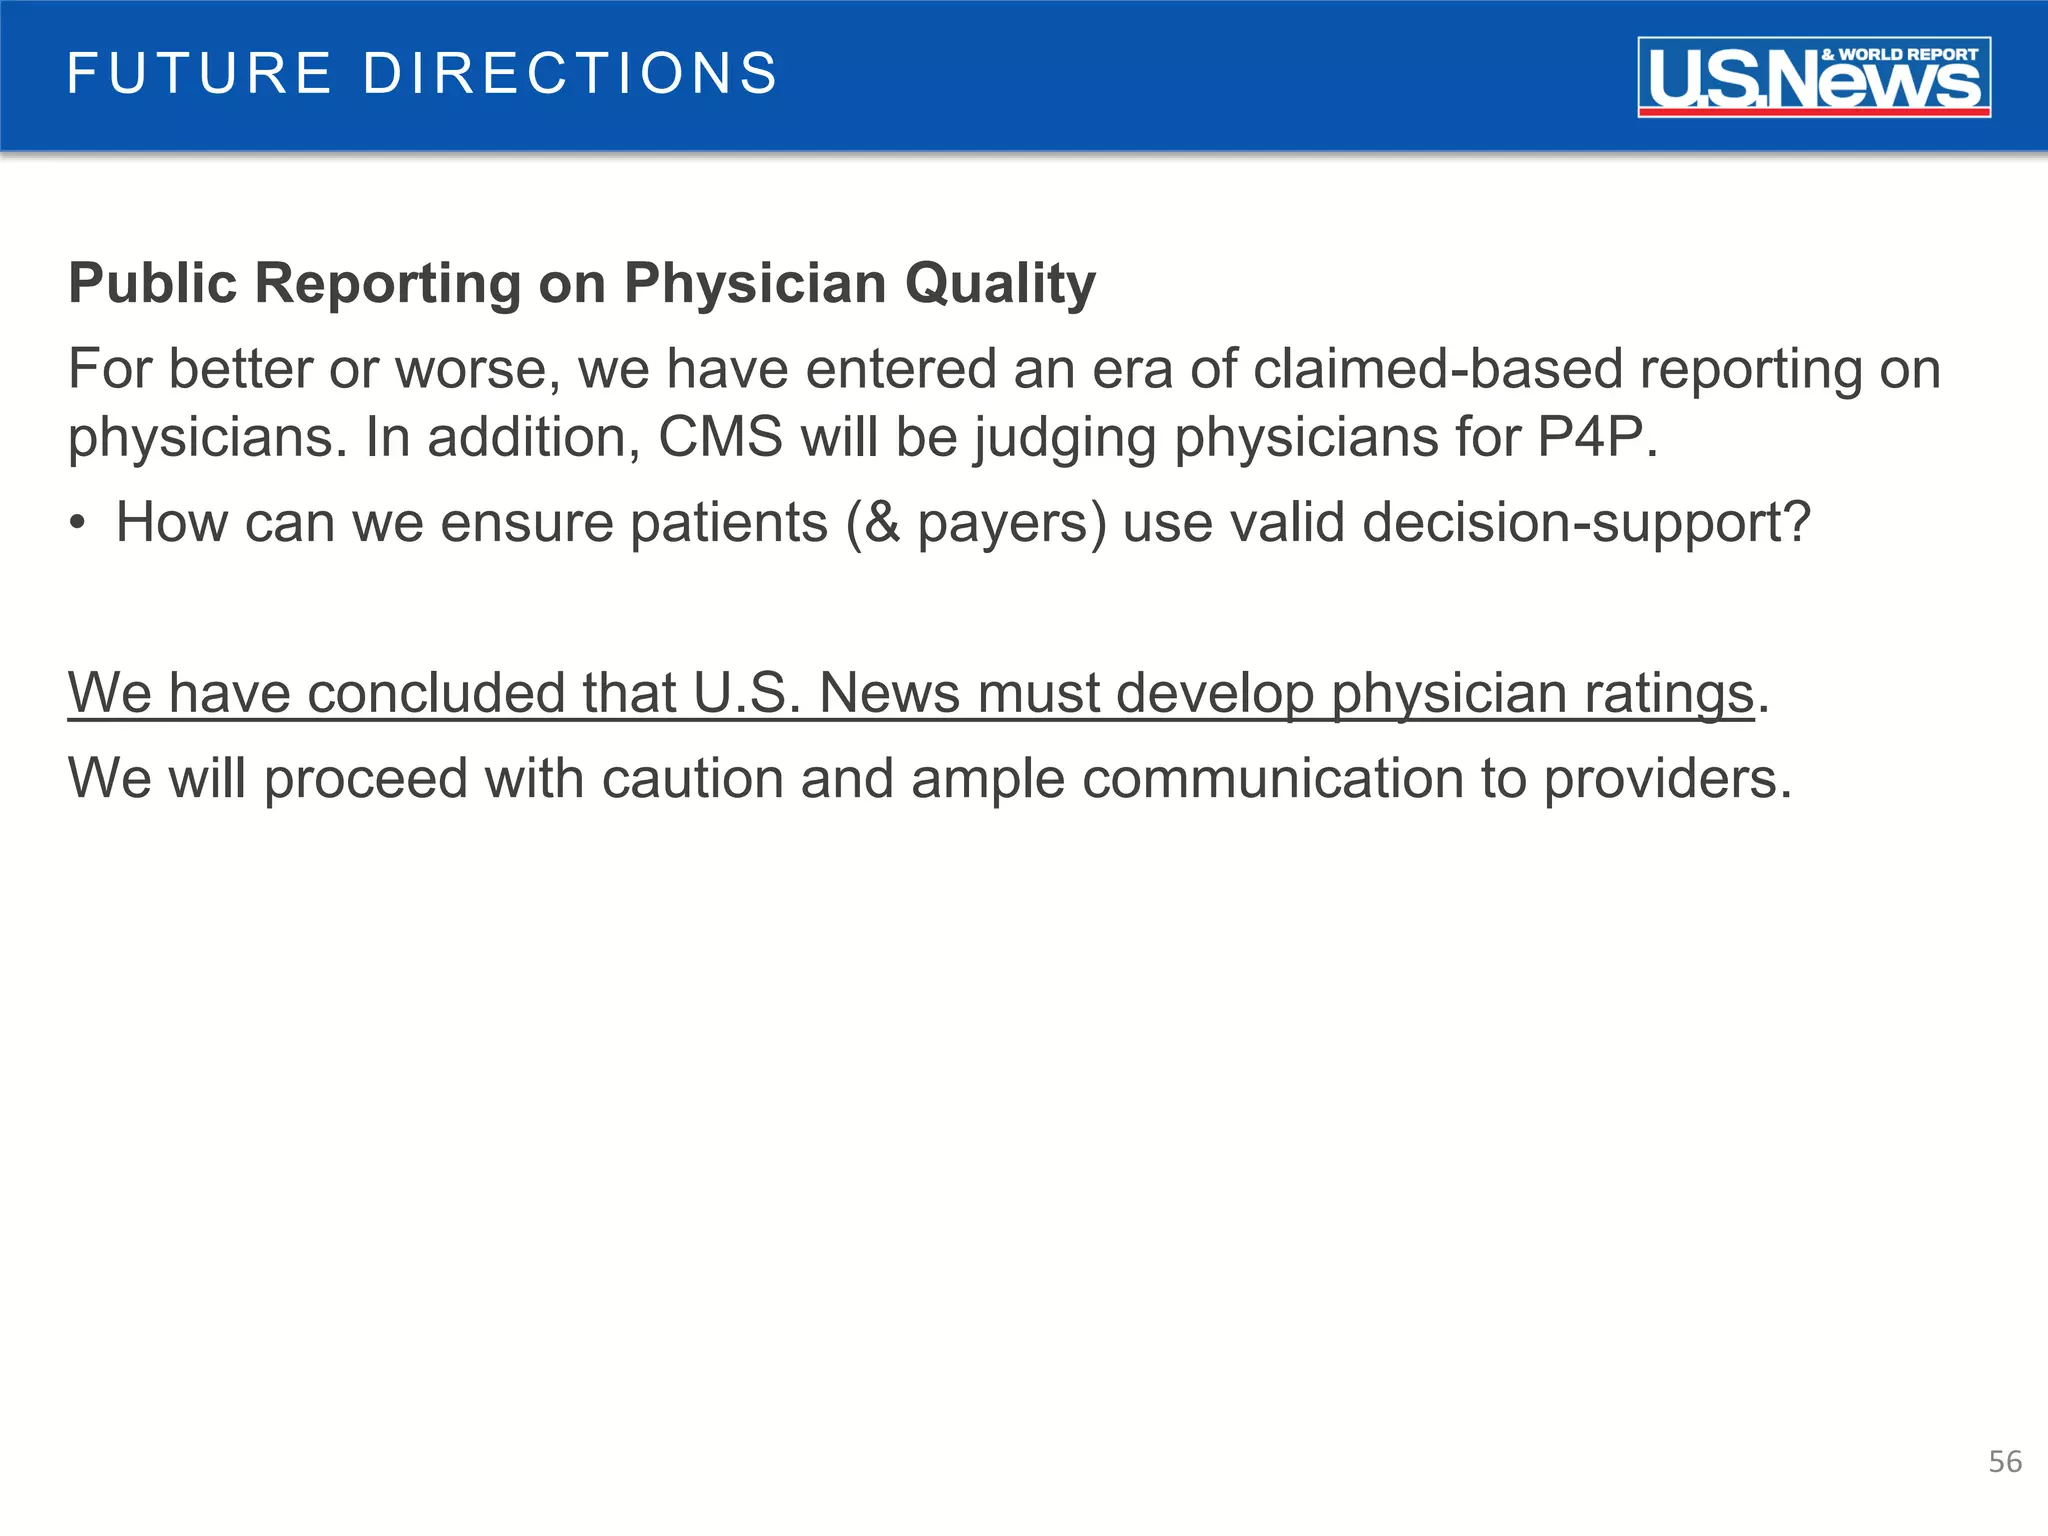
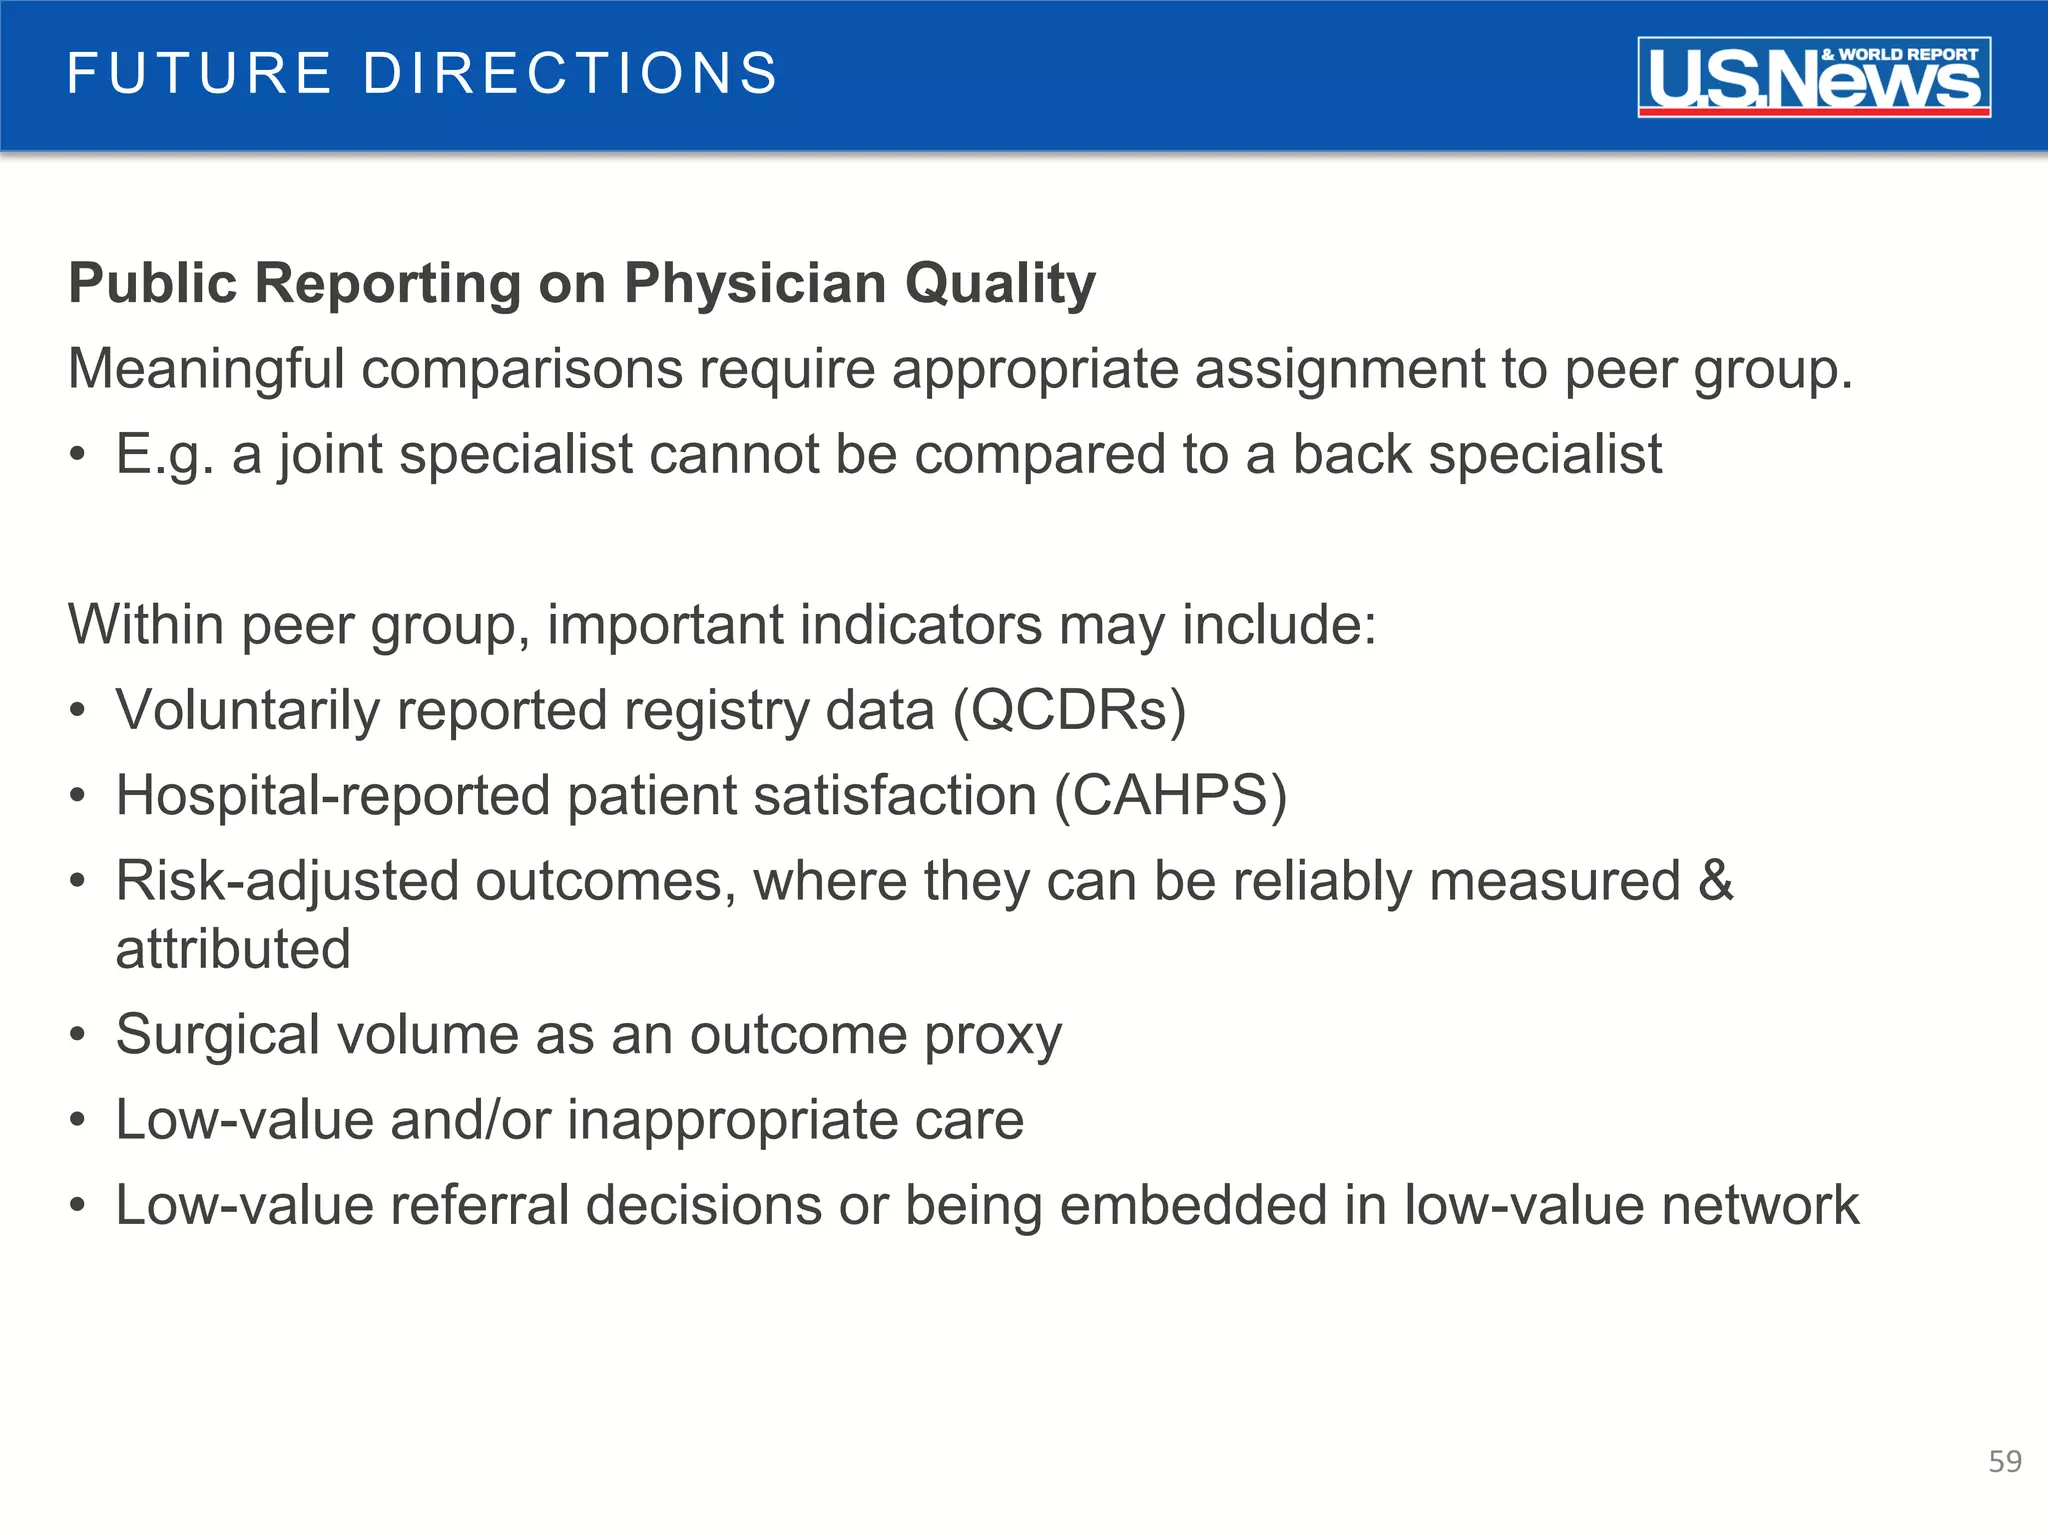
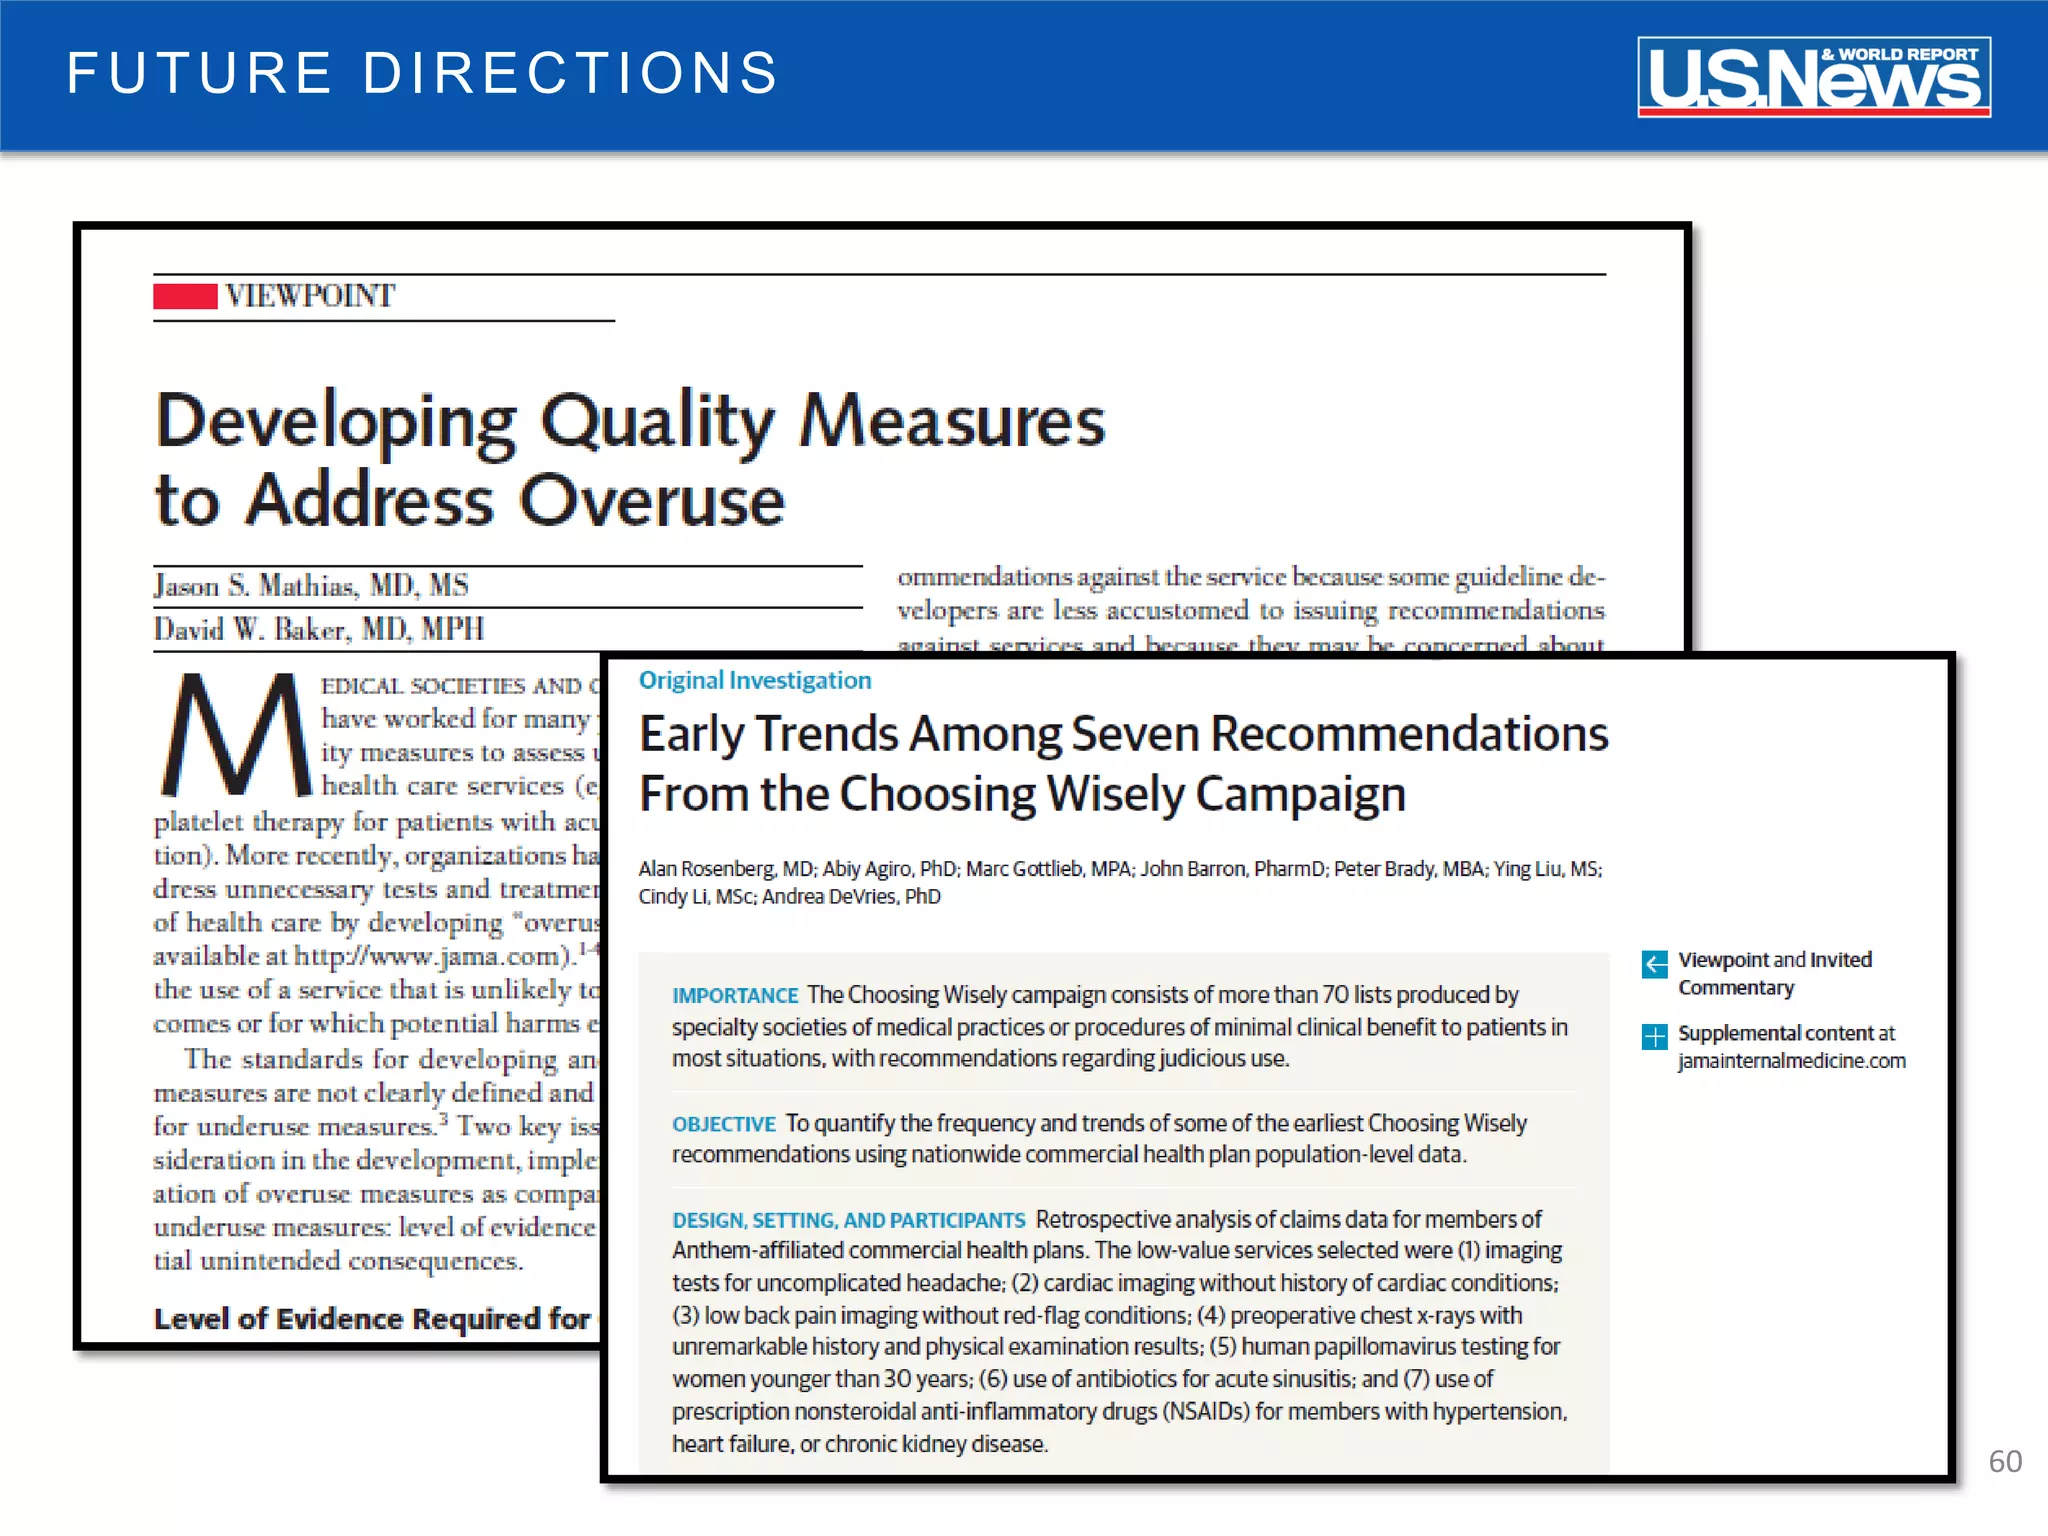
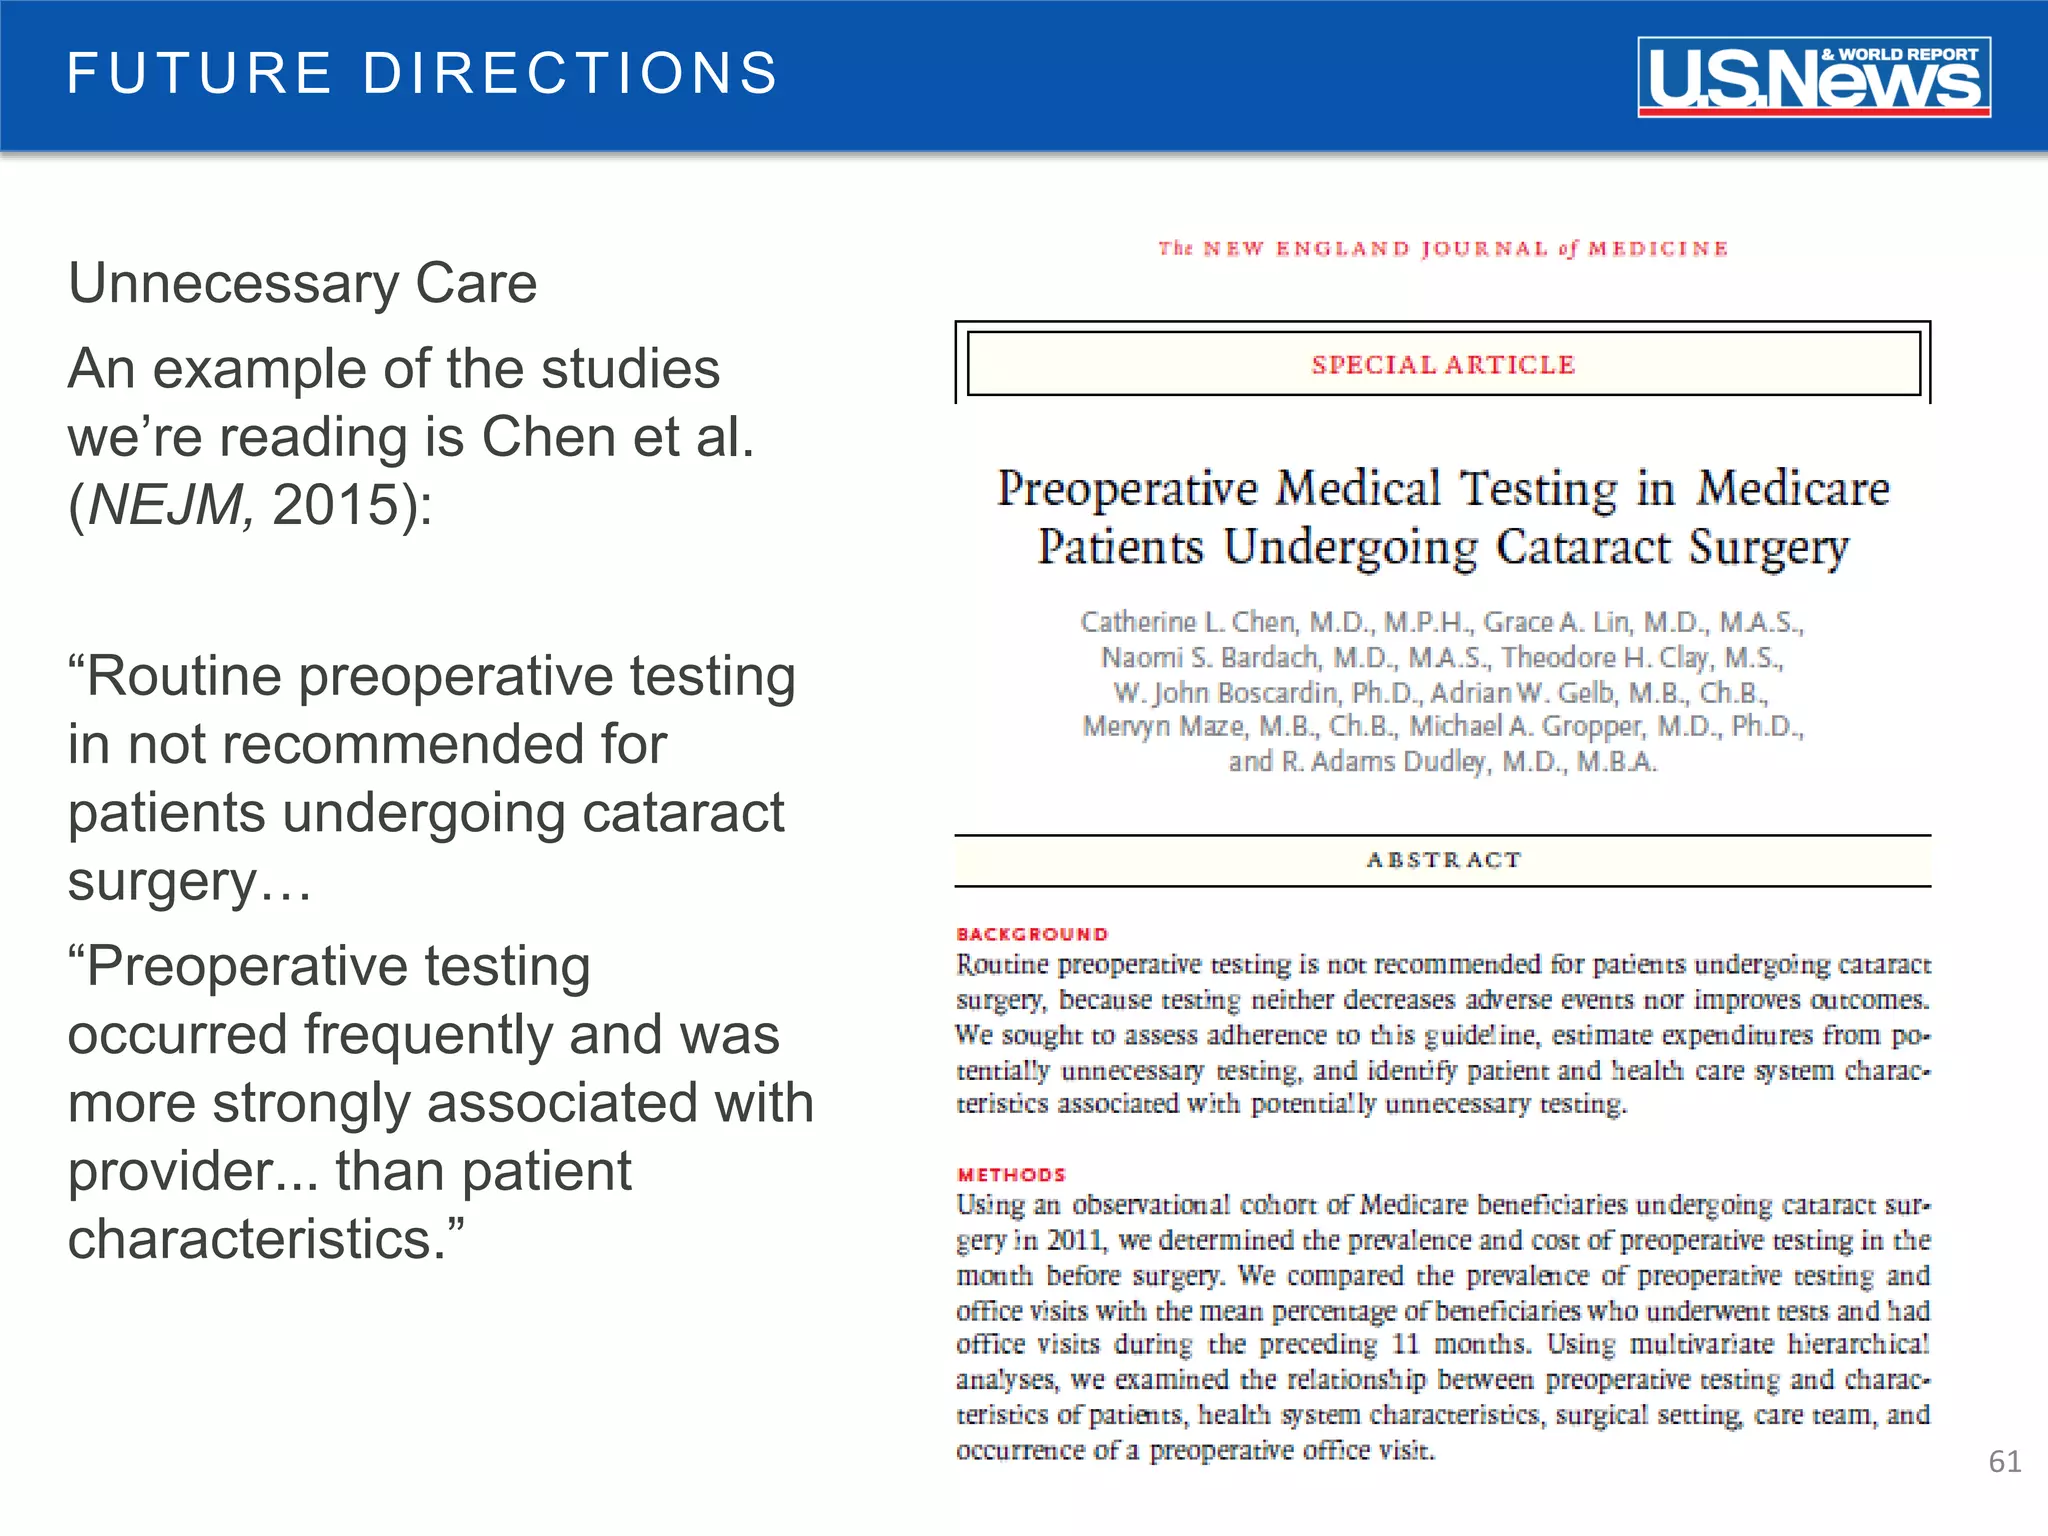
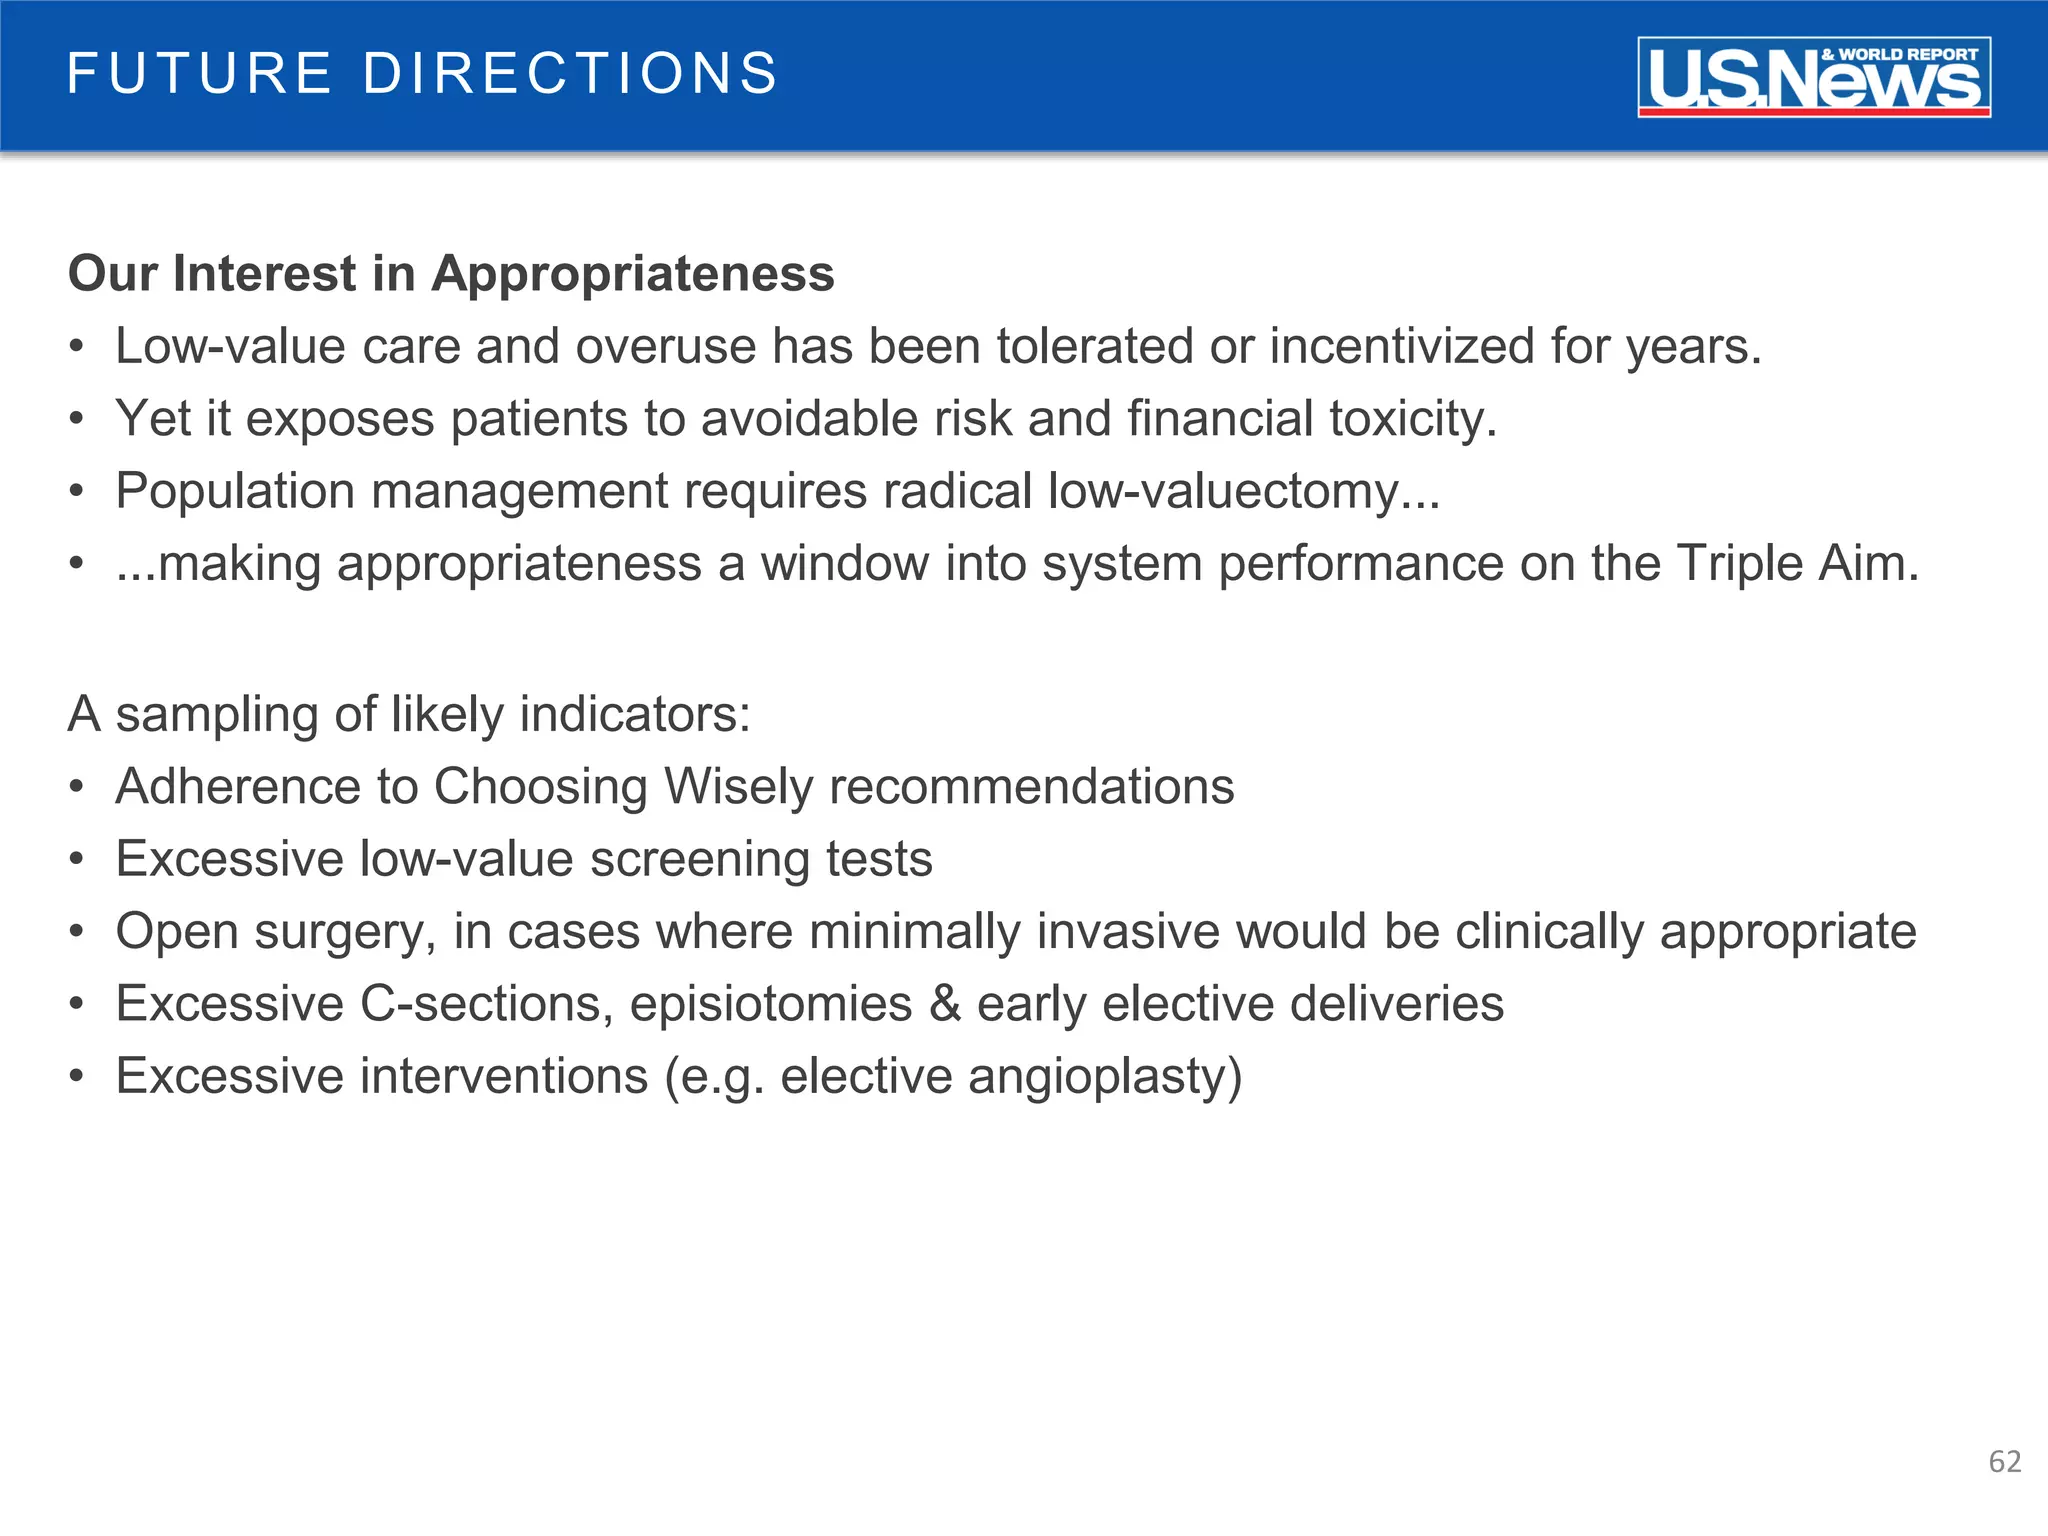
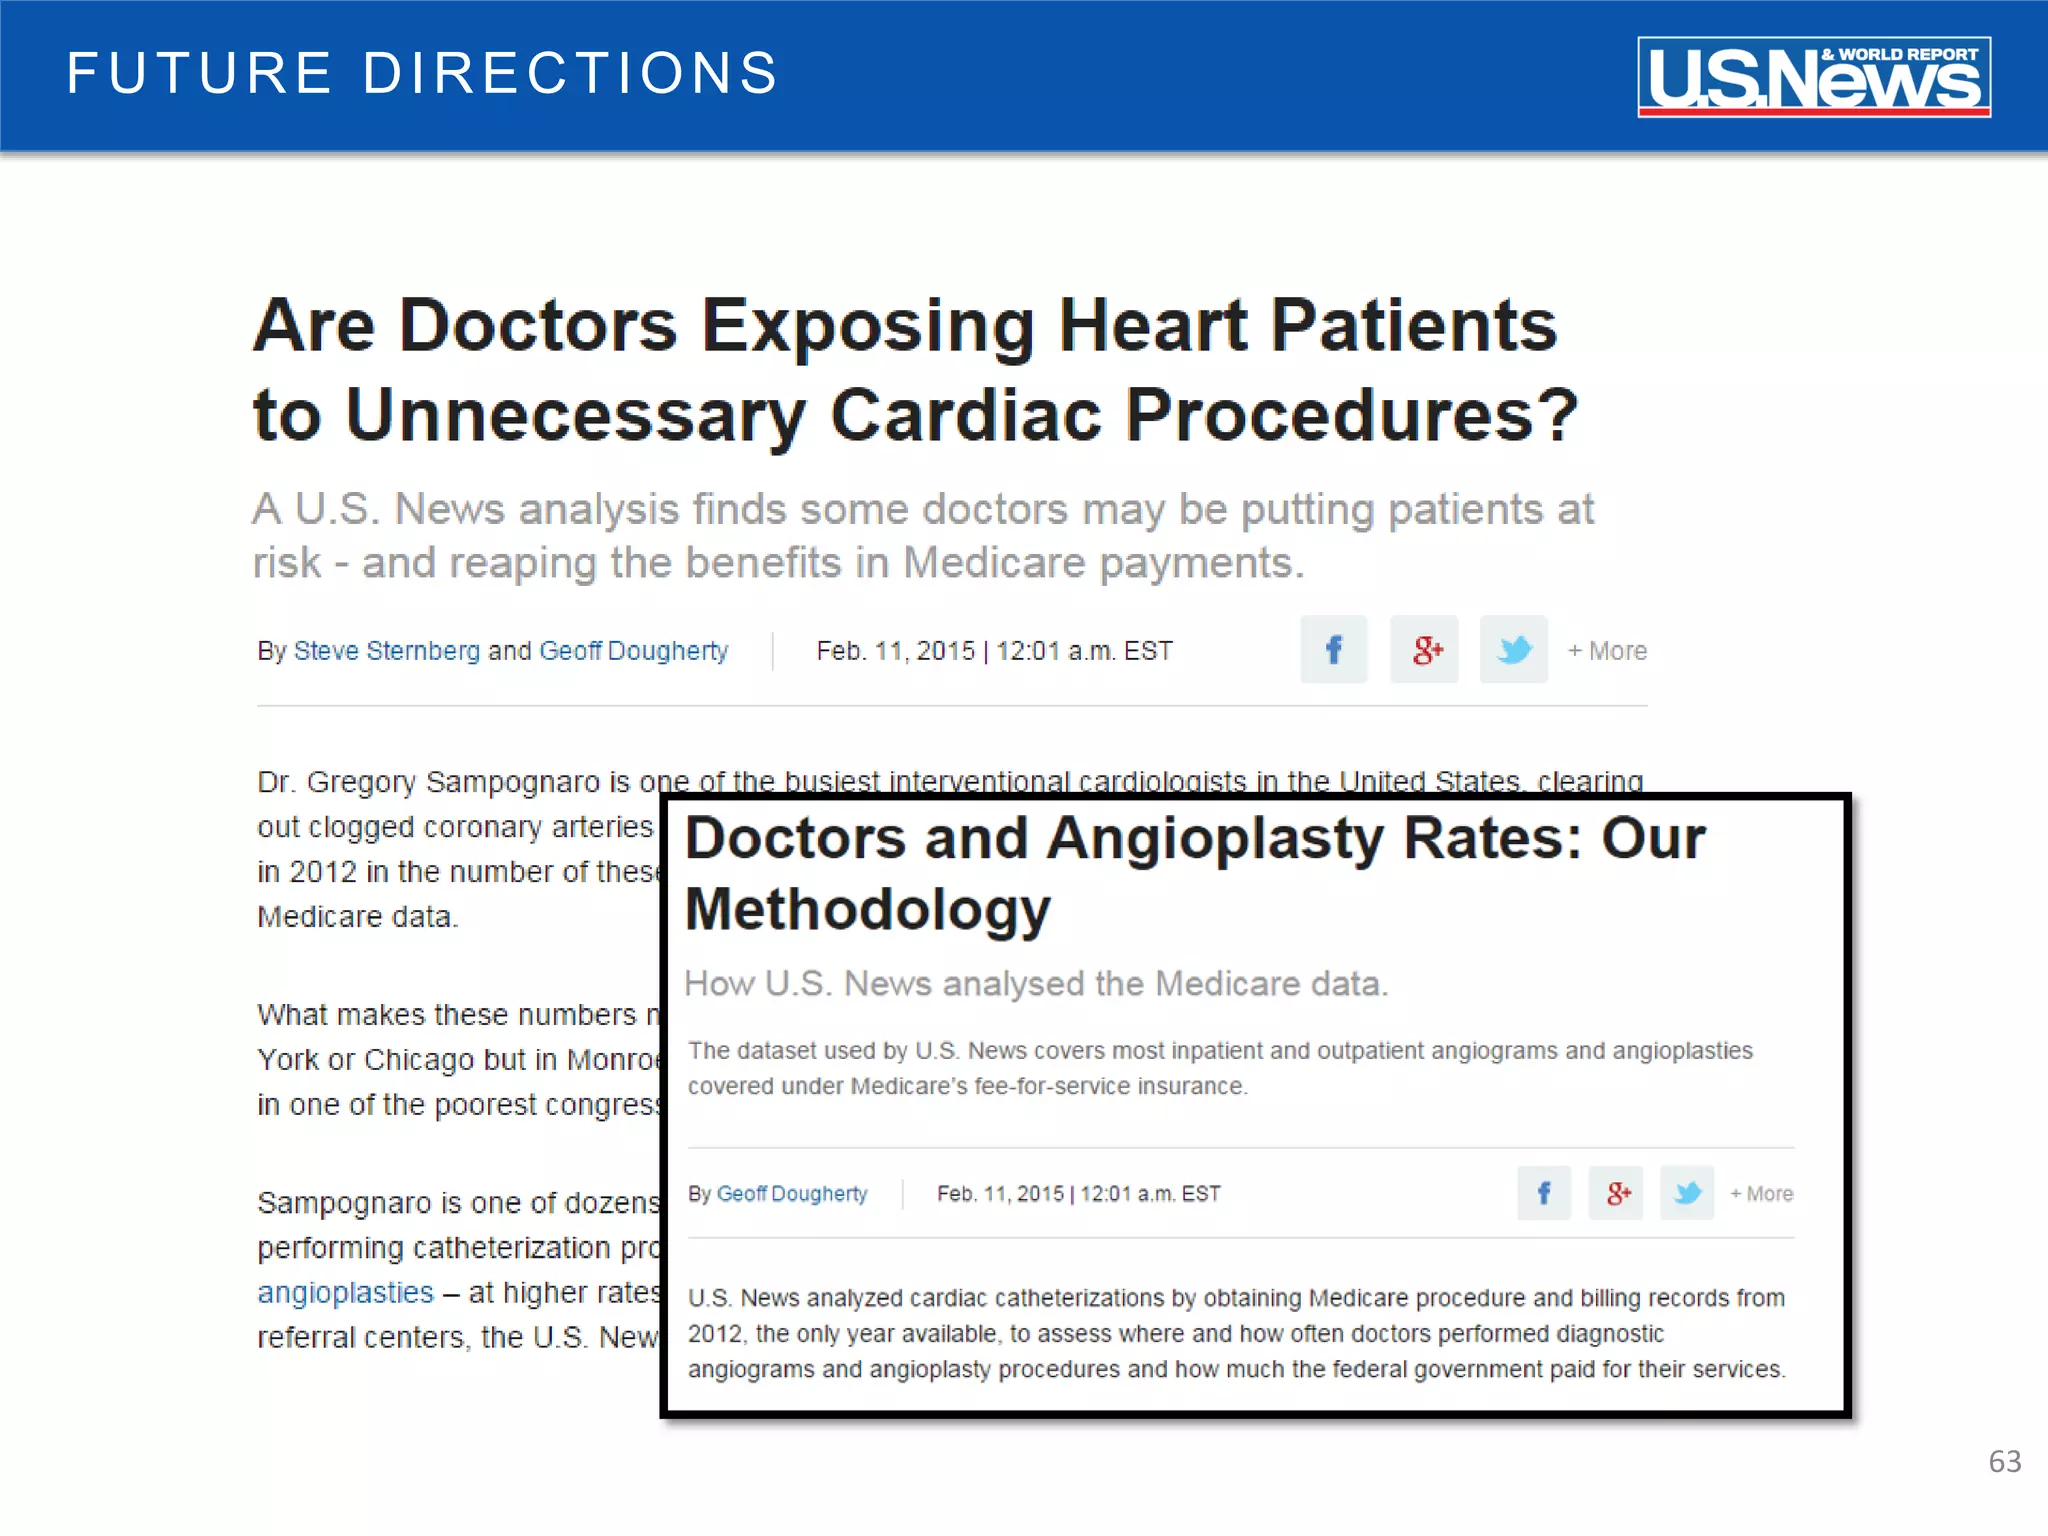


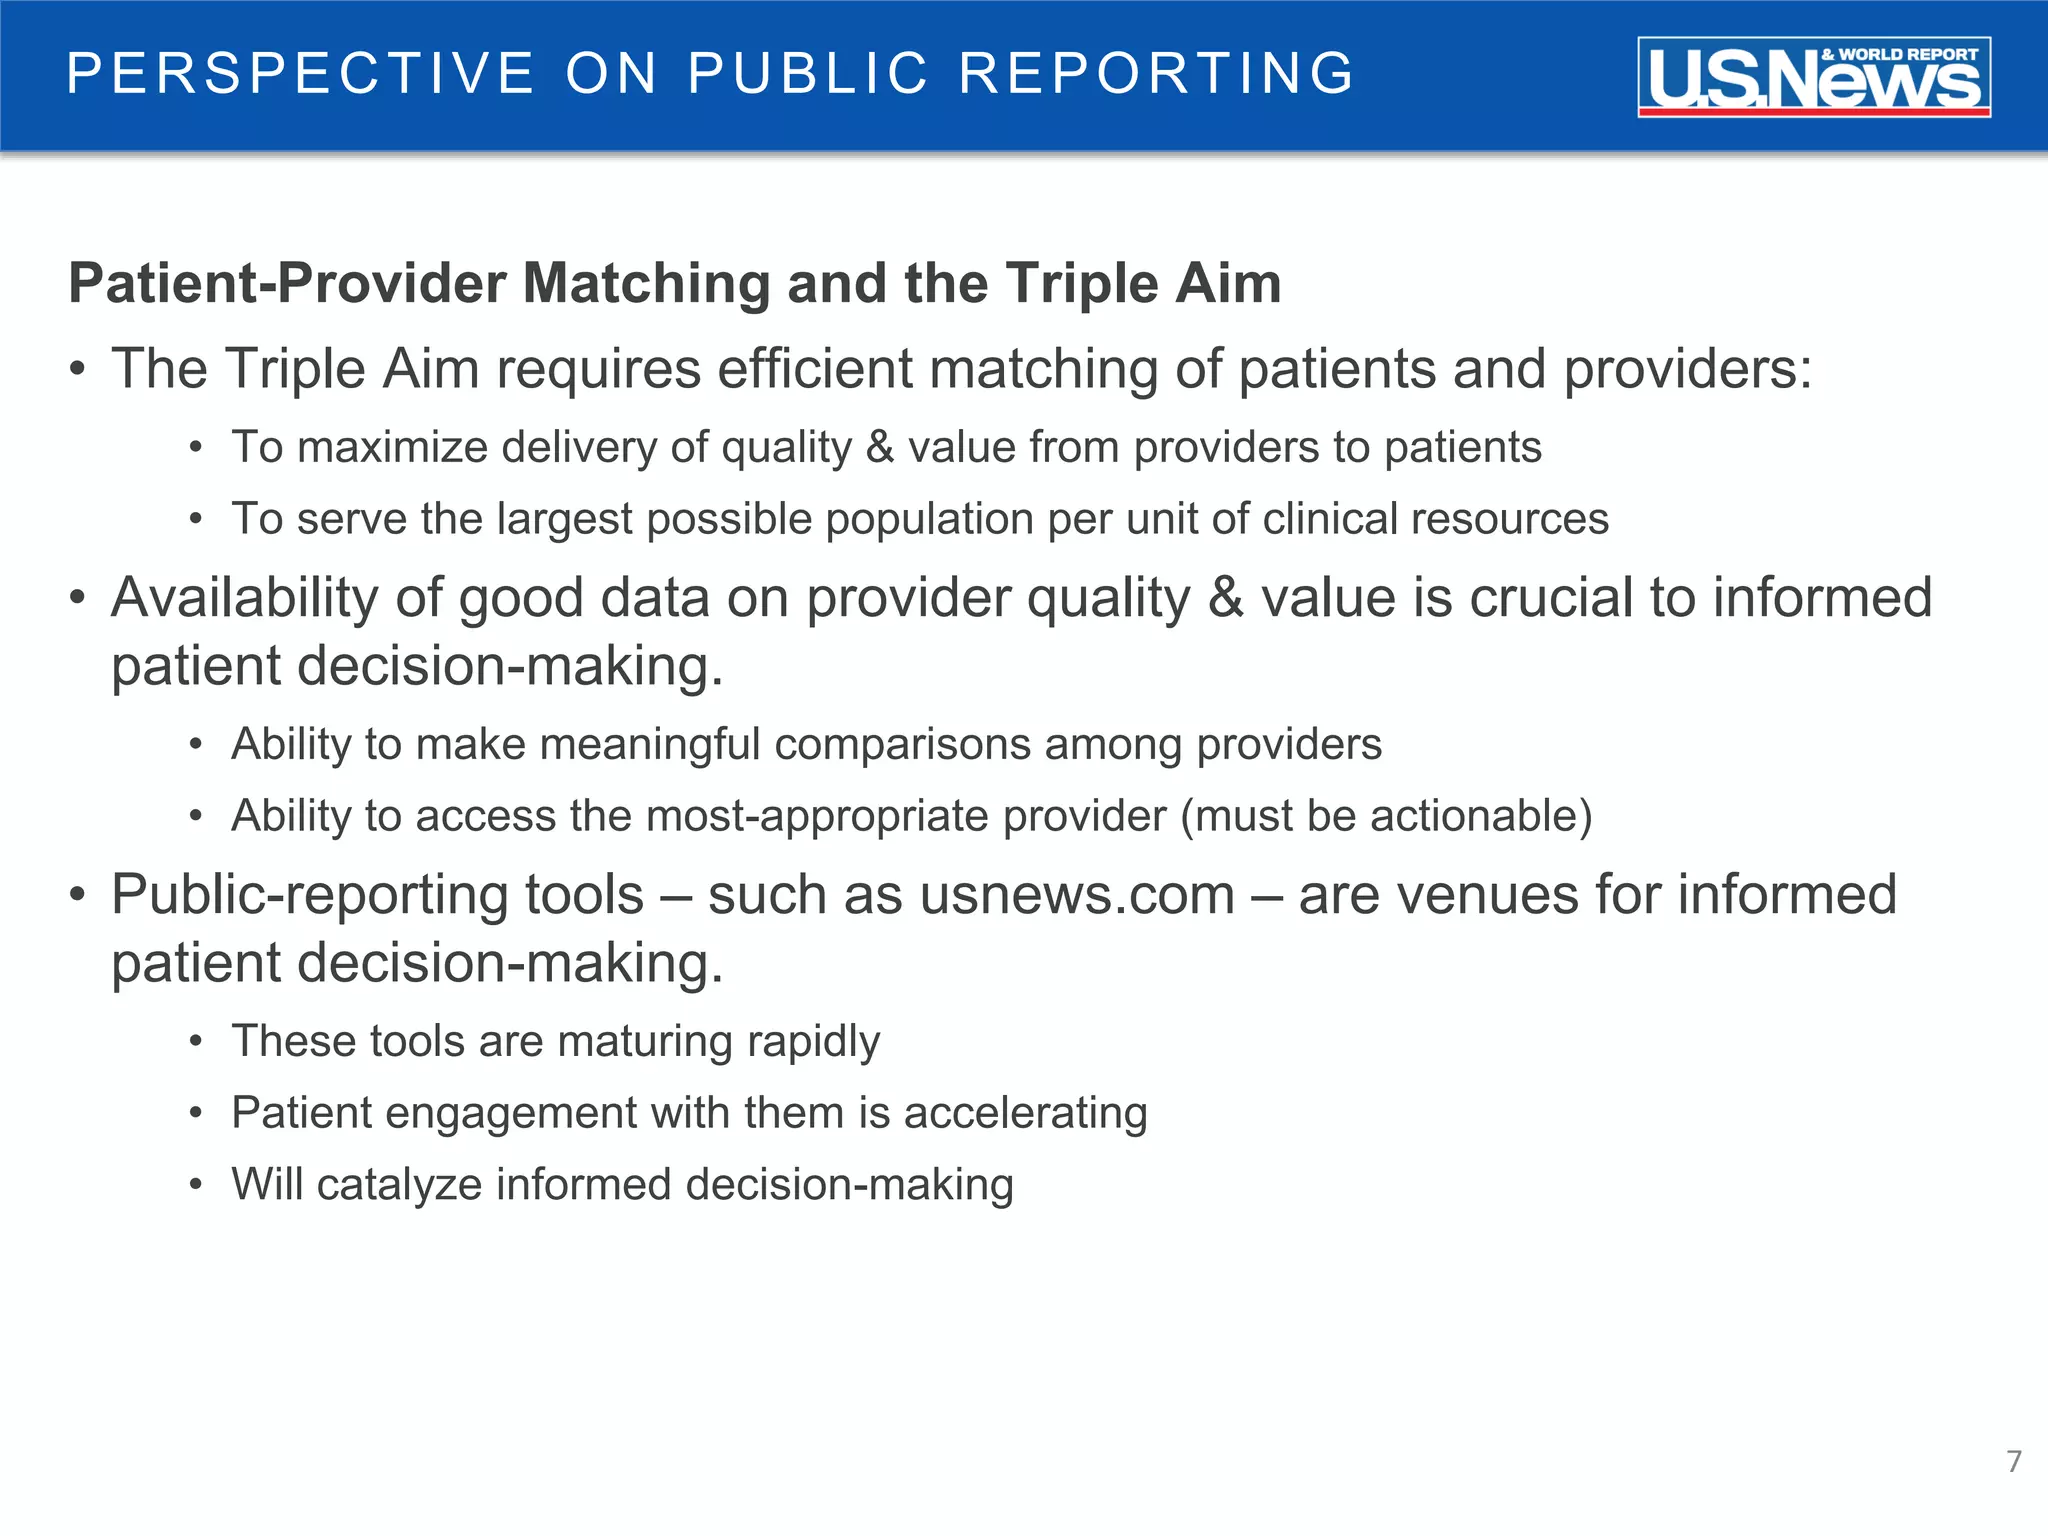
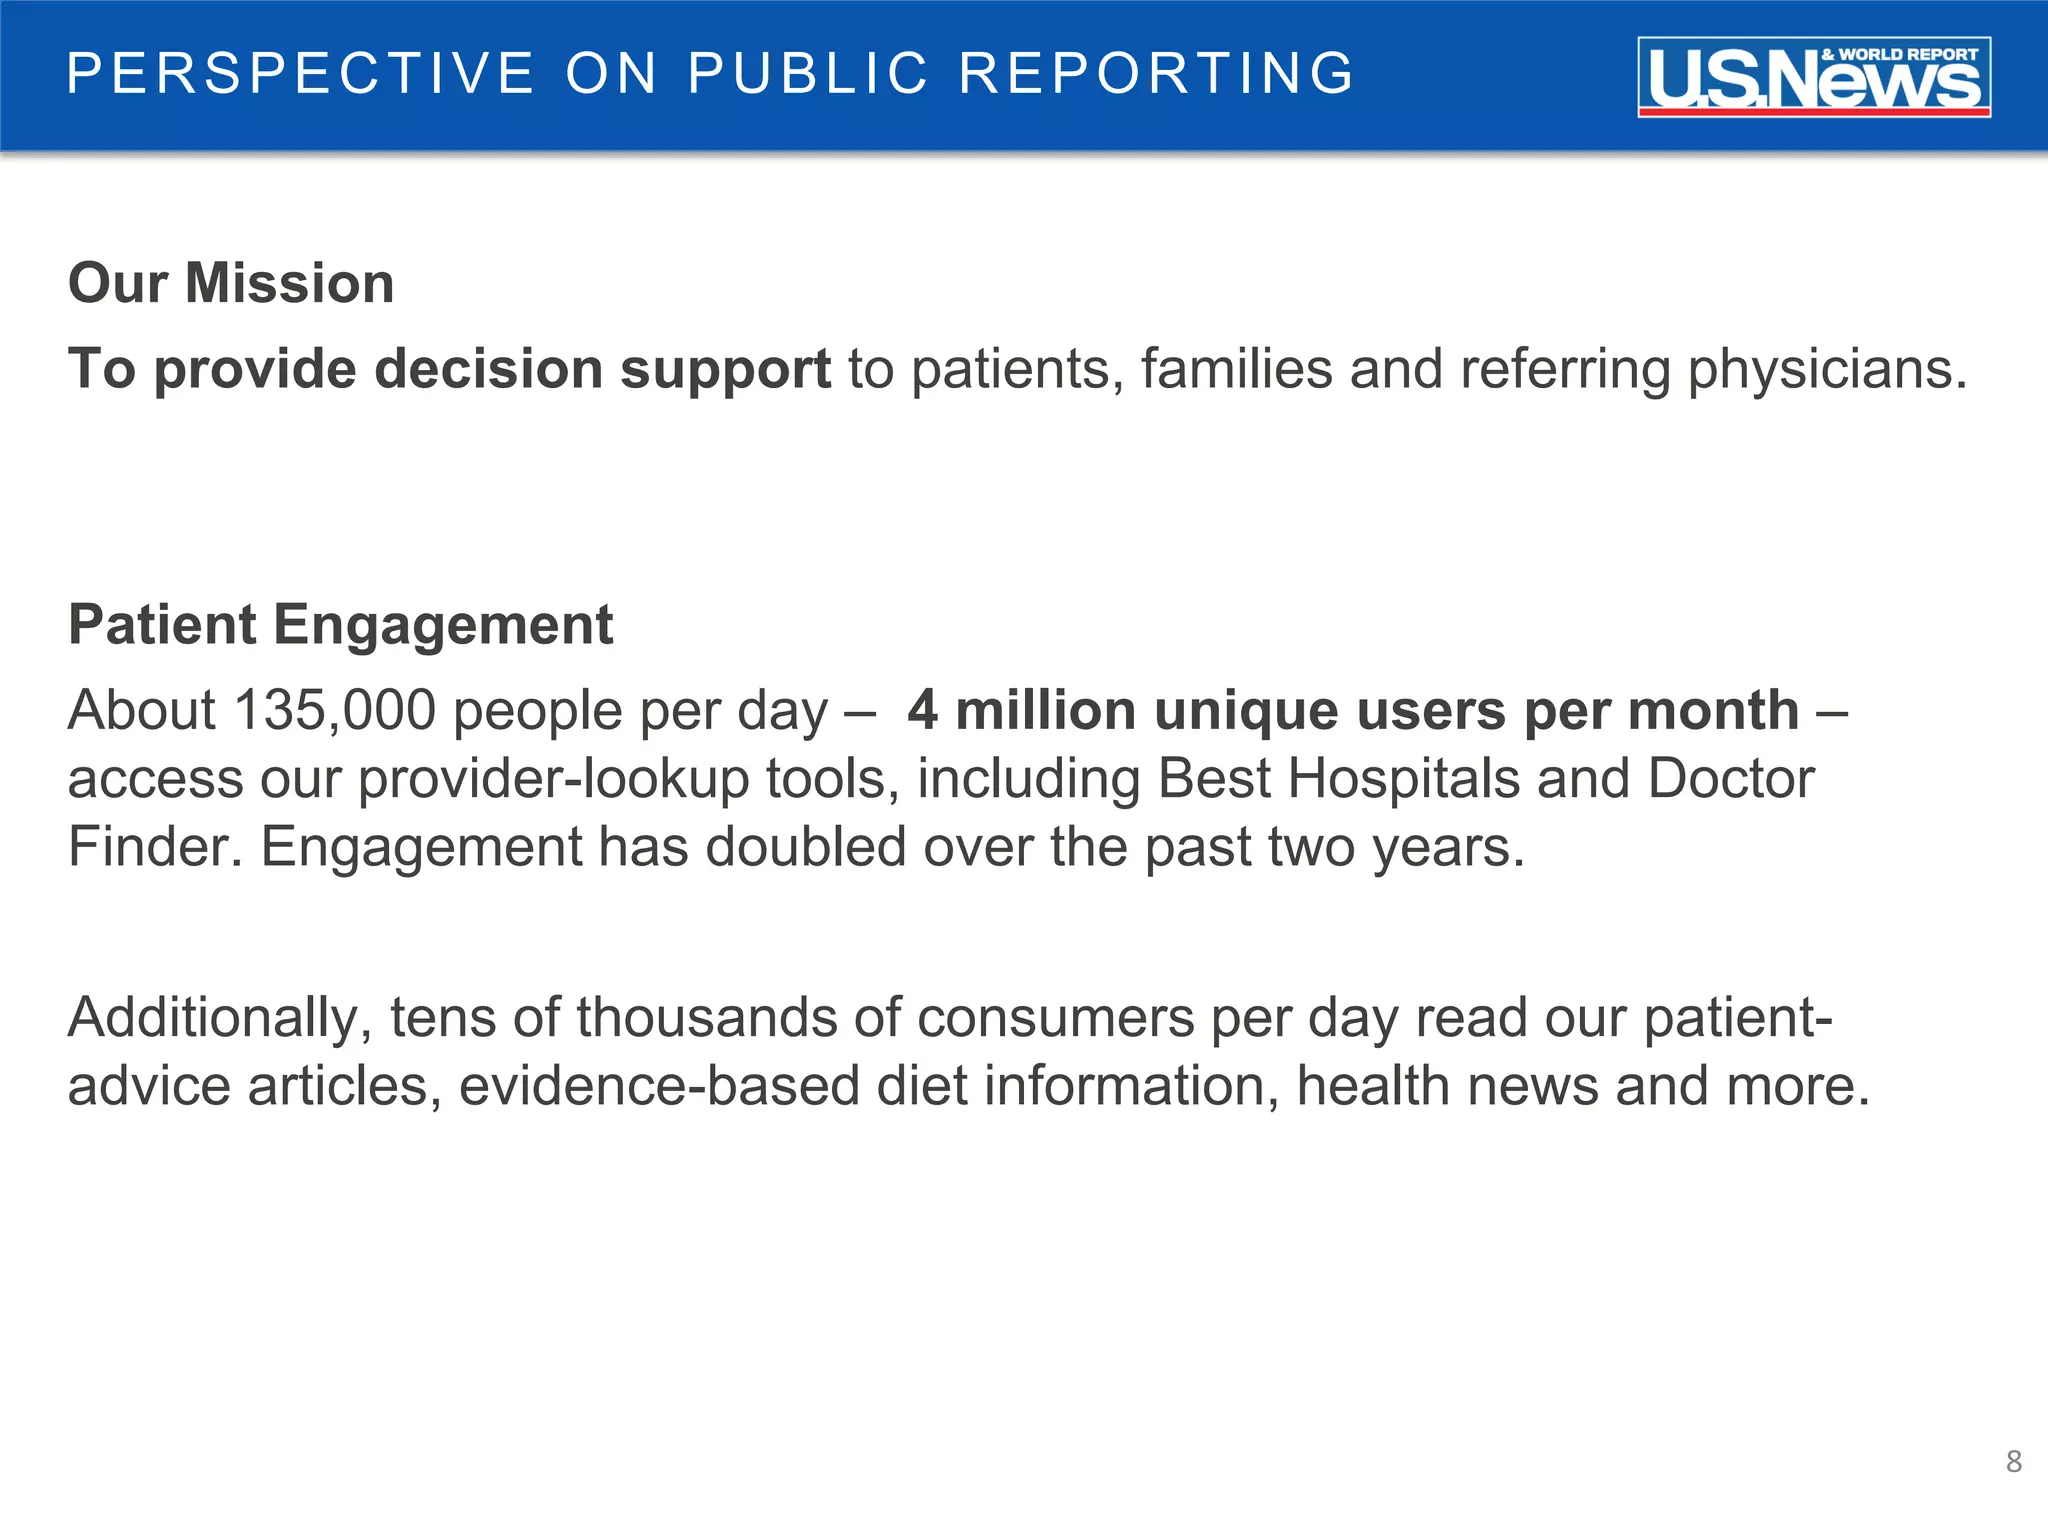
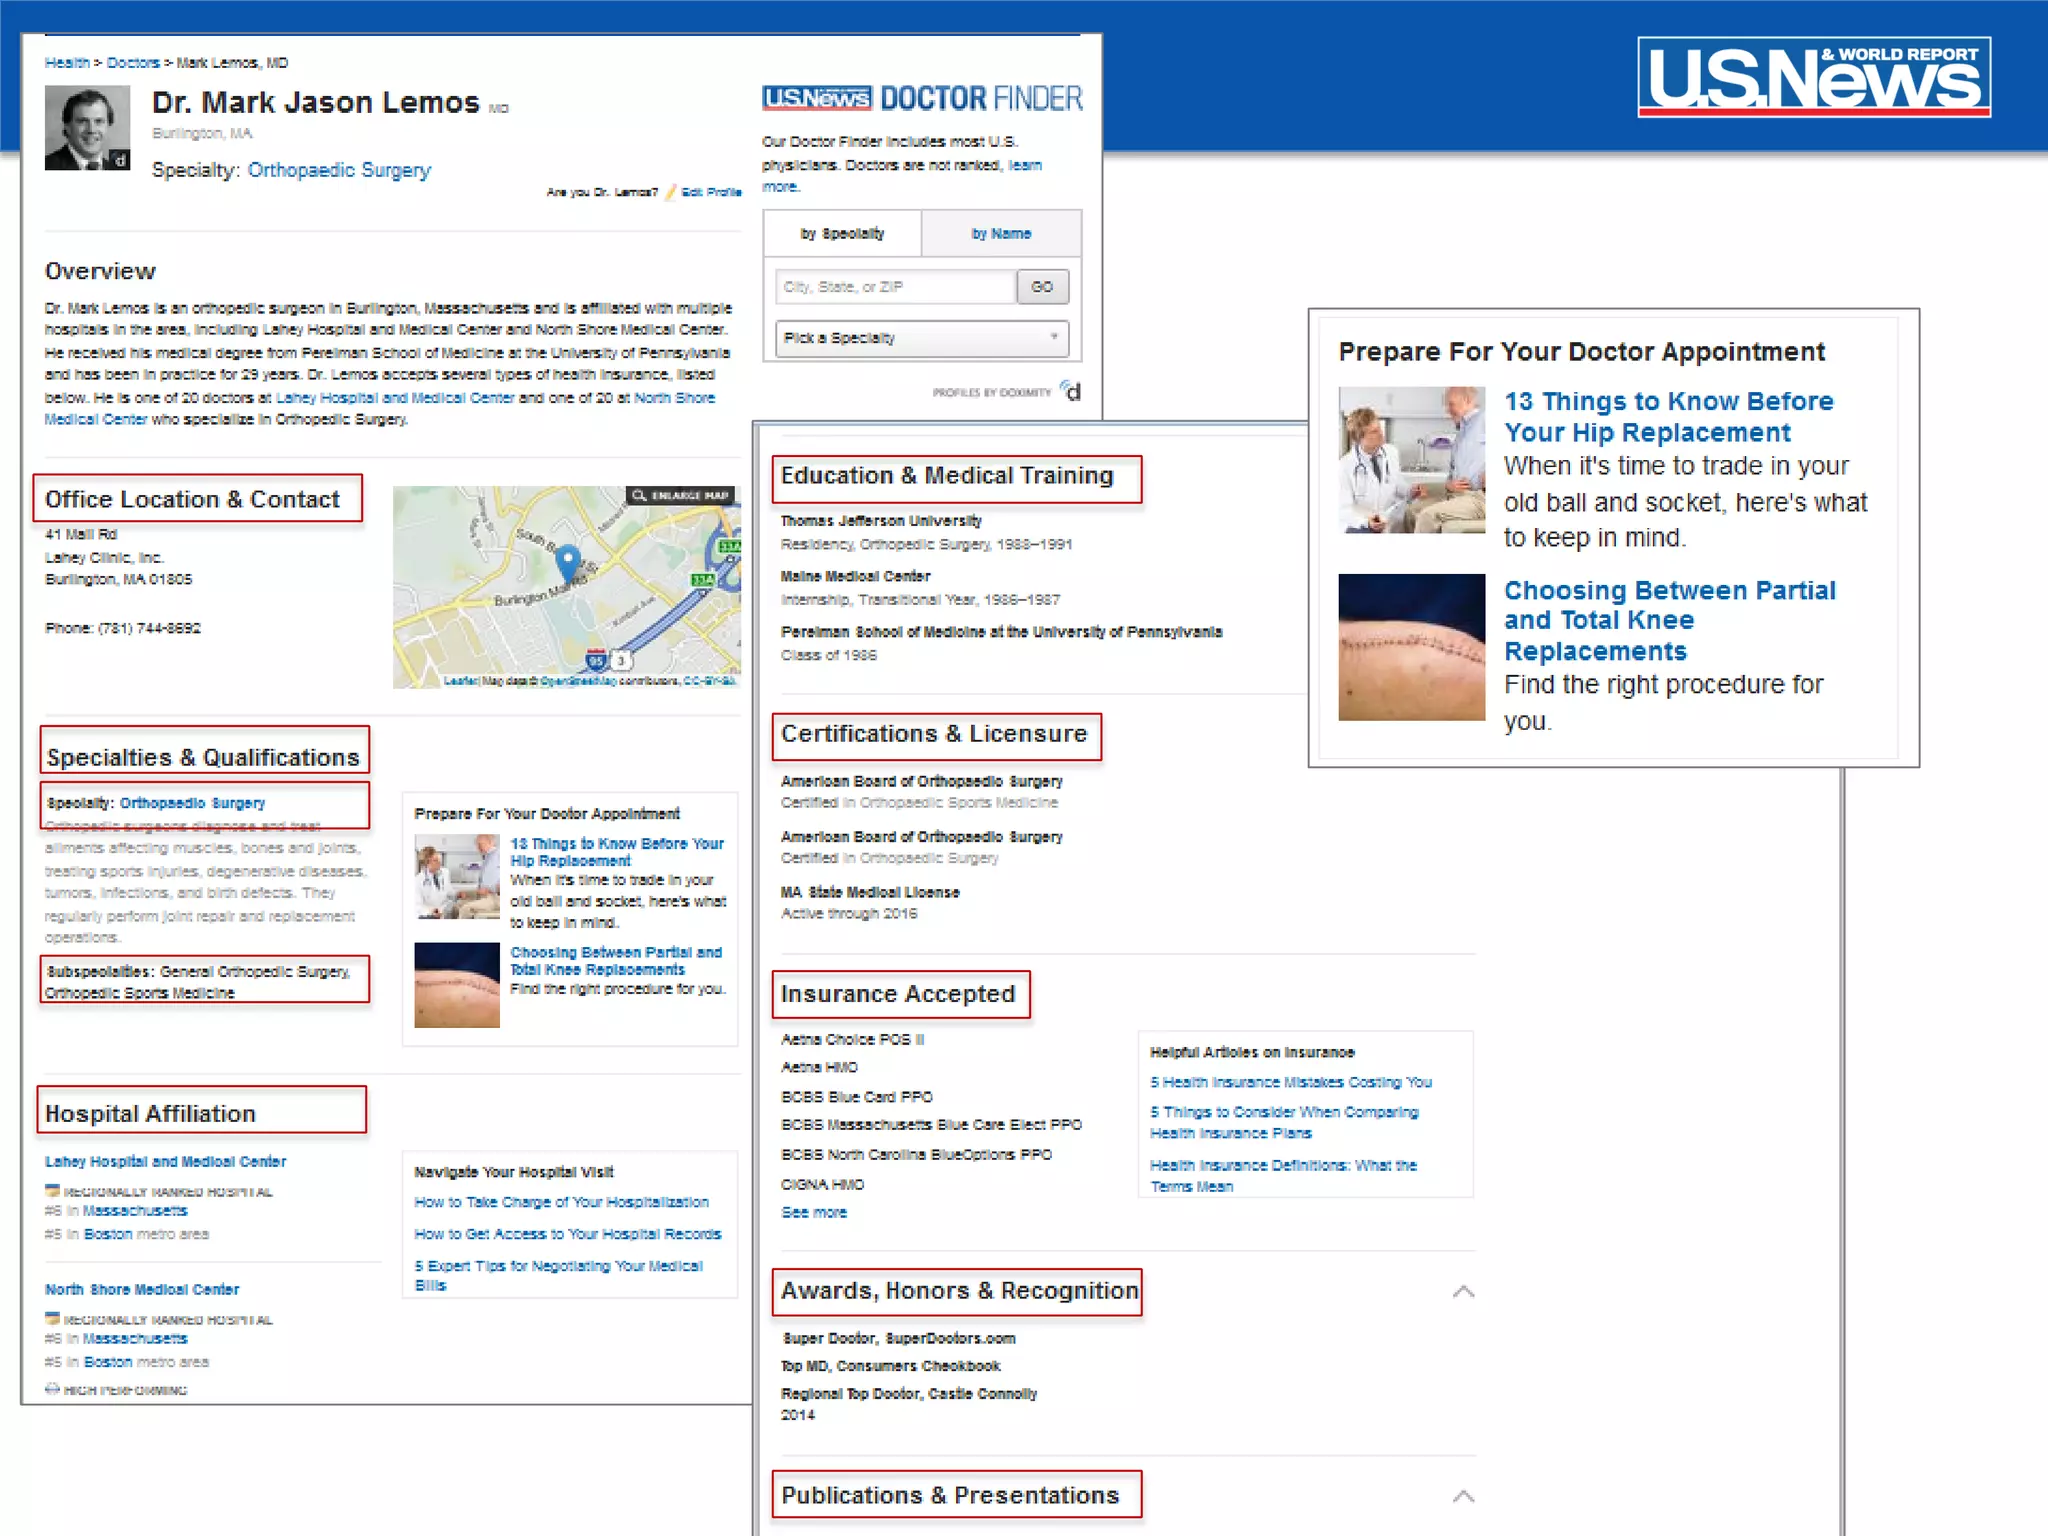
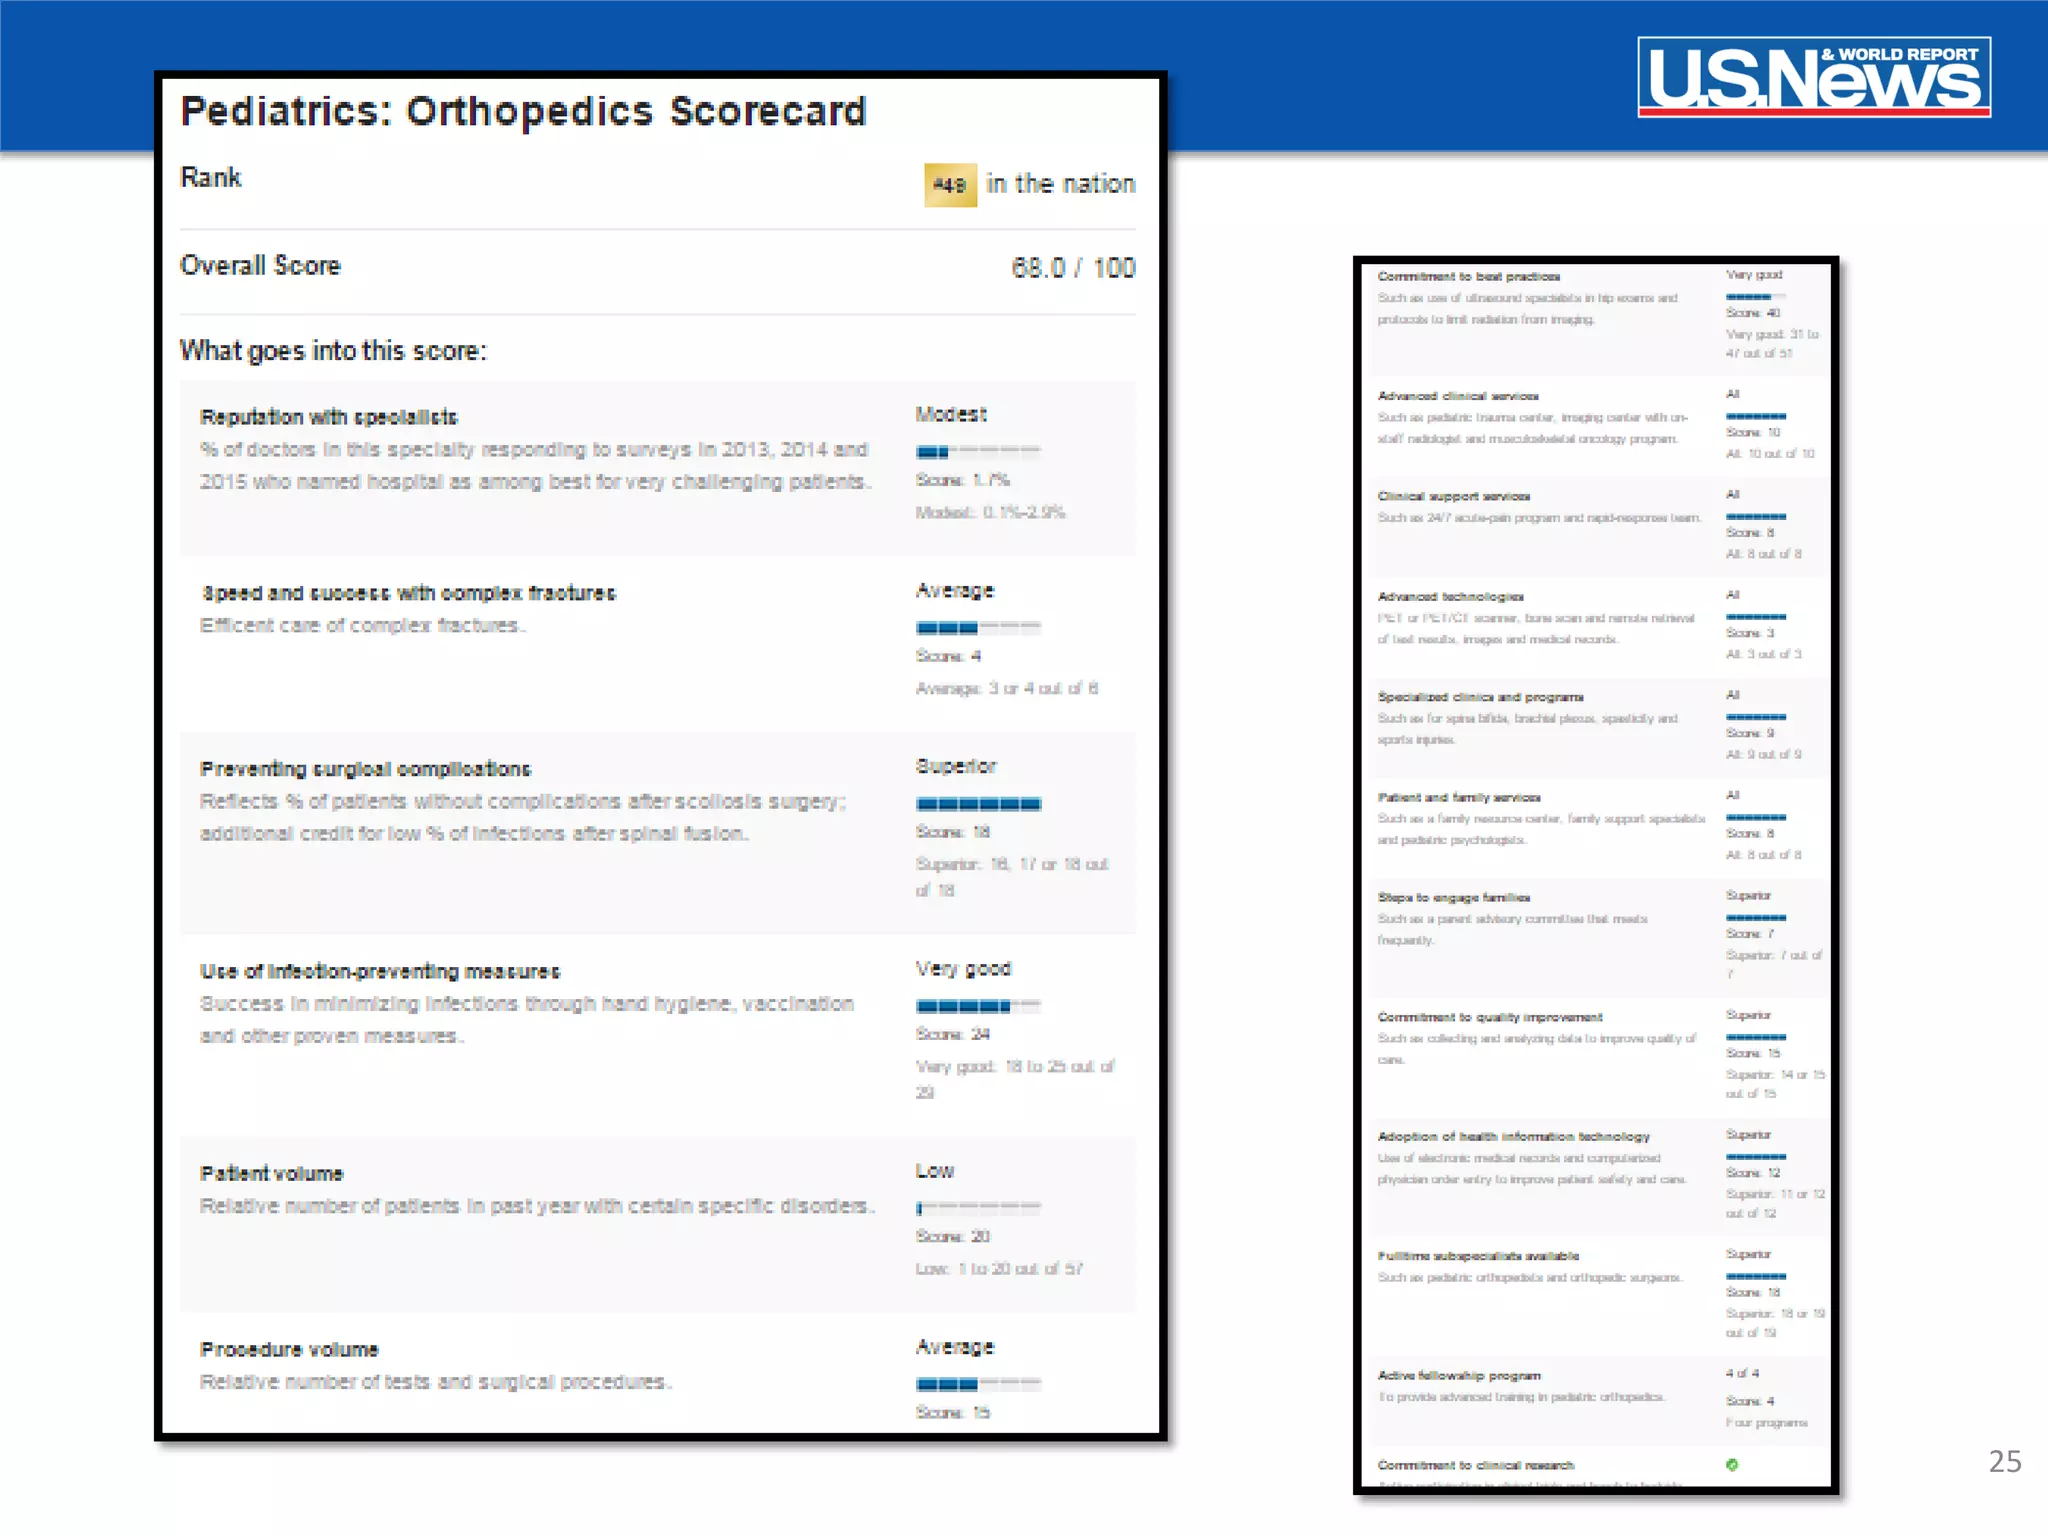
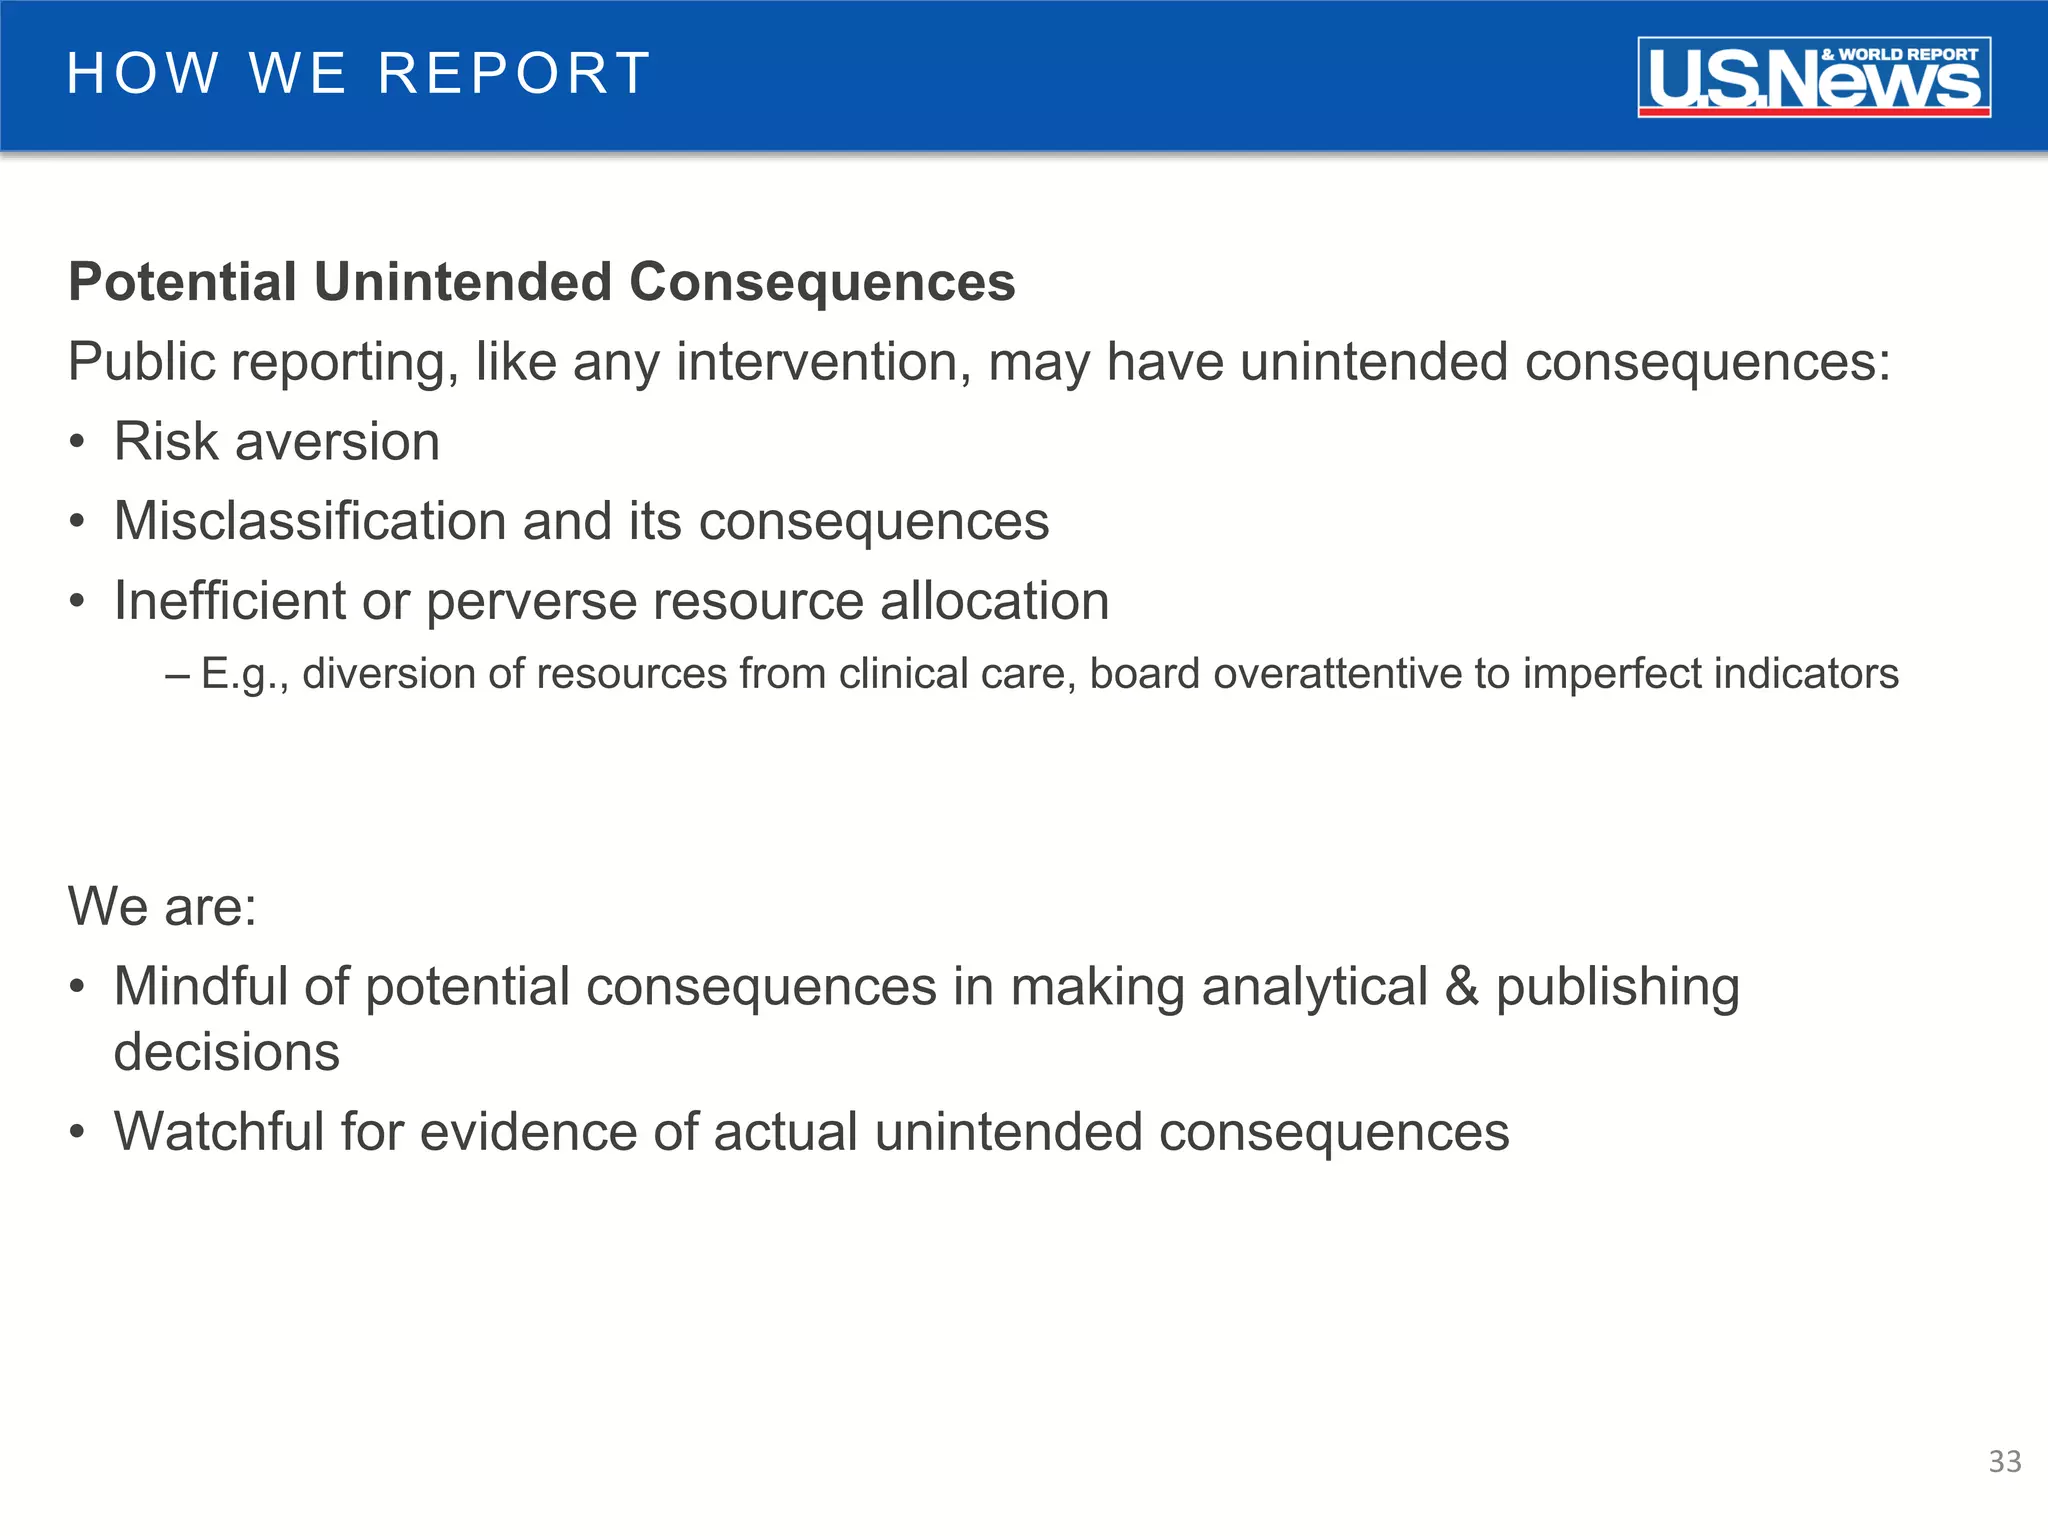
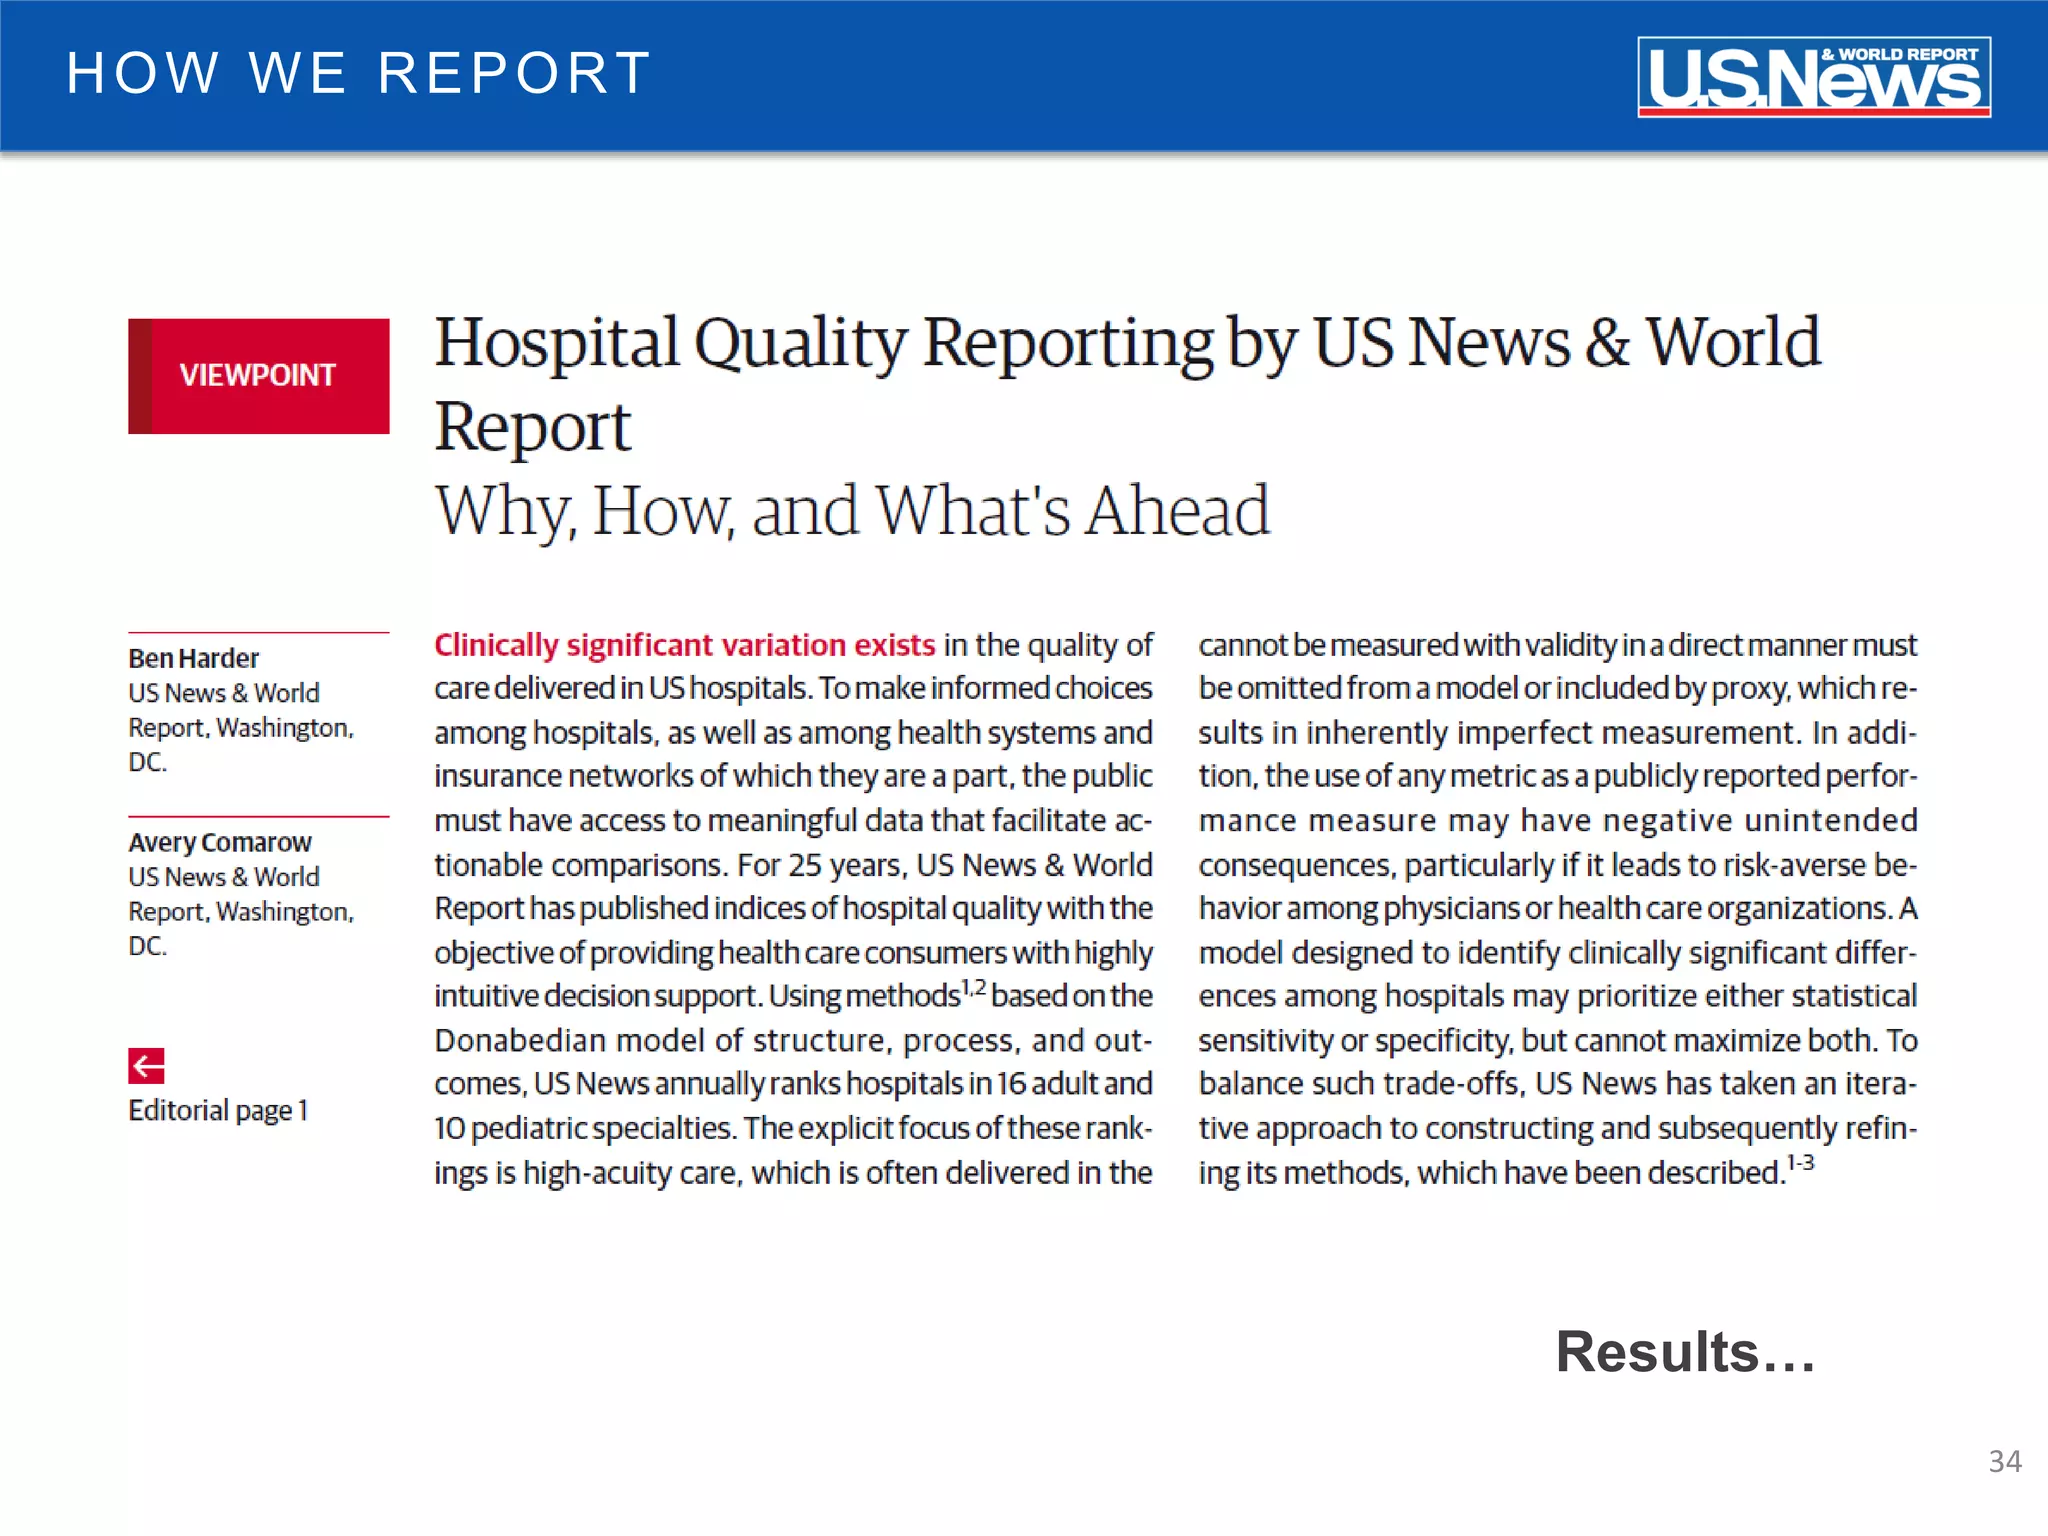
The document discusses the role of public reporting, particularly by U.S. News, in enhancing consumer decisions regarding healthcare providers and hospitals. It highlights the development of provider look-up tools, the importance of data-driven rankings, and implications for patient engagement and decision-making. Future directions include greater emphasis on physician ratings and managing low-value care to improve healthcare outcomes.


![Understanding Parkinson’s Disease: Causes, Symptoms, and Treatment [2025]](https://cdn.slidesharecdn.com/ss_thumbnails/understandingparkinson-251208102525-80ba3223-thumbnail.jpg?width=640&height=640&fit=bounds)


