
Recommended
Recommended
More Related Content
Similar to ProjectResearch Paper Rubric – 200 Points .docx
Similar to ProjectResearch Paper Rubric – 200 Points .docx (20)
More from wkyra78
More from wkyra78 (20)
Recently uploaded
Recently uploaded (20)
ProjectResearch Paper Rubric – 200 Points .docx
- 1. Project/Research Paper Rubric – 200 Points 2 CATEGORY High- 40 to 31 Points Middle- 30 to 21 Points Low- 20 to 0 Points Analysis and Economic Content Writing reflects a sophisticated understanding of economic theories, concepts and main ideas of course materials. Information presented is clearly related to economic concepts and economic perspectives and applications are clearly identified. Writing reflects a basic understanding of economic theories, concepts and main ideas of course materials. Information presented may be related to economic concepts but this relationship is not clearly identified and may not be apparent to the reader. Writing does not reflect an understanding of economic theories, concepts and main ideas of course materials. Scope and Compre-hension Major categories of the assignment* are all covered in some depth. Analysis, positive indications for business, potential for growth, and potential limitations of each category are perceived, identified, and acknowledged. Major categories of the assignment* are covered, most in some depth, but some categories lack depth. Observations may be reported but potential for business, potential for growth, or potential limitations are not analyzed. A full range of topics are not covered. Comments are not supported with good sources. Reported information is not analyzed and impact on business, potential growth, and potential limitations is not offered. Creativity
- 2. Paper demonstrates original or innovative thinking. Writer communicates insight and perceptiveness in making connections. Paper begins with strong objective facts and then progresses to interpretation, application, and analysis. Paper demonstrates some original or innovative thinking. Writer communicates some insight and perceptiveness in making connections. Paper tends more toward reporting without interpretation, application, or analysis. Paper does not demonstrate original or innovative thinking. Writer does not communicate insight and perceptiveness in making connections. Paper is almost entirely reporting without any interpretation, application, or analysis. Clarity of Writing and Writing Technique Writing is crisp, clear, and succinct. Writer incorporates an active voice when appropriate with supporting ideas and examples. No spelling, grammar, or punctuation errors are made. (Continues on page 2…) Writing is generally clear, unnecessary words are occasionally used. Paragraph or sentence structure is repetitive or too similar to the source without additional interpretation or perspective. Few spellings, grammar, or punctuation errors are made. (Continues on page 2…) Hard to understand, writing is convoluted. Information is too similar to the source without additional interpretation or perspective. Misspelled words, incorrect grammar, and improper punctuation. (Continues on page 2…)
- 3. Citations/References: Proper APA format, Use of Sources Citation followed APA format. Essential information was accurate and complete. ** 10 point deduction if more than 5% of the paper is direct quotes (not including tables, charts, quantitative data, personal interviews, in-text citations, and reference page. Citation for the article did not follow APA format, few errors were evident ** 10 point deduction if more than 5% of the paper is direct quotes (not including tables, charts, quantitative data, personal interviews, in-text citations, and reference page. Citation for the article did not follow APA format and was missing essential information. **10 point deduction if more than 5% of the paper is direct quotes (not including tables, charts, quantitative data, personal interviews, in-text citations, and reference page. * Major categories of Final Paper Assignment: · Infrastructure · Business Environment · Labor Markets · Social Environment · Any Other Important Considerations See Assignment Details for more information on what might be included in these categories. 1
- 4. * Barry Bluestone is a senior visiting scholar in the Regional and Community Outreach Department of the Federal Reserve Bank of Boston. He is the Russell B. and Andree B. Stearns Trustee Professor of Political Economy at Northeastern University and director of the university’s Kitty and Michael Dukakis Center for Urban and Regional Policy. **Views expressed here are those of the individual authors, and do not necessarily reflect official positions of the Federal Reserve Bank of Boston or the Federal Reserve System. The authors will be glad to receive comments on their articles. Community Development Issue Brief http://www.bostonfed.org/commdev S u m m a r y : In this Issue Brief I introduce a measure that estimates the factors that influence firm location choice in U.S. cities. I then investigate which of these factors may best explain the variance in employment trends across a select set of Massachusetts municipalities: the small and mid-sized post- industrial Massachusetts cities that the Federal Reserve Bank labels “working cities.” The analysis suggests that the highest correlates to economic growth are the availability of sites for development, economic development marketing, and the timeliness of municipal approvals for development projects. These results provide some indication of the extent to which these cities and
- 5. others might influence their own economic futures. Introduction For most cities and towns, economic prosperity rests on the ability to retain and attract business investment and the jobs and the tax revenue that this investment generates. Municipalities with robust commercial and industrial activity generally have higher rates of employment, less joblessness, higher household incomes, and the wherewithal to support a rich array of public services. Those that have little business enterprise or have experienced “deindustrialization” often face decline, distress, and increased poverty (Bluestone and Harrison, 1982; Bradbury, Downs, and Small, 1982) Location specialists tell us that many factors affect where firms ultimately locate, expand, or contract their operations (Kimelberg and Williams, 2013). W ha t Makes W orking C ities W ork? Key F actors in U rban E conomic G rowth by Barry
- 6. Bluestone* Community Development Issue Brief 3, 2014** May 2014 Community Development Issue Brief http://www.bostonfed.org/commdev 2 Companies dependent on natural resources such as wood products or oil, or for that matter those requiring extraordinarily high levels of human capital in the life sciences, need to locate their operations where those resources are in abundance (Bluestone and Clayton-Matthews, 2013). Business owners and managers in highly competitive industries often seek out locations where they can reduce the cost of production by taking advantage of low labor cost or low- cost land. Several studies have found that city growth tends to be higher in regions where there are highly educated workers, while a strong manufacturing
- 7. base appears to be correlated with economic growth prior to the 1970s, but with city distress and contraction in later decades (Bluestone and Harrison, 1982; Hill and Brennan, 2005; Kodrzycki and Muñoz, 2013; and Simon, 1998). One explanation for the importance of educational attainment to economic growth is that well-educated workers are better equipped to develop new industries to replace those that become obsolete (Glaeser and Saiz, 2004). For older industrial cities, these findings are of little comfort. While improving the educational attainment of their residents no doubt could lead to economic resurgence, such a policy remedy is not easy to implement and takes years, if not decades, to be successful. Moreover, any potential benefits are lost if the newly educated leave for better job opportunities elsewhere. Fortunately, research suggests there are other factors that are under the control of municipal leaders that also correlate with economic
- 8. resurgence. These include an adequate transportation infrastructure, a trained labor force, a range of site amenities, including restaurants and day care centers, a low crime rate, and a favorable regulatory and tax climate (Arsen, 1997; Bartik, 1988; Brunnermeier and Levinson, 2004; Buss, 2001; Deller, Lledo, and Marcouiller, 2008; Forkenbrock and Foster, 1996; Gkritza, Sinha, Labi, & Mannering, 2007; Granger and Blomquist, 1999; Kimelberg, 2013). Case study research by Kodrzycki and Muñoz (2013) revealed that “leadership on the part of key institutions or individuals, collaboration among the various constituencies with a stake in economic development, long-term planning and periodic reevaluation of the plan, and development of new industries and city identities” help older Community Development Issue Brief http://www.bostonfed.org/commdev
- 9. 3 industrial cities attract new industry and expand employment (p. 16). These findings are consistent with earlier statistical research that found such factors made it more likely that cities would prosper (Wolman, Hill, Blumenthal, and Furdell, 2008). Still more recent research by Mallach (2012, 2013), undertaken in smaller industrial cities in Pennsylvania, New Jersey, and Delaware, provides corroborating evidence that municipal leadership, vision, and a sustained economic development strategy are conducive to higher rates of economic growth. Based on these research findings, the Federal Reserve Bank of Boston initiated the Working Cities Challenge Competition. As stated on its website, the Working Cities Challenge aims “to advance collaborative leadership in
- 10. Massachusetts smaller cities and to support ambitious work to improve the lives of low-income people in those cities.”1 This issue brief investigates which factors among many best explain the variance in employment trends across a select set of Massachusetts municipalities: the small and mid-sized post- industrial Massachusetts cities that the Federal Reserve Bank labels “working cities.” We use data from the Massachusetts Department of Labor to track the change in employment between 2001 and 2013 (through the second quarter of the year) in the 20 cities across the commonwealth so identified. We then use data on 19 of these communities from the Economic Development Self-Assessment Tool (EDAT) developed by the Dukakis Center at Northeastern University to investigate which business location factors are most highly correlated with the changes in employment level in these cities. The results of this analysis provide a first approximation of the
- 11. factors that appear to be critical to local economic growth for cities that have, in the past, experienced a loss in economic vitality. Most importantly, they provide some indication of the extent to which cities can influence their own economic destiny. The findings in this study may help cities and towns better target their economic development efforts. 1 Working Cities Challenge, “Our Goal Advancing and Supporting,” Community Development Issue Brief http://www.bostonfed.org/commdev 4 M a s s a c h u s e t t s W o r k i n g C i t i e s The Regional and Community Outreach Department of the Federal Reserve Bank of Boston identified 20 cities in Massachusetts
- 12. that had populations greater than 35,000 (excluding Boston) but whose median family income was below the median for all cities in the state with populations of 35,000 to 250,000, and a poverty rate above the city median.2 Most of these municipalities, which are found throughout the state, have an older industrial base, and the vast majority are gateway centers for new immigrants. On average, their residents have less formal education than residents in other cities and towns in the commonwealth. Figure 1 shows the location of these working cities. Figure 1. S o u r c e : F e d e r a l R e s e r v e B a n k o f B o s t o n . 2 See Working Cities Challenge, “The Working Cities,” http://www.bostonfed.org/WorkingCities/cities/index.htm.
- 13. Community Development Issue Brief http://www.bostonfed.org/commdev 5 Most of these cities have suffered periods of disinvestment since World War II. Yet as Figure 2 reveals, between 2001 and the second quarter of 2013, they have had vastly different experiences in terms of employment growth. 3 Figure 2 S o u r c e : M a s s a c h u s e t t s D e p a r t m e n t o f L a b o r – E S - 2 0 2 D a t a Given that Massachusetts as a whole was able to increase its employment base by less than 1 percent during this period, which includes the 2001–2002 recession and the Great Recession beginning in late 2007, it is not surprising that many municipalities, including 14 of the working cities, hemorrhaged jobs. Yet six of the working cities experienced employment growth, and all
- 14. of these exceeded the rate of job growth in the state. Chelsea led all the working cities, with nearly an 11 percent growth in the number of jobs. Haverhill, Lawrence, Brockton, 3 The data (ES-202), from the Massachusetts Department of Labor and Workforce Development, are derived from reports filed by all Massachusetts employers subject to unemployment compensation laws, both state and federal. Industry employment and payroll information is produced by the Massachusetts Department of Labor from these ES-202 submissions on a quarterly and annual basis for the state as a whole, labor market areas, workforce investment areas, cities and towns, and counties. Industry data are arrayed by NAICS codes. Community Development Issue Brief http://www.bostonfed.org/commdev 6 Somerville, and New Bedford also had positive employment growth. At the other end of the employment spectrum, Fitchburg, Fall River, and Malden all suffered
- 15. at least a 10 percent loss in their job base over the period examined. What can explain such wide variance across these working cities? The Economic Development Self - A s s e s s m e n t T o o l ( E D S A T ) In 2005, the Dukakis Center research staff began developing a software tool that would make it possible for leaders of local government to assess more accurately their communities’ capacity to attract business investment and create job opportunity. The initial step in this process was to convene several focus groups, each consisting of about a dozen location and site specialists in Massachusetts who were members of NAIOP, a trade association of commercial and industrial developers and professionals, many of whom help firms find sites for new business establishments.4 These focus groups helped the Dukakis Center develop a detailed survey that asked members of the focus groups which
- 16. business locations they considered to be “deal breakers” and which ones they considered “deal makers.” The survey was distributed nationally to members of both NAIOP and CoreNET, a national association that includes real estate professionals who work for large companies.5 More than 230 members of NAIOP and CoreNET completed the survey, ranking 39 different factors in the business-location decision process using a four-point Likert scale (1 = unimportant; 4 = very important).6 The survey items covered a broad range of topics, including rental rates, transportation access, infrastructure, labor market needs, municipal processes (e.g., zoning appeals and building code inspection practices), local tax rates, local business incentives, 4 NAIOP’s original name was National Association of Industrial and Office Parks. With 15,000 members nationwide, it is the leading organization for developers and owners of, and investors in, office, industrial, retail, and mixed-use real estate. 5 CoreNet Global considers itself the world’s leading
- 17. association for corporate real estate and workplace professionals, service providers, and economic developers. CoreNET has over 7,000 members, including the real estate professionals who work for 70 percent of the Fortune 100 and nearly half of the Forbes Global 2000. 6 The survey was carried out for the Dukakis Center by Shelley M. Kimelberg. She and Elizabeth Williams detail the methodology for the survey in Kimelberg and Williams (2013). Community Development Issue Brief http://www.bostonfed.org/commdev 7 economic development marketing, crime rates, and school quality. The respondents ranked the following factors (Table 1) as most important in their assessment of a municipality’s business environment: Table 1: Factors l o c a t i o n s p e c i a l i s t l i s t a s m o s t i m p o r t a n t i n a m u n i c i p a l i t y ’ s b u s i n e s s e n v i r o n m e n t Factor Mean Likert Score
- 18. On-site parking for employees 3.52 Building rental/lease rates 3.48 Availability of appropriate labor 3.37 Timeliness of approvals/appeals 3.33 Quality/capacity of infrastructure 3.22 Traffic congestion 3.21 State tax/financial incentives 3.17 Predictability/clarity in permitting 3.15 Competitive labor costs 3.15 Access to major highways 3.15 Property tax rates 3.13 Crime rates 3.13 Fast track permitting 3.07 Physical attractiveness of area 3.01 In Table 2, I list following factors which were ranked as less important in the location decisions: Table 2: Factors location specialists ranked a s l e a s t i m p o r t a n t i n t h e l o c a t i o n d e c i s i o n Factor Mean Likert Score Municipal minimum wage law 1.95 Access to railroads 2.16 Informative municipal website 2.18 Existence of strong trade unions 2.24
- 19. Sports/cultural amenities 2.35 Proximity to research/universities 2.37 Customized workforce training 2.51 Community Development Issue Brief http://www.bostonfed.org/commdev 8 According to the survey, location specialists consider the absence of on- site parking for employees and customers to be a major deal breaker. Similarly, rental/lease rates are a critical factor in whether a particular development site will be attractive to potential business investors. The quality of the labor pool is also a major consideration, along with several measures of the speed with which a municipality deals with site approvals, zoning appeals, and building inspections. “Time to market” was a catchphrase heard often in the original focus groups, with
- 20. near total agreement that in the new, globalized, high-speed economy, firms need to have assurance that they can get up and running quickly, so they can outrun the competition to the marketplace and thereby successfully market their products or services. Any municipal process that appreciably slows the pace of business development is considered a deal breaker. Property tax rates and local tax incentives were considered somewhat less important. Most of the focus group members agreed that many firms request a tax abatement or other development incentive only once they are satisfied with the other attributes of a particular municipality. Among the factors considered relatively unimportant were several that might have been critical a generation or two ago. With the real value of minimum wage rates falling, few of the survey respondents considered that a local minimum wage would be a deal breaker for most firms,
- 21. especially as most firms pay well above such levels. Given the sharp decline in union density and union power, few considered the presence of organized labor in a municipality to be a major barrier to business investment. Access to railroads, once critical to business, has been eclipsed by access to highways and airports. Even the quality of local schools and the proximity of universities and research institutions are seen as relatively unimportant factors in most business location decisions as firms are able to draw on a workforce from a broader region than the particular municipality in which the firm locates.7 7 The one major exception was for those industries that depend on a close working relationship with scientists and engineers (e.g., firms in the life sciences and other highly advanced Community Development Issue Brief http://www.bostonfed.org/commdev
- 22. 9 Based on the list of location factors identified by the expert focus groups and the Likert scores obtained from the survey of site specialists, the Dukakis Center developed a questionnaire to be completed by municipal officials of cities and towns, in which respondents evaluate their city or town’s ability to attract business investment and jobs. The process is enhanced when the municipal leaders invite others to answer the questionnaire, including members of the local Chamber of Commerce, local bankers, educators from local community colleges or vocational schools, and other community organizations. In these instances, a member of the Dukakis staff plays the role of facilitator, providing an opportunity for what often proves to be a robust discussion from a variety of perspectives concerning the answers to many of the questions.8 After a municipality completes the electronic questionnaire, it is
- 23. analyzed with proprietary software at the Dukakis Center that compares the responses of each municipality with the responses from all other EDSAT cities and towns. Hence, the scores given each community are relative to all other EDSAT municipalities. E D S A T A n a l y s i s V a r i a b l e s The close to 80 communities that had completed EDSAT by September 2013 included 19 of the 20 Boston Federal Reserve Bank Massachusetts working cities – all but Fall River – along with 31 other Massachusetts cities and technology-based industries), which still value highly a location near universities and research institutions. (See Bluestone and Clayton-Matthews, 2013.) 8 After analysis of a municipality’s questionnaire, the Dukakis Center gives it a full written and color-coded report, with each question receiving a grade of green, yellow, or red. A green grade suggests the city or town is doing significantly better than other municipalities on this measure,
- 24. while yellow is average, and red means the city or town is doing comparatively poorly on this measure. Each question also has a moon mark. A full moon indicates a factor that the NAIOP and CoreNet location specialists ranked as critical to economic development. A half-moon suggests lesser importance, and a new moon represents a factor that is relatively unimportant in a firm’s location decision. Finally, the report also includes a written analysis by Dukakis Center staff that includes a prioritized list of potential deal breakers and other weaknesses for the municipality to address. Community Development Issue Brief http://www.bostonfed.org/commdev 10 towns.9 Based on their answers to the survey questions, a set of measures was created to quantify factors presumed to be related to the business location decision. Each measure was based on the answer to one or more of the questions. The final set of 26 factors used in this analysis are those that were
- 25. deemed “Very Important” or “Important” by a majority of the NAIOP/CoreNET respondents (See Appendix A). E c o n o m i c D e v e l o p m e n t C o r r e l a t i o n A n a l y s i s The question we wish to answer is which, if any, of the EDSAT location measures are correlated with the pattern of employment growth we observe across the working cities? Do the measures that location specialists deemed most important for municipalities in general apply equally to the working cities of Massachusetts? Given the small size of the sample (N = 19), we use simple zero-order correlation coefficients to indicate any possible link between each of the location factors on the one hand and employment growth on the other. We arbitrarily selected a correlation coefficient of +.15 or greater to signify a positive relationship between a given EDSAT measure and the 2001– 2013 percentage
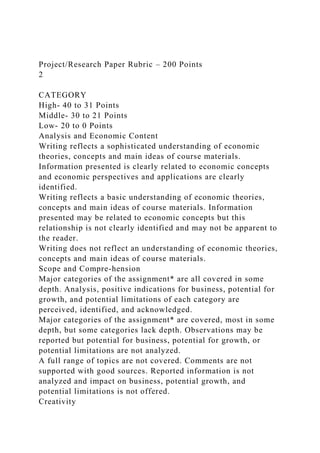
- 26. change in employment.10 Figure 3 reveals the location measures with correlation coefficients of +.15 or higher for employment growth. 9 In addition to the 50 Massachusetts municipalities, nine Rhode Island communities, seven in New Hampshire, two in Connecticut, and one in Maine have alsocompleted the EDSAT process, along with a small assortment of communities in Georgia, Kansas, Maryland, Pennsylvania, South Carolina, Tennessee, and the State of Washington, under a joint agreement with the National League of Cities. 10 This paper does not attempt a formal statistical analysis due to the relatively small number of observations. Community Development Issue Brief http://www.bostonfed.org/commdev 11
- 27. Figure 3 S o u r c e : E D S A T a n a l y s i s . By far, the measure most highly correlated with employment growth is a v a i l a b l e d e v e l o p m e n t s i t e s , with a zero-order correlation coefficient of +.59. According to our measure, working cities that have publicly owned sites available for economic development, protect industrial land from residential encroachment, have an active strategy for reclaiming vacant shopping centers and tax-delinquent properties, have up-to-date lists of existing commercial and industrial sites, or work actively with property brokers and developers to identify appropriate properties are substantially more likely to attract new employment to their communities. Clearly, if working cities want to be in the running for new investment, they need to make development sites available.
- 28. Community Development Issue Brief http://www.bostonfed.org/commdev 12 S i t e a m e n i t i e s , with a correlation coefficient of +.37, are also very important for attracting new employers. Firms are more likely to opt for sites with nearby fast-food restaurants for their employees, along with fine-dining facilities, retail shops, and day care centers. E c o n o m i c - d e v e l o p m e n t m a r k e t i n g has the third-highest positive correlation coefficient, just one point lower than the coefficient for site amenities. The EDSAT variables that comprise this measure include whether the city has a marketing strategy keyed to specific industry needs, whether it maintains a rapid- response team to cater to the concerns raised by the local business community, whether within municipal government there is a designated spokesperson for
- 29. economic development, and whether the city engages its own populace in encouraging local business investment. Those working cities that have more comprehensive marketing campaigns appear to do better in attracting business investment and jobs, possibly in part because a comprehensive marketing campaign helps change the negative impressions -- or what the location specialists call the “cognitive maps” -- that location specialists and firms may have of older industrial cities. For this reason, development marketing may be much more important for working cities than for locations that have not suffered the stigma of deindustrialization and urban decay. Timeliness of the mu n i c i p a l a p p r o v a l p r o c e s s has the fourth- highest correlation coefficient (+.25). This measure is a composite of responses to 10 EDSAT questions regarding the time it takes a city to complete a site plan
- 30. review, make a decision on a zoning variance, grant a special permit or building permit, as well as the duration of the appeals process for new and existing structures. This measure’s reasonably strong correlation with improved employment seems to confirm the importance of time to market, which location specialists insist is a critical factor in today’s global economy. Anything that slows this process puts a city at a disadvantage in its competition for business investment. Community Development Issue Brief http://www.bostonfed.org/commdev 13 Available parking for employees and customers also appears to be important for attracting investment, fully consistent with the location specialist survey results (+.18).
- 31. The final factor that met the +.15 correlation coefficient criteria is school success. 11 Working cities that spend more on their public schools and have more successful students appear to have a slight advantage in attracting new employers. Learning of cities’ school success no doubt also helps correct firms’ negative preconceptions about working cities. Table 3 summarizes the data on correlation coefficients between employment growth and each of the EDSAT measures. A number of measures came very close to meeting the arbitrary +.15 coefficient criterion. These include adequate electric, gas, water, and communications infrastructure (+.14), fast-track permitting (+.14, the use of marketing follow-up Labor force quality to learn why firms either decided to settle in the municipality or chose to locate elsewhere
- 32. (+.13), and , as measured by the number of professionals and well-trained workers in the city (+.13). Each of these was positively correlated with employment growth, suggesting they might have at least a marginal impact on the decision to locate within the working cities. What may be equally important is the apparent absence of a strong statistical correlation between employment growth and such variables as crime rates, the existence of complementary business services such as law and accounting firms, the availability of public transit, and nearby highway access. Moreover, within the working cities, there turned out to be no variance in labor cost in the EDSAT measure and therefore zero correlation with employment growth. 11 This measure is based on the combined scores of the following specific EDSAT questions: K – 12 per-pupil expenditure in the city’s public schools; Percentage of students scoring “proficient”
- 33. on the statewide MCAS English test; Percentage of students scoring “proficient” on the statewide MCAS mathematics test; High school graduation rate; Percentage of high school seniors going to college; Presence of one or more charter schools Community Development Issue Brief http://www.bostonfed.org/commdev 14 What is most interesting are the relatively large negative coefficients on such measures as high traffic congestion, low local tax rates, the level of reputed citizen opposition to development, the quality of available development sites, and the apparent physical attractiveness of the city. Table 3. C o r r e l a t i o n b e t w e e n E D S A T V a r i a b l e s a n d E m p l o y m e n t G r o w t h , A l l P r i v a t e - S e c t o r Industries in Working Cities 2 0 0 1 – 2 0 1 3 : I I E D S A T M e a s u r e
- 34. C o r r e l a t i o n C o e f f i c i e n t Available sites for development +.59 Site amenities +.37 Economic-development marketing +.36 Timeliness of approvals +.25 Available parking +.18 School success +.15 Adequate infrastructure +.14 Fast-track permitting +.14 Cross-Marketing – public/private efforts +.13 Marketing follow-up +.13 Labor quality +.13 Low crime rates +.07 Complementary business services +.07 Good public transit +.04 Labor cost .00 Predictable permitting -.02 Highway access -.03 Adoption of a comprehensive marketing plan -.07 Commercial/Industrial rents -.08 Cultural and recreational amenities -.12 Traffic congestion -.23 Low local tax rates -.27 Low housing costs -.28 Quality of available development sites -.33 Little citizen opposition to development -0.35 Physical attractiveness of the municipality -0.35
- 35. S o u r c e : E D S A T a n a l y s i s . Community Development Issue Brief http://www.bostonfed.org/commdev 15 Apparently, being less physically attractive does not put a working city at a disadvantage when it comes to attracting new businesses. Even more surprising, higher local tax rates contributed to better employment outcomes between 2001 and 2013, suggesting the possibility that higher tax levies provide the possibility of better public services that are conducive to business. Essentially, the results suggest that working cities need to concentrate on readying sites for development and marketing the municipality so as to make these cities’ positive attributes abundantly clear to location specialists and
- 36. prospective firms. Assuring that firms will be able to obtain timely approval of their development plans also appears to sway firms’ decision on where to locate. Other Correlates with Establishment and Employment Growth in the Working Cities We studied three other factors that may be correlated with job growth in the working cities. The first was the distance from the City of Boston. One hypothesis is that firms desire to be in communities near Boston because of its cluster of universities, its financial sector, other business services, and its rich array of cultural amenities. Our analysis suggests some weak support for this factor (–.16). On average, the further away from Boston, the weaker the employment growth trend between 2001 and 2013. This would suggest that improving access to Boston through better transit may be one way to improve
- 37. employment prospects for these working cities. Another factor we tested was the relationship between a city’s median household income and employment growth. Here we found, if anything, an inverse correlation between household income and a city’s employment growth (–.17). Cities with the poorest populations among the working cities do not appear to be at any special disadvantage when it comes to their ability to retain and attract establishments that provide employment opportunity. Community Development Issue Brief http://www.bostonfed.org/commdev 16 Finally, we studied the relationship between having a large manufacturing base in 2000 and employment growth over the following decade. What we found was a positive correlation (+.13) as Massachusetts began to experience a
- 38. manufacturing renaissance (Bluestone, Gartsman, Walsh, Eckel, and Huessy, 2012). Manufacturing is now helping older industrial cities recover. A r e t h e W o r k i n g C i t i e s D i f f e r e n t f r o m O t h e r C o m m u n i t i e s ? The last question we need to address is whether the Federal Reserve Bank of Boston’s working cities are unique in the factors that contribute to employment growth. To do this, we ran correlations for 31other cities and towns in Massachusetts that have completed the EDSAT process, but which in general have higher household incomes, have experienced substantially less deindustrialization, and have suffered less poverty. Figure 4 shows the EDSAT measures with the highest correlation coefficients with 2001– 2013:II employment growth for these municipalities. These results suggest an array of factors that are closely aligned with the
- 39. survey responses we received from the site and location specialists we originally surveyed. A v a i l a b l e p a r k i n g was highly correlated with employment growth in these communities (+.36), along with l o w t r a f f i c c o n g e s t i o n (+.21), and h i g h w a y a c c e s s (+.19). These are all factors that make firms accessible both for their employees and their customers. L a b o r q u a l i t y in a municipality is also positively correlated with job growth in these municipalities (+.21). Finally, p r e d i c t a b l e p e r m i t t i n g also appears to correlate with greater employment growth in these municipalities (+.20). Economic development marketing, which was important for the working cities, seems to be less important for this larger group of municipalities, as is the express need to create development sites with sufficient amenities—possibly because for this group of cities, amenities may already be in place and economic development marketing may be less
- 40. unnecessary. Community Development Issue Brief http://www.bostonfed.org/commdev 17 Figure 4 S o u r c e : E D S A T a n a l y s i s . C o n c l u s i o n s While we can draw no definitive conclusions from this analysis, given the limited statistical value that we obtain from simple zero-order correlation analysis, the results for both the working cities and the larger set of cities and towns point to a set of factors that appear to be connected to employment growth. What is most intriguing is the relatively high positive
- 41. correlations we find, in the working cities, for measures over which municipal leaders actually have some control. Timeliness of approvals and economic development marketing are the kinds of factors that enlightened city government can implement if the will is there to do so. Making development sites available for business and equipping those sites with a range of amenities are steps municipal leaders can take that appear likely to attract business and employment. Many of the working cities have abandoned mills that can and are being converted to new commercial and industrial uses. Providing adequate parking near development sites can also help stimulate business investment, according to the results presented here. Community Development Issue Brief http://www.bostonfed.org/commdev 18
- 42. It is more difficult to rapidly improve school quality or provide for adequate water, sewer, electric, gas, and communications infrastructure in cities that have deficits in these areas, but if our analysis is at all accurate, these factors turn out to be somewhat less important for successful employment growth in working cities. What this means is that even cities that have experienced severe deindustrialization in the past and are struggling to provide good schools and safe streets can affect their own economic destiny by focusing on improving municipal processes and using economic development marketing to change obsolete negative preconceptions about them. The key seems to be effective municipal leadership, especially when it forges a strong working relationship with the local business community.
- 43. Community Development Issue Brief http://www.bostonfed.org/commdev 19 R e f e r e n c e s Arsen, D. (1997). Is there really an infrastructure/economic development link? In R. Bingham & R. Meir (Eds.) Dilemmas of urban economic development: Issues in theory and practice (pp. 82-103).Thousand Oaks, CA: Sage Publications. Bartik, T. (1988). The effects of environmental regulation on business location in the United States. Growth and Change, 19(3), 22–44. Bluestone, B., & Clayton-Matthews, A. (2013). Life sciences innovation as a catalyst for economic development: The role of the Massachusetts Life Sciences Center. Boston: The Boston Foundation. Bluestone, B., Gartsman, A., Walsh, D., Eckel, R., & Huessy, J. (2012. Staying power II: The future of manufacturing in Massachusetts. Boston: The Boston Foundation. Bluestone, B., & Harrison, B. (1982). The deindustrialization of America: Plant closings, community abandonment and the dismantling of basic
- 44. industry. New York: Basic Books. Bradbury, K., Downs, A., & Small, K. (1982). Urban decline and the future of American cities. Washington, DC: The Brookings Institution. Brunnermeier, S., & Levinson, A. (2004). Examining the evidence on environmental regulations and industry location. Journal of Environment and Development, 13(1), 6–41. Buss, T. (2001). The effect of state tax incentives on economic growth and firm location decisions: An overview of the literature. Economic Development Quarterly, 15(1), 90–105. Deller, S., Lledo, V., & Marcouiller, D. (2008). Modeling regional economic growth with a focus on amenities. Review of Urban and Regional Development Studies, 20(1), 1–21. Forkenbrock, D., & Foster, N. (1996). Highways and business location decisions. Economic Development Quarterly, 10(3), 239–248. Gkritza, K., Sinha, K., Labi, S., & Mannering, F. (2007). Influence of highway construction projects on economic development: An empirical assessment. Annals of Regional Science, 42(3), 545–563 Glaeser, E., & Saiz, A. (2004). The rise of the skilled city.
- 45. Brookings-Wharton Papers on Urban Affairs, 47–94. Granger, M., & Blomquist, G. (1999.) Evaluating the influence of amenities on the location of manufacturing establishments in urban areas. Urban Studies, 36(11), 1859–1873. Hill, E. W., & Brennan, J. (2005). America’s central cities and the location of work. Journal of the American Planning Association, 71(4), 411–432. Kimelberg, S. (2013). Labor needs, crime, and the business location decision: A qualitative account. Community Development, October. Kimelberg, S., & Williams, E. (2013). Evaluating the importance of business location factors: The influence of facility type. Growth and Change, 44(1), 92– 117. Community Development Issue Brief http://www.bostonfed.org/commdev 20 Kodrzycki, Y., & Muñoz, A. P. (2013). Economic distress and resurgence in U.S. central cities: Concepts, causes, and policy levers (Public Policy Discussion
- 46. Papers No. 13-3). Boston: Federal Reserve Bank of Boston. Mallach, A. (2012). In Philadelphia’s shadow: Small cities in the Third Federal Reserve District (Special Report by the Community Development Studies and Education Department). Philadelphia: Federal Reserve Bank of Philadelphia. Mallach, A. (2013). Parallel histories, diverging trajectories: Resilience in small industrial cities. In S. Wachter & K. Zeuli (Eds.), Revitalizing America’s cities (pp. 125-146). Philadelphia: University of Pennsylvania Press. Simon, C. J. (1998). Human capital and metropolitan employment growth. Journal of Urban Economics, 43(2), 223–243.
- 47. Community Development Issue Brief http://www.bostonfed.org/commdev 21 A p p e n d i x A : L o c a t i o n F a c t o r s l o c a t i o n s p e c i a l i s t s i n d i c a t e d a s “ V e r y I m p o r t a n t ” o r “ I m p o r t a n t ” Highway access Parking availability Traffic congestion Infrastructure limitations Commercial/industrial rents Labor force skills Timeliness of approvals
- 48. Public transit availability Physical attractiveness of municipality Complementary business services Critical mass of firms – local supply-chain firms Cross-marketing by municipality and business community Marketing follow-up with locating/relocating firms Quality of available development parcels Labor cost Formal economic development strategy Available development sites Predictable permitting Fast-track permitting Citizen participation in development process Cultural and recreational amenities Crime rates Housing cost School success measures
- 49. Amenities near available development sites Local tax rate environment