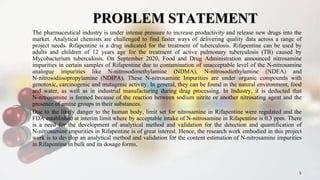
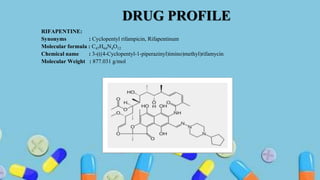
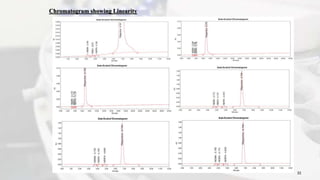
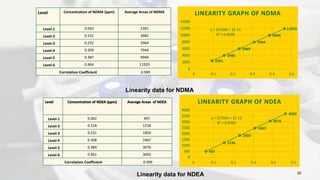
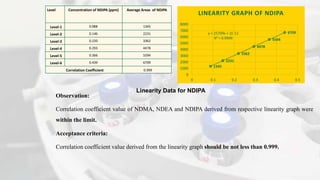
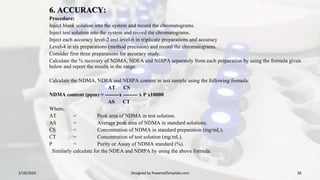
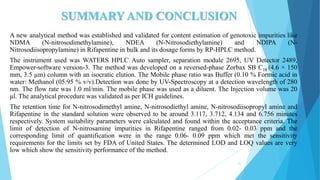
1. The document discusses the development and validation of an analytical method to detect and quantify levels of three genotoxic nitrosamine impurities - N-nitrosodimethylamine (NDMA), N-nitrosodiethylamine (NDEA), and N-nitrosodiisopropylamine (NDIPA) - in the drug rifapentine and its dosage forms.
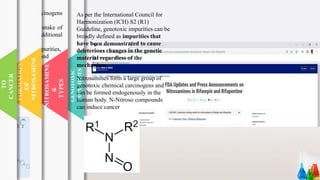
2. Rifapentine is an antibiotic used to treat tuberculosis, but certain samples were found to contain unacceptable levels of nitrosamine impurities. The FDA set interim limits of 0.3 ppm for nitrosamines in rifapentine.
3. The project aims to develop an accurate analytical method and


![Polymer [ बहुलक ] Chemistry Notes PDF - Irfanullah Mehar - JJ Sir Chemistry.pdf](https://cdn.slidesharecdn.com/ss_thumbnails/polymerchemistrynotespdf-irfanullahmehar-jjsirchemistry-260210172118-3f9b37f7-thumbnail.jpg?width=640&height=640&fit=bounds)


