SlideShare a Scribd company logo
1 of 140
Project Charter Template
www.ProjectManagementDocs.com
Project Charter Template
This Project Charter Template is free for you to copy and use on
your project and within
your organization. We hope that you find this template useful
and welcome your comments. Public distribution of this
document is only permitted from the Project Management Docs
official website at:
www.ProjectManagementDocs.com
Project Charter
<Project Name>
Company Name
Street Address
City, State Zip Code
Date
Project Charter
Payroll Project
<Paragraph 1: Formally authorize the project>
This Charter formally authorizes the Payroll Project to develop
and implement a new payroll system for use in Jones Consulting
Company’s payroll group. A project plan will be developed and
submitted to the Project Sponsor for approval. The project plan
will include: scope statement; schedule; cost estimate; budget;
and provisions for scope, resource, schedule, communications,
quality, risk, procurement, and stakeholder management as well
as project control. All resources will be assigned by the Project
Sponsor, Van Johnson, Human Resources Director.
<Paragraph 2: Project Scope - State the scope of the project, its
deliverable and what business needs, problems or opportunities
the project addresses – a market demand, business need, legal
requirement, social need, customer request or technological
advance >
The purpose of the Payroll project is to improve the timeliness
and accuracy of payroll operations. This project meets Jones
Consulting’s need for improved efficiencies across all
departments by reducing payroll cycle time and minimizing
staffing required for payroll operations. The project
deliverables shall include payroll system design, all coding,
testing, implementation of an integrated system for use with
existing IT infrastructure, and a user’s guide. The objectives of
the Payroll project are to reduce payroll cycle time by 30% and
reduce payroll staffing by 20%. High level risks for this project
include ensuring implementation is completed without
impacting ongoing payroll operations and ensuring there are no
issues with migrating payroll accounts from the legacy system
to the new system. Success will be determined by the Project
Sponsor once the system is implemented and one full payroll
cycle has been completed that meets the objectives with no
discrepancies.
<Paragraph 3: Identify the Project Manager and give him/her
authority to apply organization resources to the project >
The Project Manager, Bill Smith, is hereby authorized to
interface with management as required, negotiate for resources,
delegate responsibilities within the framework of the project,
and to communicate with all contractors and management, as
required, to ensure successful and timely completion of the
project. The Project Manager is responsible for developing the
project plan, monitoring the schedule, cost, and scope of the
project during implementation, and maintaining control over the
project by measuring performance and taking corrective action.
<Paragraph 4: Provide the summary milestone schedule >
The project plan will be submitted and approved in accordance
with the milestone schedule below. Upon approval of the
project plan resources will be assigned to the project and work
will commence within 5 business days. The Project Sponsor
must approve any schedule changes which may impact
milestones. A detailed schedule will be included in the project
plan. The high level milestone schedule is:
Feb 1, 20xx – Project Plan Complete and Approved
Mar 31, 20xx – Payroll Design Completed
May 31, 20xx – Coding Completed
June 30, 20xx – Testing Completed
July 31, 20xx – Beta Testing Completed
Sept 30, 20xx – Implementation Completed
Oct 15, 20xx – One Payroll Cycle Complete and Project
Completion
<Paragraph 5: Project Budget – state the budget for the project
and identify funding sources >
The budget for the Payroll project is $420,000. It is to be
funded through the FYxx Human Resources Technology Budget.
Sponsor Acceptance
Approved by the Project Sponsor:
Date:
<Project Sponsor Name>
<Project Sponsor Title>
Free Project Charter Template brought to you by
www.ProjectManagementDocs.com
FIN 320 Module Four Excel Assignment Rubric
This assignment builds on the work you did for the Excel
assignment in Module Three. To get started, find and open the
file you submitted. From there,
complete the following steps:
1. Financial Data
Using the same company you selected in Module Three, add
another two years of financial statement data so that you have
three years of annual data
to review for historical analysis. In all, your Excel file must
include the following:
o Three worksheets of annual balance sheet data
o Three worksheets of annual income statement data
o Three worksheets of annual statement of cash flow data
Important Note: Be sure to label each worksheet in Excel with
the appropriate year, as you did in the Module Three
assignment.
2. Ratio Calculation
On each data tab, use formulas to calculate the following
financial indicators for each year of data:
o Current ratio
o Debt/equity ratio
o Free cash flow
o Earnings per share
o Price/earnings ratio
o Return on equity
o Net profit margin
3. Written Responses
In a separate Word document, respond to the following:
o Describe how and why each of the ratios has changed over the
three-year period. For example, did the current ratio increase or
decrease? Why?
Describe how three of the ratios you calculated for your
company compare to the general industry. Find general industry
data by entering your specific
company’s ticker symbol here. Be sure to watch the Mergent
Online video (written instructions can be found here), as it will
help you find the industry data.
4. Professionalism, References, and Mechanics
Format the data on all worksheets so that the file has a neat and
professional appearance. Include links and properly formatted
citations referencing the
location of the data used. Your written responses should be free
of errors in organization, grammar, and style.
http://www.mergentonline.com.ezproxy.snhu.edu/basicsearch.ph
p
https://www.youtube.com/watch?v=FGcYg-WEt9g
http://snhu-
media.snhu.edu/files/course_repository/undergraduate/fin/fin32
0/fin320_mergent_online_instructions.pdf
Guidelines for Submission: Submit an Excel file that meets the
criteria described in the prompt. The written responses should
be done in a Word document. Be
sure to include both the Excel file and Word document.
Citations should be formatted according to APA style.
Critical Elements Exemplary (100%) Proficient (85%) Needs
Improvement (55%) Not Evident (0%) Value
Financial Data Meets “Proficient” criteria and
presents information in a well-
organized manner with clearly
labeled tabs and data sections
Includes three years of financial
statement data (three annual
balance sheets, three annual
income statements, and three
annual statements of cash flows)
for the company selected, with
minor errors or no errors
Includes three years of financial
statement data (three annual
balance sheets, three annual
income statements, and three
annual statements of cash flows)
for the company selected, with
noticeable errors
Does not include three years of
financial statement data (three
annual balance sheets, three
annual income statements, and
three annual statements of cash
flows) for the company selected
20
Ratio Calculation Meets “Proficient” criteria and
presents information in a clear
and well-organized manner
Accurately calculates the
financial indicators (current
ratio, debt/equity ratio, free
cash flow, earnings per share,
price/earnings ratio, return on
equity, and net profit margin),
with minor errors or no errors
Calculates the financial
indicators (current ratio,
debt/equity ratio, free cash flow,
earnings per share,
price/earnings ratio, return on
equity, and net profit margin),
with noticeable errors
Does not calculate the financial
indicators (current ratio,
debt/equity ratio, free cash flow,
earnings per share,
price/earnings ratio, return on
equity, and net profit margin)
40
Written Responses:
Changes in Ratios
Meets “Proficient” criteria and
includes supporting details and
data
Describes how and why each of
the ratios has changed over the
three-year period in a clear and
logical manner
Describes how and why each of
the ratios has changed over the
three-year period but presents
some information in an unclear
or illogical manner
Does not describe how and why
each of the ratios has changed
over the three-year period
15
Written Responses:
Comparison to Industry
Meets “Proficient” criteria and
includes supporting details and
data
Describes how the selected
ratios compare to the general
industry in a clear and logical
manner
Describes how the selected
ratios compare to the general
industry but presents some
information in an unclear or
illogical manner
Does not describe how the
selected ratios compare to the
general industry
15
Professionalism,
References, and
Mechanics
Meets “Proficient” criteria, and
the material is presented in an
especially polished and easy to
read format
Formats data with a neat and
professional appearance and
includes properly formatted
APA-style citations and links with
minor errors or no errors; any
errors related to organization,
grammar, and style are minor
Formats data and provides
citations and links, but there are
deficiencies in the appearance of
the data and/or flaws in the
citation formatting; there are
some errors related to
organization, grammar, and style
Does not format data with a
neat and professional
appearance or include properly
formatted APA-style citations
and links; there are major errors
related to organization,
grammar, and style
10
Earned Total 100%
Sheet: 2018 Balance Sheet
Sheet: 2018 Income Statement
Sheet: 2018 Cash Flows
Sheet: 2018 Stock Prices
Tesla, Inc.
TESLA INC
As Reported Annual Balance Sheet
Balance Sheet
Report Date
43465.0
Currency
USD
Audit Status
Not Qualified
Consolidated
Yes
Scale
Thousands
11658.0
Dec 31,
Dec 31,
Dec 31,
2018.0
2017.0
2016.0
2015.0
Assets
Current assets
Cash and cash equivalents
3685618.0
3367914.0
3393216.0
1196908.0
Restricted cash and marketable securities
192551.0
105519.0
22628.0
- current
Accounts receivable
949022.0
515381.0
499142.0
168965.0
Inventory
3113446.0
2263537.0
2067454.0
1277838.0
Prepaid expenses and other current assets
365671.0
268365.0
194465.0
115667.0
Total current assets
8306308.0
6570520.0
6259796.0
2782006.0
Operating lease vehicles, net
2089758.0
6570520.0
3134080.0
1791403.0
Solar energy systems, leased and to be leased,
6271396.0
6570520.0
5919880.0
?
net
Property, plant and equipment, net
1.1330077E7
6570520.0
5982957.0
3403334.0
Intangible assets, net
282492.0
6570520.0
376145.0
12574.0
My Power customer notes receivable, net
421548.0
6570520.0
506302.0
?
of current portion
Restricted cash, net of current portion
398219.0
6570520.0
268165.0
31522.0
Other assets
571657.0
6570520.0
216751.0
47100.0
Total assets
2.9739614E7
6570520.0
2.2664076E7
8067939.0
Liabilities and Stockholders? Equity
Current liabilities
Accounts payable
3404451.0
2390250.0
1860341.0
916148.0
Accrued and other current liabilities
2094253.0
1731366.0
1210028.0
422798.0
Deferred revenue
630292.0
1015253.0
763126.0
423961.0
Resale value guarantees
502840.0
787333.0
179504.0
136831.0
Customer deposits
792601.0
853919.0
663859.0
283370.0
Current portion of long-term debt and capital
2567699.0
796549.0
1150147.0
627927.0
leases (1)
Total current liabilities
9992136.0
7676670.0
5827005.0
2811035.0
Long-term debt and capital leases, net
5969500.0
2021093.0
of current portion (1)
9403672.0
9418319.0
Deferred revenue, net of current portion
990873.0
1177799.0
851790.0
446105.0
Resale value guarantees, net of current
328926.0
2309222.0
2210423.0
1293741.0
portion
Other long-term liabilities
2710403.0
2442970.0
1891449.0
364976.0
Total liabilities
2.342601E7
2.302298E7
1.6750167E7
6936950.0
Redeemable noncontrolling interests
555964.0
397734.0
367039.0
?
in subsidiaries
Convertible senior notes (1)(2)
8784.0
47285.0
Stockholders? equity
4752911.0
1083704.0
Noncontrolling interests in subsidiaries
834397.0
997346.0
785175.0
?
Total liabilities and equity
2.9739614E7
2.8655372E7
2.2664076E7
8067939.0
Reference
United States Securities and Exchange Commission (2019).
Form 10-k - Tesla Inc. Acccessed
at:https://www.sec.gov/Archives/edgar/data/1318605/00015645
9018002956/tsla-10k_20171231.htm
Tesla, Inc.
Income Statement
As Reported Annual Income statement
Report Date
43465.0
Currency
USD
Audit Status
Not Qualified
Consolidated
Yes
Scale
Thousands
Dec 31,
Dec 31,
Dec 31,
2018.0
2017.0
2016.0
Revenue
Automotive
1739449.0
1917442.0
1014337.0
Automotive leasing
254674.0
231285.0
102670.0
Total automotive revenue
1994123.0
2148727.0
1117007.0
Energy generation and storage
131385.0
23334.0
11494.0
Services and other
159123.0
126375.0
85878.0
Total revenue
2.1461268E7
1.1758751E7
7000132.0
Cost of revenue
1372604.0
1355102.0
831349.0
Automotive
Automotive leasing
171818.0
161959.0
65092.0
Total automotive cost of revenue
1544422.0
1517061.0
896441.0
Energy generation and storage
127779.0
24281.0
10134.0
Services and other
177152.0
120359.0
89240.0
Total cost of revenue (1)
1.7419247E7
9536264.0
5400875.0
Gross profit
4042021.0
2222487.0
1599257.0
Operating expenses
1460370.0
1378073.0
834408.0
Research and development (1)
Selling, general and administrative (1)
2834491.0
336811.0
288654.0
Total operating expenses
4294861.0
3854573.0
2266597.0
Income (loss) from operations
-252840.0
85622.0
-260333.0
Interest income
2179.0
2858.0
750.0
Interest expense (2)(3)
-663071.0
-46713.0
-38617.0
Other income (expense), net (4)
121224.0
-11756.0
-17149.0
Income (loss) before income taxes
-1004745.0
-2209032.0
-746348.0
Provision for income taxes
11070.0
8133.0
5048.0
Net income (loss)
-219469.0
21878.0
-320397.0
Net income (loss) attributable to noncontrolling
-98132.0
$?
$?
interests and redeemable noncontrolling
interest
Net income (loss) attributable to common
-976091.0
-1961400.0
-674914.0
stockholders
Net income (loss) per common share attributable
to common stockholders:
Basic
-5.72
-11.83
-4.68
Diluted
-5.72
-11.83
-4.68
Shares used in per share calculation:
Basic
170525.0
165758.0
144212.0
Diluted
170525.0
162758.0
144212.0
Notes:
(1) Includes stock-based compensation
expense of the following for the periods
presented:
Cost of revenue
8562.0
8939.0
5995.0
Research and development
41304.0
40220.0
25452.0
Selling, general and administrative
37845.0
40384.0
24158.0
Total stock-based compensation expense
87711.0
89543.0
55605.0
(2) Interest expense includes non-cash
39915.0
33135.0
27285.0
interest expense related to convertible
notes and other borrowing for the periods
presented:
(3) Interest expense includes the following
as a result of the assumed debt from SolarCity:
Interest expense (excluding amortization
5476.0
$?
$?
of debt discount and fees)?recourse debt
Interest expense (excluding amortization
10007.0
?
?
of debt discount and fees)?non-recourse
debt
15483.0
$?
$?
(4) Includes one-time gain on acquisition
of SolarCity of $88.7 million recognized
during Q4 2018.
____________________________
Tesla Inc. (2019). Annual Reports. Retrieved from:
http://www.annualreports.com/Company/tesla-motors
Tesla, Inc.
8-K
02/22/2017
A report on Annual Cash Flows
Cash Flows
Report Date
43465.0
Currency
USD
Audit Status
Not Qualified
Consolidated
Yes
Scale
Thousands
Dec 31,
Dec 31,
Dec 31,
Dec 31,
2018.0
2017.0
2016.0
2015.0
Cash flows from operating activities
Net loss
-1062582.0
-2240578.0
-773046.0
-888663.0
Adjustments to reconcile net loss to net
cash provided by (used in) operating activities:
Depreciation and amortization
1901050.0
1636003.0
947049.0
422590.0
Stock-based compensation
749024.0
466760.0
334245.0
197999.0
Gain on acquisition of SolarCity
-88727.0
?
?
?
Other
-8068.0
67481.0
106826.0
236864.0
Change in operating assets and liabilities,
net of impact of business combination
Accounts receivable
-496732.0
-24635.0
-32106.0
46267.0
Inventory and operating lease vehicles
-1023264.0
-178850.0
-482478.0
-1573860.0
Accounts payable and accrued liabilities
1722850.0
388206.0
174107.0
263345.0
Deferred revenue
406661.0
468902.0
135948.0
322203.0
Customer deposits
-96685.0
170127.0
16407.0
36721.0
Other
159966.0
81139.0
172516.0
412035.0
Cash provided by (used in) operating activities
-448209.0
423650.0
-29849.0
-524499.0
Cash flows from investing activities
Capital expenditures
-521612.0
-247611.0
-411222.0
-1634850.0
Payments for the cost of solar energy systems,
159669.0
81139.0
?
?
leased and to be leased
Cash acquired through (used in) business
213523.0
?
?
-12260.0
combination
Change in restricted cash and other
-126993.0
-20395.0
-3058.0
-26441.0
Cash used in investing activities
-594751.0
-268006.0
-414280.0
-1673551.0
Cash flows from financing activities
Proceeds (repayments) from debt activities,
-5247057.0
-3995484.0
135000.0
318972.0
net
Collateralized borrowing
-559167.0
511321.0
208793.0
568745.0
Net cash flows from noncontrolling interests
180277.0
?
?
?
Proceeds from issuance of common stock
?
?
-20000.0
730000.0
in a public offering
Other
11897.0
28499.0
-98755.0
-94194.0
Cash provided by (used in) financing activities
1372827.0
-320870.0
225038.0
1523523.0
Effect of foreign exchange rates on cash
-22700.0
3182.0
-10037.0
-34278.0
and cash equivalents
Net increase (decrease) in cash and cash
311429.0
-162044.0
-229128.0
-708805.0
equivalents
Cash at the beginning of the period
3084257.0
3246301.0
1426036.0
1905713.0
Cash at the end of the period
3393216.0
3084257.0
1196908.0
1196908.0
____________________________
United States Securities and Exchange Commission (2019).
Form 10-k - Tesla Inc. Acccessed
at:https://www.sec.gov/Archives/edgar/data/1318605/00015645
9018002956/tsla-10k_20171231.htm
STOCK PRICES
Last seven days stock prices
DATE
CLOSE
76653.0
349.93
43780.0
345.09
43779.0
337.14
43778.0
335.54
43777.0
326.58
43411.0
317.22
43775.0
317.47
Rate of Return
9.27
"The stock had a 9.27 percent return over the period November
6th through November 12th 2019."

More Related Content

Similar to Project Charter Templatewww.ProjectManagementDocs.comProje.docx

Purpose of AssignmentStudents should understand how to use the f.docx
Purpose of AssignmentStudents should understand how to use the f.docxPurpose of AssignmentStudents should understand how to use the f.docx
Purpose of AssignmentStudents should understand how to use the f.docxmakdul
 
Need help with below, apa format , due may 3rd , no plagrism, must c.docx
Need help with below, apa format , due may 3rd , no plagrism, must c.docxNeed help with below, apa format , due may 3rd , no plagrism, must c.docx
Need help with below, apa format , due may 3rd , no plagrism, must c.docxtaitcandie
 
HIM360 Assignment RubricsAssignment 1 Project Scope and
HIM360 Assignment RubricsAssignment 1 Project Scope and HIM360 Assignment RubricsAssignment 1 Project Scope and
HIM360 Assignment RubricsAssignment 1 Project Scope and SusanaFurman449
 
[Insert project title, e.g. Cosmo Inc.”] Project Scope State.docx
[Insert project title, e.g. Cosmo Inc.”] Project Scope State.docx[Insert project title, e.g. Cosmo Inc.”] Project Scope State.docx
[Insert project title, e.g. Cosmo Inc.”] Project Scope State.docxgerardkortney
 
Case Study Continued – Week Five You have been perform.docx
Case Study Continued – Week Five   You have been perform.docxCase Study Continued – Week Five   You have been perform.docx
Case Study Continued – Week Five You have been perform.docxdrennanmicah
 
Week9 Define And Document Business Problems
Week9 Define And Document Business ProblemsWeek9 Define And Document Business Problems
Week9 Define And Document Business Problemshapy
 
L03 integration management
L03 integration managementL03 integration management
L03 integration managementAsa Chan
 
Ol 600 Success Begins / snaptutorial.com
Ol 600  Success Begins / snaptutorial.comOl 600  Success Begins / snaptutorial.com
Ol 600 Success Begins / snaptutorial.comWilliamsTaylor83
 
Ol 600 Massive Success / snaptutorial.com
Ol 600 Massive Success / snaptutorial.comOl 600 Massive Success / snaptutorial.com
Ol 600 Massive Success / snaptutorial.comReynolds019
 
Project Risk Management PlanPurposeThis project provides .docx
Project Risk Management PlanPurposeThis project provides .docxProject Risk Management PlanPurposeThis project provides .docx
Project Risk Management PlanPurposeThis project provides .docxwoodruffeloisa
 
Uop cis 349 week 10 term paper planning an it infrastructure audit for compli...
Uop cis 349 week 10 term paper planning an it infrastructure audit for compli...Uop cis 349 week 10 term paper planning an it infrastructure audit for compli...
Uop cis 349 week 10 term paper planning an it infrastructure audit for compli...eyavagal
 
Uop cis 349 week 10 term paper planning an it infrastructure audit for compli...
Uop cis 349 week 10 term paper planning an it infrastructure audit for compli...Uop cis 349 week 10 term paper planning an it infrastructure audit for compli...
Uop cis 349 week 10 term paper planning an it infrastructure audit for compli...uopassignment
 
Paper deadline[10 pts] Due Saturday 0321 Turn in the followin.docx
Paper deadline[10 pts] Due Saturday 0321 Turn in the followin.docxPaper deadline[10 pts] Due Saturday 0321 Turn in the followin.docx
Paper deadline[10 pts] Due Saturday 0321 Turn in the followin.docxaman341480
 

Similar to Project Charter Templatewww.ProjectManagementDocs.comProje.docx (17)

Indi4
Indi4Indi4
Indi4
 
Ch04
Ch04Ch04
Ch04
 
Purpose of AssignmentStudents should understand how to use the f.docx
Purpose of AssignmentStudents should understand how to use the f.docxPurpose of AssignmentStudents should understand how to use the f.docx
Purpose of AssignmentStudents should understand how to use the f.docx
 
Need help with below, apa format , due may 3rd , no plagrism, must c.docx
Need help with below, apa format , due may 3rd , no plagrism, must c.docxNeed help with below, apa format , due may 3rd , no plagrism, must c.docx
Need help with below, apa format , due may 3rd , no plagrism, must c.docx
 
HIM360 Assignment RubricsAssignment 1 Project Scope and
HIM360 Assignment RubricsAssignment 1 Project Scope and HIM360 Assignment RubricsAssignment 1 Project Scope and
HIM360 Assignment RubricsAssignment 1 Project Scope and
 
[Insert project title, e.g. Cosmo Inc.”] Project Scope State.docx
[Insert project title, e.g. Cosmo Inc.”] Project Scope State.docx[Insert project title, e.g. Cosmo Inc.”] Project Scope State.docx
[Insert project title, e.g. Cosmo Inc.”] Project Scope State.docx
 
Case Study Continued – Week Five You have been perform.docx
Case Study Continued – Week Five   You have been perform.docxCase Study Continued – Week Five   You have been perform.docx
Case Study Continued – Week Five You have been perform.docx
 
Week9 Define And Document Business Problems
Week9 Define And Document Business ProblemsWeek9 Define And Document Business Problems
Week9 Define And Document Business Problems
 
L03 integration management
L03 integration managementL03 integration management
L03 integration management
 
Project initiation
Project initiationProject initiation
Project initiation
 
Ol 600 Success Begins / snaptutorial.com
Ol 600  Success Begins / snaptutorial.comOl 600  Success Begins / snaptutorial.com
Ol 600 Success Begins / snaptutorial.com
 
Ol 600 Massive Success / snaptutorial.com
Ol 600 Massive Success / snaptutorial.comOl 600 Massive Success / snaptutorial.com
Ol 600 Massive Success / snaptutorial.com
 
Project Risk Management PlanPurposeThis project provides .docx
Project Risk Management PlanPurposeThis project provides .docxProject Risk Management PlanPurposeThis project provides .docx
Project Risk Management PlanPurposeThis project provides .docx
 
Uop cis 349 week 10 term paper planning an it infrastructure audit for compli...
Uop cis 349 week 10 term paper planning an it infrastructure audit for compli...Uop cis 349 week 10 term paper planning an it infrastructure audit for compli...
Uop cis 349 week 10 term paper planning an it infrastructure audit for compli...
 
Uop cis 349 week 10 term paper planning an it infrastructure audit for compli...
Uop cis 349 week 10 term paper planning an it infrastructure audit for compli...Uop cis 349 week 10 term paper planning an it infrastructure audit for compli...
Uop cis 349 week 10 term paper planning an it infrastructure audit for compli...
 
Paper deadline[10 pts] Due Saturday 0321 Turn in the followin.docx
Paper deadline[10 pts] Due Saturday 0321 Turn in the followin.docxPaper deadline[10 pts] Due Saturday 0321 Turn in the followin.docx
Paper deadline[10 pts] Due Saturday 0321 Turn in the followin.docx
 

More from stilliegeorgiana

1. The Incident Command System (ICS) is a tool forA. Co.docx
1. The Incident Command System (ICS) is a tool forA. Co.docx1. The Incident Command System (ICS) is a tool forA. Co.docx
1. The Incident Command System (ICS) is a tool forA. Co.docxstilliegeorgiana
 
1. The Thirteenth Amendment effectively brought an end to slaver.docx
1. The Thirteenth Amendment effectively brought an end to slaver.docx1. The Thirteenth Amendment effectively brought an end to slaver.docx
1. The Thirteenth Amendment effectively brought an end to slaver.docxstilliegeorgiana
 
1. The Thirteenth Amendment effectively brought an end to slavery in.docx
1. The Thirteenth Amendment effectively brought an end to slavery in.docx1. The Thirteenth Amendment effectively brought an end to slavery in.docx
1. The Thirteenth Amendment effectively brought an end to slavery in.docxstilliegeorgiana
 
1. The Fight for a True Democracyhttpswww.nytimes.com201.docx
1. The Fight for a True Democracyhttpswww.nytimes.com201.docx1. The Fight for a True Democracyhttpswww.nytimes.com201.docx
1. The Fight for a True Democracyhttpswww.nytimes.com201.docxstilliegeorgiana
 
1. The article for week 8 described hip hop as a weapon. This weeks.docx
1. The article for week 8 described hip hop as a weapon. This weeks.docx1. The article for week 8 described hip hop as a weapon. This weeks.docx
1. The article for week 8 described hip hop as a weapon. This weeks.docxstilliegeorgiana
 
1. The Hatch Act defines prohibited activities of public employees. .docx
1. The Hatch Act defines prohibited activities of public employees. .docx1. The Hatch Act defines prohibited activities of public employees. .docx
1. The Hatch Act defines prohibited activities of public employees. .docxstilliegeorgiana
 
1. The Case for Reparations” by Ta-Nehisi Coates (604-19) in Rere.docx
1. The Case for Reparations” by Ta-Nehisi Coates (604-19) in Rere.docx1. The Case for Reparations” by Ta-Nehisi Coates (604-19) in Rere.docx
1. The Case for Reparations” by Ta-Nehisi Coates (604-19) in Rere.docxstilliegeorgiana
 
1. Some people say that chatbots are inferior for chatting.Others di.docx
1. Some people say that chatbots are inferior for chatting.Others di.docx1. Some people say that chatbots are inferior for chatting.Others di.docx
1. Some people say that chatbots are inferior for chatting.Others di.docxstilliegeorgiana
 
1. Some people say that chatbots are inferior for chatting.Other.docx
1. Some people say that chatbots are inferior for chatting.Other.docx1. Some people say that chatbots are inferior for chatting.Other.docx
1. Some people say that chatbots are inferior for chatting.Other.docxstilliegeorgiana
 
1. Some people say that chatbots are inferior for chatting. Others d.docx
1. Some people say that chatbots are inferior for chatting. Others d.docx1. Some people say that chatbots are inferior for chatting. Others d.docx
1. Some people say that chatbots are inferior for chatting. Others d.docxstilliegeorgiana
 
1. Tell us about yourself and your personal journey that has to .docx
1. Tell us about yourself and your personal journey that has to .docx1. Tell us about yourself and your personal journey that has to .docx
1. Tell us about yourself and your personal journey that has to .docxstilliegeorgiana
 
1. Tell us what characteristics of Loma Linda University are particu.docx
1. Tell us what characteristics of Loma Linda University are particu.docx1. Tell us what characteristics of Loma Linda University are particu.docx
1. Tell us what characteristics of Loma Linda University are particu.docxstilliegeorgiana
 
1. Tell us about yourself and your personal journey that has lea.docx
1. Tell us about yourself and your personal journey that has lea.docx1. Tell us about yourself and your personal journey that has lea.docx
1. Tell us about yourself and your personal journey that has lea.docxstilliegeorgiana
 
1. The Research paper will come in five parts. The instructions are.docx
1. The Research paper will come in five parts. The instructions are.docx1. The Research paper will come in five parts. The instructions are.docx
1. The Research paper will come in five parts. The instructions are.docxstilliegeorgiana
 
1. The minutiae points located on a fingerprint will help determine .docx
1. The minutiae points located on a fingerprint will help determine .docx1. The minutiae points located on a fingerprint will help determine .docx
1. The minutiae points located on a fingerprint will help determine .docxstilliegeorgiana
 
1. The initial post is to be posted first and have 300-500 words.docx
1. The initial post is to be posted first and have 300-500 words.docx1. The initial post is to be posted first and have 300-500 words.docx
1. The initial post is to be posted first and have 300-500 words.docxstilliegeorgiana
 
1. The key elements of supplier measurement are quality, delivery, a.docx
1. The key elements of supplier measurement are quality, delivery, a.docx1. The key elements of supplier measurement are quality, delivery, a.docx
1. The key elements of supplier measurement are quality, delivery, a.docxstilliegeorgiana
 
1. Search the Internet and locate an article that relates to the top.docx
1. Search the Internet and locate an article that relates to the top.docx1. Search the Internet and locate an article that relates to the top.docx
1. Search the Internet and locate an article that relates to the top.docxstilliegeorgiana
 
1. Text mining – Text mining or text data mining is a process to e.docx
1. Text mining – Text mining or text data mining is a process to e.docx1. Text mining – Text mining or text data mining is a process to e.docx
1. Text mining – Text mining or text data mining is a process to e.docxstilliegeorgiana
 
1. Students need to review 3 different social media platforms that a.docx
1. Students need to review 3 different social media platforms that a.docx1. Students need to review 3 different social media platforms that a.docx
1. Students need to review 3 different social media platforms that a.docxstilliegeorgiana
 

More from stilliegeorgiana (20)

1. The Incident Command System (ICS) is a tool forA. Co.docx
1. The Incident Command System (ICS) is a tool forA. Co.docx1. The Incident Command System (ICS) is a tool forA. Co.docx
1. The Incident Command System (ICS) is a tool forA. Co.docx
 
1. The Thirteenth Amendment effectively brought an end to slaver.docx
1. The Thirteenth Amendment effectively brought an end to slaver.docx1. The Thirteenth Amendment effectively brought an end to slaver.docx
1. The Thirteenth Amendment effectively brought an end to slaver.docx
 
1. The Thirteenth Amendment effectively brought an end to slavery in.docx
1. The Thirteenth Amendment effectively brought an end to slavery in.docx1. The Thirteenth Amendment effectively brought an end to slavery in.docx
1. The Thirteenth Amendment effectively brought an end to slavery in.docx
 
1. The Fight for a True Democracyhttpswww.nytimes.com201.docx
1. The Fight for a True Democracyhttpswww.nytimes.com201.docx1. The Fight for a True Democracyhttpswww.nytimes.com201.docx
1. The Fight for a True Democracyhttpswww.nytimes.com201.docx
 
1. The article for week 8 described hip hop as a weapon. This weeks.docx
1. The article for week 8 described hip hop as a weapon. This weeks.docx1. The article for week 8 described hip hop as a weapon. This weeks.docx
1. The article for week 8 described hip hop as a weapon. This weeks.docx
 
1. The Hatch Act defines prohibited activities of public employees. .docx
1. The Hatch Act defines prohibited activities of public employees. .docx1. The Hatch Act defines prohibited activities of public employees. .docx
1. The Hatch Act defines prohibited activities of public employees. .docx
 
1. The Case for Reparations” by Ta-Nehisi Coates (604-19) in Rere.docx
1. The Case for Reparations” by Ta-Nehisi Coates (604-19) in Rere.docx1. The Case for Reparations” by Ta-Nehisi Coates (604-19) in Rere.docx
1. The Case for Reparations” by Ta-Nehisi Coates (604-19) in Rere.docx
 
1. Some people say that chatbots are inferior for chatting.Others di.docx
1. Some people say that chatbots are inferior for chatting.Others di.docx1. Some people say that chatbots are inferior for chatting.Others di.docx
1. Some people say that chatbots are inferior for chatting.Others di.docx
 
1. Some people say that chatbots are inferior for chatting.Other.docx
1. Some people say that chatbots are inferior for chatting.Other.docx1. Some people say that chatbots are inferior for chatting.Other.docx
1. Some people say that chatbots are inferior for chatting.Other.docx
 
1. Some people say that chatbots are inferior for chatting. Others d.docx
1. Some people say that chatbots are inferior for chatting. Others d.docx1. Some people say that chatbots are inferior for chatting. Others d.docx
1. Some people say that chatbots are inferior for chatting. Others d.docx
 
1. Tell us about yourself and your personal journey that has to .docx
1. Tell us about yourself and your personal journey that has to .docx1. Tell us about yourself and your personal journey that has to .docx
1. Tell us about yourself and your personal journey that has to .docx
 
1. Tell us what characteristics of Loma Linda University are particu.docx
1. Tell us what characteristics of Loma Linda University are particu.docx1. Tell us what characteristics of Loma Linda University are particu.docx
1. Tell us what characteristics of Loma Linda University are particu.docx
 
1. Tell us about yourself and your personal journey that has lea.docx
1. Tell us about yourself and your personal journey that has lea.docx1. Tell us about yourself and your personal journey that has lea.docx
1. Tell us about yourself and your personal journey that has lea.docx
 
1. The Research paper will come in five parts. The instructions are.docx
1. The Research paper will come in five parts. The instructions are.docx1. The Research paper will come in five parts. The instructions are.docx
1. The Research paper will come in five parts. The instructions are.docx
 
1. The minutiae points located on a fingerprint will help determine .docx
1. The minutiae points located on a fingerprint will help determine .docx1. The minutiae points located on a fingerprint will help determine .docx
1. The minutiae points located on a fingerprint will help determine .docx
 
1. The initial post is to be posted first and have 300-500 words.docx
1. The initial post is to be posted first and have 300-500 words.docx1. The initial post is to be posted first and have 300-500 words.docx
1. The initial post is to be posted first and have 300-500 words.docx
 
1. The key elements of supplier measurement are quality, delivery, a.docx
1. The key elements of supplier measurement are quality, delivery, a.docx1. The key elements of supplier measurement are quality, delivery, a.docx
1. The key elements of supplier measurement are quality, delivery, a.docx
 
1. Search the Internet and locate an article that relates to the top.docx
1. Search the Internet and locate an article that relates to the top.docx1. Search the Internet and locate an article that relates to the top.docx
1. Search the Internet and locate an article that relates to the top.docx
 
1. Text mining – Text mining or text data mining is a process to e.docx
1. Text mining – Text mining or text data mining is a process to e.docx1. Text mining – Text mining or text data mining is a process to e.docx
1. Text mining – Text mining or text data mining is a process to e.docx
 
1. Students need to review 3 different social media platforms that a.docx
1. Students need to review 3 different social media platforms that a.docx1. Students need to review 3 different social media platforms that a.docx
1. Students need to review 3 different social media platforms that a.docx
 

Recently uploaded

BASLIQ CURRENT LOOKBOOK LOOKBOOK(1) (1).pdf
BASLIQ CURRENT LOOKBOOK  LOOKBOOK(1) (1).pdfBASLIQ CURRENT LOOKBOOK  LOOKBOOK(1) (1).pdf
BASLIQ CURRENT LOOKBOOK LOOKBOOK(1) (1).pdfSoniaTolstoy
 
Beyond the EU: DORA and NIS 2 Directive's Global Impact
Beyond the EU: DORA and NIS 2 Directive's Global ImpactBeyond the EU: DORA and NIS 2 Directive's Global Impact
Beyond the EU: DORA and NIS 2 Directive's Global ImpactPECB
 
POINT- BIOCHEMISTRY SEM 2 ENZYMES UNIT 5.pptx
POINT- BIOCHEMISTRY SEM 2 ENZYMES UNIT 5.pptxPOINT- BIOCHEMISTRY SEM 2 ENZYMES UNIT 5.pptx
POINT- BIOCHEMISTRY SEM 2 ENZYMES UNIT 5.pptxSayali Powar
 
microwave assisted reaction. General introduction
microwave assisted reaction. General introductionmicrowave assisted reaction. General introduction
microwave assisted reaction. General introductionMaksud Ahmed
 
Advanced Views - Calendar View in Odoo 17
Advanced Views - Calendar View in Odoo 17Advanced Views - Calendar View in Odoo 17
Advanced Views - Calendar View in Odoo 17Celine George
 
18-04-UA_REPORT_MEDIALITERAСY_INDEX-DM_23-1-final-eng.pdf
18-04-UA_REPORT_MEDIALITERAСY_INDEX-DM_23-1-final-eng.pdf18-04-UA_REPORT_MEDIALITERAСY_INDEX-DM_23-1-final-eng.pdf
18-04-UA_REPORT_MEDIALITERAСY_INDEX-DM_23-1-final-eng.pdfssuser54595a
 
SOCIAL AND HISTORICAL CONTEXT - LFTVD.pptx
SOCIAL AND HISTORICAL CONTEXT - LFTVD.pptxSOCIAL AND HISTORICAL CONTEXT - LFTVD.pptx
SOCIAL AND HISTORICAL CONTEXT - LFTVD.pptxiammrhaywood
 
Privatization and Disinvestment - Meaning, Objectives, Advantages and Disadva...
Privatization and Disinvestment - Meaning, Objectives, Advantages and Disadva...Privatization and Disinvestment - Meaning, Objectives, Advantages and Disadva...
Privatization and Disinvestment - Meaning, Objectives, Advantages and Disadva...RKavithamani
 
Kisan Call Centre - To harness potential of ICT in Agriculture by answer farm...
Kisan Call Centre - To harness potential of ICT in Agriculture by answer farm...Kisan Call Centre - To harness potential of ICT in Agriculture by answer farm...
Kisan Call Centre - To harness potential of ICT in Agriculture by answer farm...Krashi Coaching
 
Nutritional Needs Presentation - HLTH 104
Nutritional Needs Presentation - HLTH 104Nutritional Needs Presentation - HLTH 104
Nutritional Needs Presentation - HLTH 104misteraugie
 
Web & Social Media Analytics Previous Year Question Paper.pdf
Web & Social Media Analytics Previous Year Question Paper.pdfWeb & Social Media Analytics Previous Year Question Paper.pdf
Web & Social Media Analytics Previous Year Question Paper.pdfJayanti Pande
 
Z Score,T Score, Percential Rank and Box Plot Graph
Z Score,T Score, Percential Rank and Box Plot GraphZ Score,T Score, Percential Rank and Box Plot Graph
Z Score,T Score, Percential Rank and Box Plot GraphThiyagu K
 
Q4-W6-Restating Informational Text Grade 3
Q4-W6-Restating Informational Text Grade 3Q4-W6-Restating Informational Text Grade 3
Q4-W6-Restating Informational Text Grade 3JemimahLaneBuaron
 
“Oh GOSH! Reflecting on Hackteria's Collaborative Practices in a Global Do-It...
“Oh GOSH! Reflecting on Hackteria's Collaborative Practices in a Global Do-It...“Oh GOSH! Reflecting on Hackteria's Collaborative Practices in a Global Do-It...
“Oh GOSH! Reflecting on Hackteria's Collaborative Practices in a Global Do-It...Marc Dusseiller Dusjagr
 
Separation of Lanthanides/ Lanthanides and Actinides
Separation of Lanthanides/ Lanthanides and ActinidesSeparation of Lanthanides/ Lanthanides and Actinides
Separation of Lanthanides/ Lanthanides and ActinidesFatimaKhan178732
 
Software Engineering Methodologies (overview)
Software Engineering Methodologies (overview)Software Engineering Methodologies (overview)
Software Engineering Methodologies (overview)eniolaolutunde
 
mini mental status format.docx
mini    mental       status     format.docxmini    mental       status     format.docx
mini mental status format.docxPoojaSen20
 
Introduction to ArtificiaI Intelligence in Higher Education
Introduction to ArtificiaI Intelligence in Higher EducationIntroduction to ArtificiaI Intelligence in Higher Education
Introduction to ArtificiaI Intelligence in Higher Educationpboyjonauth
 

Recently uploaded (20)

BASLIQ CURRENT LOOKBOOK LOOKBOOK(1) (1).pdf
BASLIQ CURRENT LOOKBOOK  LOOKBOOK(1) (1).pdfBASLIQ CURRENT LOOKBOOK  LOOKBOOK(1) (1).pdf
BASLIQ CURRENT LOOKBOOK LOOKBOOK(1) (1).pdf
 
Beyond the EU: DORA and NIS 2 Directive's Global Impact
Beyond the EU: DORA and NIS 2 Directive's Global ImpactBeyond the EU: DORA and NIS 2 Directive's Global Impact
Beyond the EU: DORA and NIS 2 Directive's Global Impact
 
POINT- BIOCHEMISTRY SEM 2 ENZYMES UNIT 5.pptx
POINT- BIOCHEMISTRY SEM 2 ENZYMES UNIT 5.pptxPOINT- BIOCHEMISTRY SEM 2 ENZYMES UNIT 5.pptx
POINT- BIOCHEMISTRY SEM 2 ENZYMES UNIT 5.pptx
 
microwave assisted reaction. General introduction
microwave assisted reaction. General introductionmicrowave assisted reaction. General introduction
microwave assisted reaction. General introduction
 
Advanced Views - Calendar View in Odoo 17
Advanced Views - Calendar View in Odoo 17Advanced Views - Calendar View in Odoo 17
Advanced Views - Calendar View in Odoo 17
 
18-04-UA_REPORT_MEDIALITERAСY_INDEX-DM_23-1-final-eng.pdf
18-04-UA_REPORT_MEDIALITERAСY_INDEX-DM_23-1-final-eng.pdf18-04-UA_REPORT_MEDIALITERAСY_INDEX-DM_23-1-final-eng.pdf
18-04-UA_REPORT_MEDIALITERAСY_INDEX-DM_23-1-final-eng.pdf
 
SOCIAL AND HISTORICAL CONTEXT - LFTVD.pptx
SOCIAL AND HISTORICAL CONTEXT - LFTVD.pptxSOCIAL AND HISTORICAL CONTEXT - LFTVD.pptx
SOCIAL AND HISTORICAL CONTEXT - LFTVD.pptx
 
Privatization and Disinvestment - Meaning, Objectives, Advantages and Disadva...
Privatization and Disinvestment - Meaning, Objectives, Advantages and Disadva...Privatization and Disinvestment - Meaning, Objectives, Advantages and Disadva...
Privatization and Disinvestment - Meaning, Objectives, Advantages and Disadva...
 
Kisan Call Centre - To harness potential of ICT in Agriculture by answer farm...
Kisan Call Centre - To harness potential of ICT in Agriculture by answer farm...Kisan Call Centre - To harness potential of ICT in Agriculture by answer farm...
Kisan Call Centre - To harness potential of ICT in Agriculture by answer farm...
 
Nutritional Needs Presentation - HLTH 104
Nutritional Needs Presentation - HLTH 104Nutritional Needs Presentation - HLTH 104
Nutritional Needs Presentation - HLTH 104
 
Web & Social Media Analytics Previous Year Question Paper.pdf
Web & Social Media Analytics Previous Year Question Paper.pdfWeb & Social Media Analytics Previous Year Question Paper.pdf
Web & Social Media Analytics Previous Year Question Paper.pdf
 
Z Score,T Score, Percential Rank and Box Plot Graph
Z Score,T Score, Percential Rank and Box Plot GraphZ Score,T Score, Percential Rank and Box Plot Graph
Z Score,T Score, Percential Rank and Box Plot Graph
 
Q4-W6-Restating Informational Text Grade 3
Q4-W6-Restating Informational Text Grade 3Q4-W6-Restating Informational Text Grade 3
Q4-W6-Restating Informational Text Grade 3
 
“Oh GOSH! Reflecting on Hackteria's Collaborative Practices in a Global Do-It...
“Oh GOSH! Reflecting on Hackteria's Collaborative Practices in a Global Do-It...“Oh GOSH! Reflecting on Hackteria's Collaborative Practices in a Global Do-It...
“Oh GOSH! Reflecting on Hackteria's Collaborative Practices in a Global Do-It...
 
Separation of Lanthanides/ Lanthanides and Actinides
Separation of Lanthanides/ Lanthanides and ActinidesSeparation of Lanthanides/ Lanthanides and Actinides
Separation of Lanthanides/ Lanthanides and Actinides
 
Software Engineering Methodologies (overview)
Software Engineering Methodologies (overview)Software Engineering Methodologies (overview)
Software Engineering Methodologies (overview)
 
Mattingly "AI & Prompt Design: The Basics of Prompt Design"
Mattingly "AI & Prompt Design: The Basics of Prompt Design"Mattingly "AI & Prompt Design: The Basics of Prompt Design"
Mattingly "AI & Prompt Design: The Basics of Prompt Design"
 
TataKelola dan KamSiber Kecerdasan Buatan v022.pdf
TataKelola dan KamSiber Kecerdasan Buatan v022.pdfTataKelola dan KamSiber Kecerdasan Buatan v022.pdf
TataKelola dan KamSiber Kecerdasan Buatan v022.pdf
 
mini mental status format.docx
mini    mental       status     format.docxmini    mental       status     format.docx
mini mental status format.docx
 
Introduction to ArtificiaI Intelligence in Higher Education
Introduction to ArtificiaI Intelligence in Higher EducationIntroduction to ArtificiaI Intelligence in Higher Education
Introduction to ArtificiaI Intelligence in Higher Education
 

Project Charter Templatewww.ProjectManagementDocs.comProje.docx

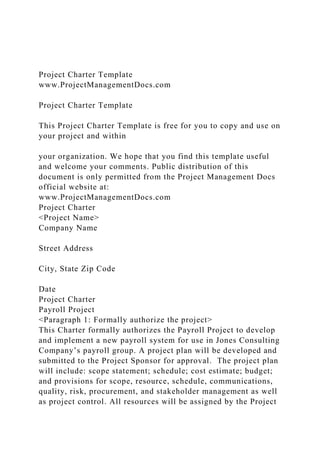
  • 1. Project Charter Template www.ProjectManagementDocs.com Project Charter Template This Project Charter Template is free for you to copy and use on your project and within your organization. We hope that you find this template useful and welcome your comments. Public distribution of this document is only permitted from the Project Management Docs official website at: www.ProjectManagementDocs.com Project Charter <Project Name> Company Name Street Address City, State Zip Code Date Project Charter Payroll Project <Paragraph 1: Formally authorize the project> This Charter formally authorizes the Payroll Project to develop and implement a new payroll system for use in Jones Consulting Company’s payroll group. A project plan will be developed and submitted to the Project Sponsor for approval. The project plan will include: scope statement; schedule; cost estimate; budget; and provisions for scope, resource, schedule, communications, quality, risk, procurement, and stakeholder management as well as project control. All resources will be assigned by the Project
  • 2. Sponsor, Van Johnson, Human Resources Director. <Paragraph 2: Project Scope - State the scope of the project, its deliverable and what business needs, problems or opportunities the project addresses – a market demand, business need, legal requirement, social need, customer request or technological advance > The purpose of the Payroll project is to improve the timeliness and accuracy of payroll operations. This project meets Jones Consulting’s need for improved efficiencies across all departments by reducing payroll cycle time and minimizing staffing required for payroll operations. The project deliverables shall include payroll system design, all coding, testing, implementation of an integrated system for use with existing IT infrastructure, and a user’s guide. The objectives of the Payroll project are to reduce payroll cycle time by 30% and reduce payroll staffing by 20%. High level risks for this project include ensuring implementation is completed without impacting ongoing payroll operations and ensuring there are no issues with migrating payroll accounts from the legacy system to the new system. Success will be determined by the Project Sponsor once the system is implemented and one full payroll cycle has been completed that meets the objectives with no discrepancies. <Paragraph 3: Identify the Project Manager and give him/her authority to apply organization resources to the project > The Project Manager, Bill Smith, is hereby authorized to interface with management as required, negotiate for resources, delegate responsibilities within the framework of the project, and to communicate with all contractors and management, as required, to ensure successful and timely completion of the project. The Project Manager is responsible for developing the project plan, monitoring the schedule, cost, and scope of the project during implementation, and maintaining control over the project by measuring performance and taking corrective action.
  • 3. <Paragraph 4: Provide the summary milestone schedule > The project plan will be submitted and approved in accordance with the milestone schedule below. Upon approval of the project plan resources will be assigned to the project and work will commence within 5 business days. The Project Sponsor must approve any schedule changes which may impact milestones. A detailed schedule will be included in the project plan. The high level milestone schedule is: Feb 1, 20xx – Project Plan Complete and Approved Mar 31, 20xx – Payroll Design Completed May 31, 20xx – Coding Completed June 30, 20xx – Testing Completed July 31, 20xx – Beta Testing Completed Sept 30, 20xx – Implementation Completed Oct 15, 20xx – One Payroll Cycle Complete and Project Completion <Paragraph 5: Project Budget – state the budget for the project and identify funding sources > The budget for the Payroll project is $420,000. It is to be funded through the FYxx Human Resources Technology Budget. Sponsor Acceptance Approved by the Project Sponsor: Date:
  • 4. <Project Sponsor Name> <Project Sponsor Title> Free Project Charter Template brought to you by www.ProjectManagementDocs.com FIN 320 Module Four Excel Assignment Rubric This assignment builds on the work you did for the Excel assignment in Module Three. To get started, find and open the file you submitted. From there, complete the following steps: 1. Financial Data Using the same company you selected in Module Three, add another two years of financial statement data so that you have three years of annual data to review for historical analysis. In all, your Excel file must include the following: o Three worksheets of annual balance sheet data o Three worksheets of annual income statement data o Three worksheets of annual statement of cash flow data Important Note: Be sure to label each worksheet in Excel with the appropriate year, as you did in the Module Three assignment.
  • 5. 2. Ratio Calculation On each data tab, use formulas to calculate the following financial indicators for each year of data: o Current ratio o Debt/equity ratio o Free cash flow o Earnings per share o Price/earnings ratio o Return on equity o Net profit margin 3. Written Responses In a separate Word document, respond to the following: o Describe how and why each of the ratios has changed over the three-year period. For example, did the current ratio increase or decrease? Why? Describe how three of the ratios you calculated for your company compare to the general industry. Find general industry data by entering your specific company’s ticker symbol here. Be sure to watch the Mergent Online video (written instructions can be found here), as it will help you find the industry data. 4. Professionalism, References, and Mechanics Format the data on all worksheets so that the file has a neat and professional appearance. Include links and properly formatted citations referencing the location of the data used. Your written responses should be free of errors in organization, grammar, and style.
  • 6. http://www.mergentonline.com.ezproxy.snhu.edu/basicsearch.ph p https://www.youtube.com/watch?v=FGcYg-WEt9g http://snhu- media.snhu.edu/files/course_repository/undergraduate/fin/fin32 0/fin320_mergent_online_instructions.pdf Guidelines for Submission: Submit an Excel file that meets the criteria described in the prompt. The written responses should be done in a Word document. Be sure to include both the Excel file and Word document. Citations should be formatted according to APA style. Critical Elements Exemplary (100%) Proficient (85%) Needs Improvement (55%) Not Evident (0%) Value Financial Data Meets “Proficient” criteria and presents information in a well- organized manner with clearly labeled tabs and data sections Includes three years of financial statement data (three annual balance sheets, three annual income statements, and three annual statements of cash flows) for the company selected, with minor errors or no errors
  • 7. Includes three years of financial statement data (three annual balance sheets, three annual income statements, and three annual statements of cash flows) for the company selected, with noticeable errors Does not include three years of financial statement data (three annual balance sheets, three annual income statements, and three annual statements of cash flows) for the company selected 20 Ratio Calculation Meets “Proficient” criteria and presents information in a clear and well-organized manner Accurately calculates the financial indicators (current ratio, debt/equity ratio, free cash flow, earnings per share, price/earnings ratio, return on equity, and net profit margin), with minor errors or no errors Calculates the financial indicators (current ratio, debt/equity ratio, free cash flow, earnings per share, price/earnings ratio, return on equity, and net profit margin), with noticeable errors
  • 8. Does not calculate the financial indicators (current ratio, debt/equity ratio, free cash flow, earnings per share, price/earnings ratio, return on equity, and net profit margin) 40 Written Responses: Changes in Ratios Meets “Proficient” criteria and includes supporting details and data Describes how and why each of the ratios has changed over the three-year period in a clear and logical manner Describes how and why each of the ratios has changed over the three-year period but presents some information in an unclear or illogical manner Does not describe how and why each of the ratios has changed over the three-year period 15 Written Responses: Comparison to Industry
  • 9. Meets “Proficient” criteria and includes supporting details and data Describes how the selected ratios compare to the general industry in a clear and logical manner Describes how the selected ratios compare to the general industry but presents some information in an unclear or illogical manner Does not describe how the selected ratios compare to the general industry 15 Professionalism, References, and Mechanics Meets “Proficient” criteria, and the material is presented in an especially polished and easy to read format Formats data with a neat and professional appearance and includes properly formatted APA-style citations and links with
  • 10. minor errors or no errors; any errors related to organization, grammar, and style are minor Formats data and provides citations and links, but there are deficiencies in the appearance of the data and/or flaws in the citation formatting; there are some errors related to organization, grammar, and style Does not format data with a neat and professional appearance or include properly formatted APA-style citations and links; there are major errors related to organization, grammar, and style 10 Earned Total 100% FIN 320 Module Four Excel Assignment Rubric This assignment builds on the work you did for the Excel assignment in Module Three. To get started, find and open the file you submitted. From there, complete the following steps:
  • 11. 1. Financial Data Using the same company you selected in Module Three, add another two years of financial statement data so that you have three years of annual data to review for historical analysis. In all, your Excel file must include the following: o Three worksheets of annual balance sheet data o Three worksheets of annual income statement data o Three worksheets of annual statement of cash flow data Important Note: Be sure to label each worksheet in Excel with the appropriate year, as you did in the Module Three assignment. 2. Ratio Calculation On each data tab, use formulas to calculate the following financial indicators for each year of data: o Current ratio o Debt/equity ratio o Free cash flow o Earnings per share o Price/earnings ratio o Return on equity o Net profit margin 3. Written Responses
  • 12. In a separate Word document, respond to the following: o Describe how and why each of the ratios has changed over the three-year period. For example, did the current ratio increase or decrease? Why? Describe how three of the ratios you calculated for your company compare to the general industry. Find general industry data by entering your specific company’s ticker symbol here. Be sure to watch the Mergent Online video (written instructions can be found here), as it will help you find the industry data. 4. Professionalism, References, and Mechanics Format the data on all worksheets so that the file has a neat and professional appearance. Include links and properly formatted citations referencing the location of the data used. Your written responses should be free of errors in organization, grammar, and style. http://www.mergentonline.com.ezproxy.snhu.edu/basicsearch.ph p https://www.youtube.com/watch?v=FGcYg-WEt9g http://snhu- media.snhu.edu/files/course_repository/undergraduate/fin/fin32 0/fin320_mergent_online_instructions.pdf Guidelines for Submission: Submit an Excel file that meets the criteria described in the prompt. The written responses should be done in a Word document. Be sure to include both the Excel file and Word document.
  • 13. Citations should be formatted according to APA style. Critical Elements Exemplary (100%) Proficient (85%) Needs Improvement (55%) Not Evident (0%) Value Financial Data Meets “Proficient” criteria and presents information in a well- organized manner with clearly labeled tabs and data sections Includes three years of financial statement data (three annual balance sheets, three annual income statements, and three annual statements of cash flows) for the company selected, with minor errors or no errors Includes three years of financial statement data (three annual balance sheets, three annual income statements, and three annual statements of cash flows) for the company selected, with noticeable errors Does not include three years of financial statement data (three annual balance sheets, three annual income statements, and three annual statements of cash flows) for the company selected 20
  • 14. Ratio Calculation Meets “Proficient” criteria and presents information in a clear and well-organized manner Accurately calculates the financial indicators (current ratio, debt/equity ratio, free cash flow, earnings per share, price/earnings ratio, return on equity, and net profit margin), with minor errors or no errors Calculates the financial indicators (current ratio, debt/equity ratio, free cash flow, earnings per share, price/earnings ratio, return on equity, and net profit margin), with noticeable errors Does not calculate the financial indicators (current ratio, debt/equity ratio, free cash flow, earnings per share, price/earnings ratio, return on equity, and net profit margin) 40 Written Responses: Changes in Ratios Meets “Proficient” criteria and includes supporting details and data
  • 15. Describes how and why each of the ratios has changed over the three-year period in a clear and logical manner Describes how and why each of the ratios has changed over the three-year period but presents some information in an unclear or illogical manner Does not describe how and why each of the ratios has changed over the three-year period 15 Written Responses: Comparison to Industry Meets “Proficient” criteria and includes supporting details and data Describes how the selected ratios compare to the general industry in a clear and logical manner Describes how the selected ratios compare to the general industry but presents some information in an unclear or illogical manner
  • 16. Does not describe how the selected ratios compare to the general industry 15 Professionalism, References, and Mechanics Meets “Proficient” criteria, and the material is presented in an especially polished and easy to read format Formats data with a neat and professional appearance and includes properly formatted APA-style citations and links with minor errors or no errors; any errors related to organization, grammar, and style are minor Formats data and provides citations and links, but there are deficiencies in the appearance of the data and/or flaws in the citation formatting; there are some errors related to organization, grammar, and style Does not format data with a neat and professional appearance or include properly formatted APA-style citations
  • 17. and links; there are major errors related to organization, grammar, and style 10 Earned Total 100% Sheet: 2018 Balance Sheet Sheet: 2018 Income Statement Sheet: 2018 Cash Flows Sheet: 2018 Stock Prices Tesla, Inc. TESLA INC As Reported Annual Balance Sheet Balance Sheet Report Date 43465.0 Currency USD Audit Status Not Qualified Consolidated Yes Scale Thousands
  • 18. 11658.0 Dec 31, Dec 31, Dec 31, 2018.0 2017.0 2016.0 2015.0 Assets Current assets
  • 19. Cash and cash equivalents 3685618.0 3367914.0 3393216.0 1196908.0 Restricted cash and marketable securities 192551.0 105519.0 22628.0 - current Accounts receivable 949022.0 515381.0 499142.0 168965.0 Inventory 3113446.0 2263537.0
  • 20. 2067454.0 1277838.0 Prepaid expenses and other current assets 365671.0 268365.0 194465.0 115667.0 Total current assets 8306308.0 6570520.0 6259796.0 2782006.0
  • 21. Operating lease vehicles, net 2089758.0 6570520.0 3134080.0 1791403.0 Solar energy systems, leased and to be leased, 6271396.0 6570520.0 5919880.0 ? net Property, plant and equipment, net 1.1330077E7 6570520.0 5982957.0 3403334.0 Intangible assets, net
  • 22. 282492.0 6570520.0 376145.0 12574.0 My Power customer notes receivable, net 421548.0 6570520.0 506302.0 ? of current portion Restricted cash, net of current portion 398219.0 6570520.0 268165.0 31522.0 Other assets 571657.0
  • 24. Current liabilities Accounts payable 3404451.0 2390250.0 1860341.0 916148.0 Accrued and other current liabilities 2094253.0 1731366.0 1210028.0 422798.0 Deferred revenue
  • 25. 630292.0 1015253.0 763126.0 423961.0 Resale value guarantees 502840.0 787333.0 179504.0 136831.0 Customer deposits 792601.0 853919.0 663859.0 283370.0 Current portion of long-term debt and capital 2567699.0 796549.0
  • 26. 1150147.0 627927.0 leases (1) Total current liabilities 9992136.0 7676670.0 5827005.0 2811035.0 Long-term debt and capital leases, net 5969500.0 2021093.0
  • 27. of current portion (1) 9403672.0 9418319.0 Deferred revenue, net of current portion 990873.0 1177799.0 851790.0 446105.0 Resale value guarantees, net of current 328926.0 2309222.0 2210423.0 1293741.0 portion Other long-term liabilities 2710403.0 2442970.0 1891449.0
  • 28. 364976.0 Total liabilities 2.342601E7 2.302298E7 1.6750167E7 6936950.0 Redeemable noncontrolling interests 555964.0 397734.0 367039.0 ? in subsidiaries Convertible senior notes (1)(2)
  • 30. Total liabilities and equity 2.9739614E7 2.8655372E7 2.2664076E7 8067939.0 Reference United States Securities and Exchange Commission (2019). Form 10-k - Tesla Inc. Acccessed at:https://www.sec.gov/Archives/edgar/data/1318605/00015645 9018002956/tsla-10k_20171231.htm Tesla, Inc. Income Statement As Reported Annual Income statement Report Date 43465.0 Currency USD Audit Status Not Qualified
  • 34. Energy generation and storage 131385.0 23334.0 11494.0 Services and other 159123.0 126375.0 85878.0
  • 35. Total revenue 2.1461268E7 1.1758751E7 7000132.0 Cost of revenue 1372604.0 1355102.0 831349.0
  • 37. 1517061.0 896441.0 Energy generation and storage 127779.0 24281.0 10134.0 Services and other 177152.0 120359.0 89240.0
  • 38. Total cost of revenue (1) 1.7419247E7 9536264.0 5400875.0 Gross profit 4042021.0 2222487.0 1599257.0 Operating expenses
  • 39. 1460370.0 1378073.0 834408.0 Research and development (1) Selling, general and administrative (1) 2834491.0 336811.0 288654.0
  • 40. Total operating expenses 4294861.0 3854573.0 2266597.0 Income (loss) from operations -252840.0 85622.0
  • 41. -260333.0 Interest income 2179.0 2858.0 750.0 Interest expense (2)(3) -663071.0 -46713.0 -38617.0 Other income (expense), net (4)
  • 42. 121224.0 -11756.0 -17149.0 Income (loss) before income taxes -1004745.0 -2209032.0 -746348.0
  • 43. Provision for income taxes 11070.0 8133.0 5048.0 Net income (loss) -219469.0 21878.0
  • 44. -320397.0 Net income (loss) attributable to noncontrolling -98132.0 $? $? interests and redeemable noncontrolling interest Net income (loss) attributable to common -976091.0 -1961400.0
  • 45. -674914.0 stockholders Net income (loss) per common share attributable to common stockholders: Basic
  • 47. Shares used in per share calculation: Basic 170525.0 165758.0
  • 49. Notes: (1) Includes stock-based compensation expense of the following for the periods presented: Cost of revenue 8562.0 8939.0 5995.0 Research and development
  • 50. 41304.0 40220.0 25452.0 Selling, general and administrative 37845.0 40384.0 24158.0
  • 51. Total stock-based compensation expense 87711.0 89543.0 55605.0 (2) Interest expense includes non-cash 39915.0
  • 52. 33135.0 27285.0 interest expense related to convertible notes and other borrowing for the periods presented: (3) Interest expense includes the following as a result of the assumed debt from SolarCity: Interest expense (excluding amortization 5476.0
  • 53. $? $? of debt discount and fees)?recourse debt Interest expense (excluding amortization 10007.0 ? ? of debt discount and fees)?non-recourse debt
  • 54. 15483.0 $? $? (4) Includes one-time gain on acquisition
  • 55. of SolarCity of $88.7 million recognized during Q4 2018. ____________________________ Tesla Inc. (2019). Annual Reports. Retrieved from: http://www.annualreports.com/Company/tesla-motors Tesla, Inc. 8-K 02/22/2017 A report on Annual Cash Flows Cash Flows Report Date 43465.0 Currency USD Audit Status Not Qualified Consolidated Yes Scale Thousands
  • 56. Dec 31, Dec 31, Dec 31, Dec 31, 2018.0 2017.0 2016.0 2015.0 Cash flows from operating activities
  • 58. cash provided by (used in) operating activities: Depreciation and amortization 1901050.0 1636003.0 947049.0 422590.0 Stock-based compensation 749024.0 466760.0
  • 59. 334245.0 197999.0 Gain on acquisition of SolarCity -88727.0 ? ? ? Other -8068.0 67481.0
  • 60. 106826.0 236864.0 Change in operating assets and liabilities, net of impact of business combination Accounts receivable -496732.0 -24635.0 -32106.0
  • 61. 46267.0 Inventory and operating lease vehicles -1023264.0 -178850.0 -482478.0 -1573860.0 Accounts payable and accrued liabilities 1722850.0 388206.0 174107.0
  • 65. Capital expenditures -521612.0 -247611.0 -411222.0 -1634850.0 Payments for the cost of solar energy systems, 159669.0 81139.0 ? ?
  • 66. leased and to be leased Cash acquired through (used in) business 213523.0 ? ? -12260.0 combination Change in restricted cash and other -126993.0 -20395.0 -3058.0 -26441.0
  • 67. Cash used in investing activities -594751.0 -268006.0 -414280.0 -1673551.0
  • 68. Cash flows from financing activities Proceeds (repayments) from debt activities, -5247057.0 -3995484.0 135000.0 318972.0
  • 69. net Collateralized borrowing -559167.0 511321.0 208793.0 568745.0 Net cash flows from noncontrolling interests 180277.0 ? ? ?
  • 70. Proceeds from issuance of common stock ? ? -20000.0 730000.0 in a public offering Other 11897.0 28499.0 -98755.0 -94194.0
  • 71. Cash provided by (used in) financing activities 1372827.0 -320870.0 225038.0 1523523.0
  • 72. Effect of foreign exchange rates on cash -22700.0 3182.0 -10037.0 -34278.0 and cash equivalents Net increase (decrease) in cash and cash 311429.0 -162044.0
  • 73. -229128.0 -708805.0 equivalents Cash at the beginning of the period 3084257.0 3246301.0 1426036.0 1905713.0
  • 74. Cash at the end of the period 3393216.0 3084257.0 1196908.0 1196908.0
  • 75. ____________________________ United States Securities and Exchange Commission (2019). Form 10-k - Tesla Inc. Acccessed at:https://www.sec.gov/Archives/edgar/data/1318605/00015645 9018002956/tsla-10k_20171231.htm STOCK PRICES Last seven days stock prices DATE CLOSE 76653.0 349.93 43780.0 345.09 43779.0 337.14 43778.0 335.54 43777.0 326.58 43411.0 317.22 43775.0 317.47 Rate of Return 9.27 "The stock had a 9.27 percent return over the period November 6th through November 12th 2019." FIN 320 Module Four Excel Assignment Rubric This assignment builds on the work you did for the Excel assignment in Module Three. To get started, find and open the
  • 76. file you submitted. From there, complete the following steps: 1. Financial Data Using the same company you selected in Module Three, add another two years of financial statement data so that you have three years of annual data to review for historical analysis. In all, your Excel file must include the following: o Three worksheets of annual balance sheet data o Three worksheets of annual income statement data o Three worksheets of annual statement of cash flow data Important Note: Be sure to label each worksheet in Excel with the appropriate year, as you did in the Module Three assignment. 2. Ratio Calculation On each data tab, use formulas to calculate the following financial indicators for each year of data: o Current ratio o Debt/equity ratio o Free cash flow o Earnings per share o Price/earnings ratio o Return on equity o Net profit margin
  • 77. 3. Written Responses In a separate Word document, respond to the following: o Describe how and why each of the ratios has changed over the three-year period. For example, did the current ratio increase or decrease? Why? Describe how three of the ratios you calculated for your company compare to the general industry. Find general industry data by entering your specific company’s ticker symbol here. Be sure to watch the Mergent Online video (written instructions can be found here), as it will help you find the industry data. 4. Professionalism, References, and Mechanics Format the data on all worksheets so that the file has a neat and professional appearance. Include links and properly formatted citations referencing the location of the data used. Your written responses should be free of errors in organization, grammar, and style. http://www.mergentonline.com.ezproxy.snhu.edu/basicsearch.ph p https://www.youtube.com/watch?v=FGcYg-WEt9g http://snhu- media.snhu.edu/files/course_repository/undergraduate/fin/fin32 0/fin320_mergent_online_instructions.pdf Guidelines for Submission: Submit an Excel file that meets the criteria described in the prompt. The written responses should
  • 78. be done in a Word document. Be sure to include both the Excel file and Word document. Citations should be formatted according to APA style. Critical Elements Exemplary (100%) Proficient (85%) Needs Improvement (55%) Not Evident (0%) Value Financial Data Meets “Proficient” criteria and presents information in a well- organized manner with clearly labeled tabs and data sections Includes three years of financial statement data (three annual balance sheets, three annual income statements, and three annual statements of cash flows) for the company selected, with minor errors or no errors Includes three years of financial statement data (three annual balance sheets, three annual income statements, and three annual statements of cash flows) for the company selected, with noticeable errors Does not include three years of financial statement data (three annual balance sheets, three annual income statements, and three annual statements of cash flows) for the company selected
  • 79. 20 Ratio Calculation Meets “Proficient” criteria and presents information in a clear and well-organized manner Accurately calculates the financial indicators (current ratio, debt/equity ratio, free cash flow, earnings per share, price/earnings ratio, return on equity, and net profit margin), with minor errors or no errors Calculates the financial indicators (current ratio, debt/equity ratio, free cash flow, earnings per share, price/earnings ratio, return on equity, and net profit margin), with noticeable errors Does not calculate the financial indicators (current ratio, debt/equity ratio, free cash flow, earnings per share, price/earnings ratio, return on equity, and net profit margin) 40 Written Responses: Changes in Ratios Meets “Proficient” criteria and
  • 80. includes supporting details and data Describes how and why each of the ratios has changed over the three-year period in a clear and logical manner Describes how and why each of the ratios has changed over the three-year period but presents some information in an unclear or illogical manner Does not describe how and why each of the ratios has changed over the three-year period 15 Written Responses: Comparison to Industry Meets “Proficient” criteria and includes supporting details and data Describes how the selected ratios compare to the general industry in a clear and logical manner Describes how the selected ratios compare to the general industry but presents some information in an unclear or
  • 81. illogical manner Does not describe how the selected ratios compare to the general industry 15 Professionalism, References, and Mechanics Meets “Proficient” criteria, and the material is presented in an especially polished and easy to read format Formats data with a neat and professional appearance and includes properly formatted APA-style citations and links with minor errors or no errors; any errors related to organization, grammar, and style are minor Formats data and provides citations and links, but there are deficiencies in the appearance of the data and/or flaws in the citation formatting; there are some errors related to organization, grammar, and style Does not format data with a neat and professional
  • 82. appearance or include properly formatted APA-style citations and links; there are major errors related to organization, grammar, and style 10 Earned Total 100% Sheet: 2018 Balance Sheet Sheet: 2018 Income Statement Sheet: 2018 Cash Flows Sheet: 2018 Stock Prices Tesla, Inc. TESLA INC As Reported Annual Balance Sheet Balance Sheet Report Date 43465.0 Currency USD Audit Status Not Qualified Consolidated Yes Scale Thousands
  • 83. 11658.0 Dec 31, Dec 31, Dec 31, 2018.0 2017.0 2016.0 2015.0 Assets Current assets
  • 84. Cash and cash equivalents 3685618.0 3367914.0 3393216.0 1196908.0 Restricted cash and marketable securities 192551.0 105519.0 22628.0 - current Accounts receivable 949022.0 515381.0 499142.0 168965.0 Inventory 3113446.0
  • 85. 2263537.0 2067454.0 1277838.0 Prepaid expenses and other current assets 365671.0 268365.0 194465.0 115667.0 Total current assets 8306308.0 6570520.0 6259796.0
  • 86. 2782006.0 Operating lease vehicles, net 2089758.0 6570520.0 3134080.0 1791403.0 Solar energy systems, leased and to be leased, 6271396.0 6570520.0 5919880.0 ? net Property, plant and equipment, net 1.1330077E7 6570520.0 5982957.0 3403334.0
  • 87. Intangible assets, net 282492.0 6570520.0 376145.0 12574.0 My Power customer notes receivable, net 421548.0 6570520.0 506302.0 ? of current portion Restricted cash, net of current portion 398219.0 6570520.0 268165.0 31522.0 Other assets
  • 89. Liabilities and Stockholders? Equity Current liabilities Accounts payable 3404451.0 2390250.0 1860341.0 916148.0 Accrued and other current liabilities 2094253.0 1731366.0 1210028.0 422798.0
  • 90. Deferred revenue 630292.0 1015253.0 763126.0 423961.0 Resale value guarantees 502840.0 787333.0 179504.0 136831.0 Customer deposits 792601.0 853919.0 663859.0 283370.0 Current portion of long-term debt and capital
  • 91. 2567699.0 796549.0 1150147.0 627927.0 leases (1) Total current liabilities 9992136.0 7676670.0 5827005.0 2811035.0 Long-term debt and capital leases, net 5969500.0
  • 92. 2021093.0 of current portion (1) 9403672.0 9418319.0 Deferred revenue, net of current portion 990873.0 1177799.0 851790.0 446105.0 Resale value guarantees, net of current 328926.0 2309222.0 2210423.0 1293741.0 portion Other long-term liabilities 2710403.0 2442970.0 1891449.0
  • 94. Convertible senior notes (1)(2) 8784.0 47285.0 Stockholders? equity 4752911.0 1083704.0 Noncontrolling interests in subsidiaries 834397.0 997346.0 785175.0 ?
  • 95. Total liabilities and equity 2.9739614E7 2.8655372E7 2.2664076E7 8067939.0 Reference United States Securities and Exchange Commission (2019). Form 10-k - Tesla Inc. Acccessed at:https://www.sec.gov/Archives/edgar/data/1318605/00015645 9018002956/tsla-10k_20171231.htm Tesla, Inc. Income Statement As Reported Annual Income statement Report Date 43465.0 Currency USD
  • 99. 1117007.0 Energy generation and storage 131385.0 23334.0 11494.0 Services and other 159123.0 126375.0 85878.0
  • 102. 1517061.0 896441.0 Energy generation and storage 127779.0 24281.0 10134.0 Services and other 177152.0 120359.0 89240.0
  • 103. Total cost of revenue (1) 1.7419247E7 9536264.0 5400875.0 Gross profit 4042021.0 2222487.0 1599257.0
  • 104. Operating expenses 1460370.0 1378073.0 834408.0 Research and development (1) Selling, general and administrative (1) 2834491.0 336811.0 288654.0
  • 106. 85622.0 -260333.0 Interest income 2179.0 2858.0 750.0 Interest expense (2)(3) -663071.0 -46713.0 -38617.0 Other income (expense), net (4)
  • 107. 121224.0 -11756.0 -17149.0 Income (loss) before income taxes -1004745.0 -2209032.0 -746348.0
  • 108. Provision for income taxes 11070.0 8133.0 5048.0 Net income (loss) -219469.0 21878.0
  • 109. -320397.0 Net income (loss) attributable to noncontrolling -98132.0 $? $? interests and redeemable noncontrolling interest Net income (loss) attributable to common -976091.0
  • 110. -1961400.0 -674914.0 stockholders Net income (loss) per common share attributable
  • 112. Shares used in per share calculation: Basic 170525.0
  • 114. Notes: (1) Includes stock-based compensation expense of the following for the periods presented: Cost of revenue 8562.0 8939.0 5995.0 Research and development
  • 115. 41304.0 40220.0 25452.0 Selling, general and administrative 37845.0 40384.0 24158.0
  • 116. Total stock-based compensation expense 87711.0 89543.0 55605.0 (2) Interest expense includes non-cash
  • 117. 39915.0 33135.0 27285.0 interest expense related to convertible notes and other borrowing for the periods presented: (3) Interest expense includes the following as a result of the assumed debt from SolarCity: Interest expense (excluding amortization 5476.0
  • 118. $? $? of debt discount and fees)?recourse debt Interest expense (excluding amortization 10007.0 ? ? of debt discount and fees)?non-recourse debt
  • 119. 15483.0 $? $? (4) Includes one-time gain on acquisition
  • 120. of SolarCity of $88.7 million recognized during Q4 2018. ____________________________ Tesla Inc. (2019). Annual Reports. Retrieved from: http://www.annualreports.com/Company/tesla-motors Tesla, Inc. 8-K 02/22/2017 A report on Annual Cash Flows Cash Flows Report Date 43465.0 Currency USD Audit Status Not Qualified Consolidated Yes Scale Thousands
  • 121. Dec 31, Dec 31, Dec 31, Dec 31, 2018.0 2017.0 2016.0 2015.0
  • 122. Cash flows from operating activities Net loss -1062582.0 -2240578.0 -773046.0 -888663.0 Adjustments to reconcile net loss to net
  • 123. cash provided by (used in) operating activities: Depreciation and amortization 1901050.0 1636003.0 947049.0 422590.0 Stock-based compensation 749024.0
  • 124. 466760.0 334245.0 197999.0 Gain on acquisition of SolarCity -88727.0 ? ? ? Other -8068.0 67481.0
  • 125. 106826.0 236864.0 Change in operating assets and liabilities, net of impact of business combination Accounts receivable -496732.0 -24635.0
  • 126. -32106.0 46267.0 Inventory and operating lease vehicles -1023264.0 -178850.0 -482478.0 -1573860.0 Accounts payable and accrued liabilities 1722850.0 388206.0 174107.0
  • 129. Cash provided by (used in) operating activities -448209.0 423650.0 -29849.0 -524499.0 Cash flows from investing activities
  • 130. Capital expenditures -521612.0 -247611.0 -411222.0 -1634850.0 Payments for the cost of solar energy systems, 159669.0 81139.0 ?
  • 131. ? leased and to be leased Cash acquired through (used in) business 213523.0 ? ? -12260.0 combination Change in restricted cash and other -126993.0 -20395.0 -3058.0
  • 132. -26441.0 Cash used in investing activities -594751.0 -268006.0 -414280.0 -1673551.0
  • 133. Cash flows from financing activities Proceeds (repayments) from debt activities, -5247057.0 -3995484.0 135000.0
  • 135. ? Proceeds from issuance of common stock ? ? -20000.0 730000.0 in a public offering Other 11897.0 28499.0 -98755.0 -94194.0
  • 136. Cash provided by (used in) financing activities 1372827.0 -320870.0 225038.0 1523523.0
  • 137. Effect of foreign exchange rates on cash -22700.0 3182.0 -10037.0 -34278.0 and cash equivalents Net increase (decrease) in cash and cash 311429.0 -162044.0
  • 138. -229128.0 -708805.0 equivalents Cash at the beginning of the period 3084257.0 3246301.0 1426036.0 1905713.0
  • 139. Cash at the end of the period 3393216.0 3084257.0 1196908.0 1196908.0
  • 140. ____________________________ United States Securities and Exchange Commission (2019). Form 10-k - Tesla Inc. Acccessed at:https://www.sec.gov/Archives/edgar/data/1318605/00015645 9018002956/tsla-10k_20171231.htm STOCK PRICES Last seven days stock prices DATE CLOSE 76653.0 349.93 43780.0 345.09 43779.0 337.14 43778.0 335.54 43777.0 326.58 43411.0 317.22 43775.0 317.47 Rate of Return 9.27 "The stock had a 9.27 percent return over the period November 6th through November 12th 2019."